


1. Introduction
Aldegonda Glacier, also known as Aldegondabreen in Norwegian, is one of the most extensively studied ice bodies in Svalbard. At present, the Arctic and Antarctic Research Institute is conducting regular monitoring of its proglacial runoff and glacier mass balance, and performing geophysical surveys, among other types of research. The first ice thickness estimates of the glacier date back to the second half of the 20th century. Subsequent geophysical investigations have identified a polythermal structure, with a basal layer of temperate ice beneath a cold ice layer (Navarro and others, Reference Navarro, Glazovsky, Macheret, Vasilenko, Corcuera and Cuadrado2005). Repeated ground-penetrating radar surveys have enabled assessments of volume changes over decadal timescales (Borisik and others, Reference Borisik, Novikov, Glazovsky, Lavrentiev and Verkulich2021a), the same method also being used to investigate the internal drainage network and subglacial runoff (Borisik and others, Reference Borisik, Demidov, Romashova and Novikov2021b). These surveys show that between 1999 and 2018–19, the glacier’s area decreased by 23% and its volume by 36%, and the volume of the temperate ice roughly halved.
The water balance of the river originating from the glacier and the characteristics of the freshwater discharge into the fjord have also been documented (Romashova and others, Reference Romashova, Chernov and Vasilevich2019; Nowak and others, Reference Nowak2021) showing that glacial runoff accounts for 41–53% of the total freshwater input to Grønfjorden. In terms of glacier–atmosphere interactions, recent studies have examined the glacier’s surface energy balance during the ablation season (Prokhorova and others, Reference Prokhorova, Terekhov, Ivanov and Demidov2023) as well as the impact of extreme weather events on its melt rates and runoff (Prokhorova and others, Reference Prokhorova2025). It was shown that shortwave radiation contributes the most to seasonal-scale melting (for example, in 2021, its contribution accounted for 90% of the incoming energy), whereas extreme melting on a daily timescale is driven by a substantial increase in turbulent heat fluxes, which occurs under specific synoptic conditions. Research has also addressed the formation of soil in cryoconite holes on the glacier’s surface (Langford and others, Reference Langford, Hodson and Banwart2011; Zazovskaya and others, Reference Zazovskaya2022), along with the diversity of microbial communities inhabiting the ice surface (Zarsky and others, Reference Zarsky2013). In addition to these studies, the glacier has been the subject of paleogeographic investigations and Holocene history reconstructions (e.g. Kokin and Kirillova, Reference Kokin and Kirillova2017).
As for the mass balance, although sporadic measurements were taken during the 20th century, systematic monitoring using direct (glaciological) method only began in 2002/03. As a result, Aldegondabreen’s is by no means the longest continuous mass-balance record in the archipelago. However, the nearby settlement of Barentsburg is one of the earliest locations on the archipelago to experience regular human activity—initially as a whaling station, later with the construction of a radio mast and eventually due to mining operations. Due to this long-standing presence, a substantial archive of historical materials has accumulated that allows for a reconstruction of the glacier’s mass balance back to the early 20th century (Holmlund, Reference Holmlund2021). As a result, we now have access to a unique, century-long mass-balance record, beginning around the end of the Little Ice Age in this region.
In recent years, based on our monitoring data, we have observed a marked decline in glacier mass balance that started in the early 2010s (Terekhov and others, Reference Terekhov2023). In this paper, we report on: (1) summarizing the available instrumental record of Aldegondabreen’s mass balance from 1911 to 2024; (2) identification of the main drivers of the record-high glacier mass loss observed in recent decade in Svalbard; and (3) placing the recent Aldegondabreen retreat in a broader temporal context by referencing past Holocene episodes of greater ice loss, as inferred from paleoenvironmental studies.
2. Materials and methods
2.1. Study site
Aldegondabreen (5.0 km2 as of 2024) is a glacier located on Nordenskiöld Land, West Spitsbergen, near the western, warmer coast (Hanssen-Bauer and others, Reference Hanssen-Bauer, Hanssen-Bauer, Hisdal, Mayer, Sandø and Sorteberg)2019). Glaciation in this area is generally sparse, likely due to the relatively low elevation, and the glaciers are among the smallest in Svalbard (Nuth and others, Reference Nuth2010). At the same time, they are shrinking at the fastest rate, having lost more than half of their area over the past ∼80 years (Chernov and Muravyev, Reference Chernov and Muraviev2018).
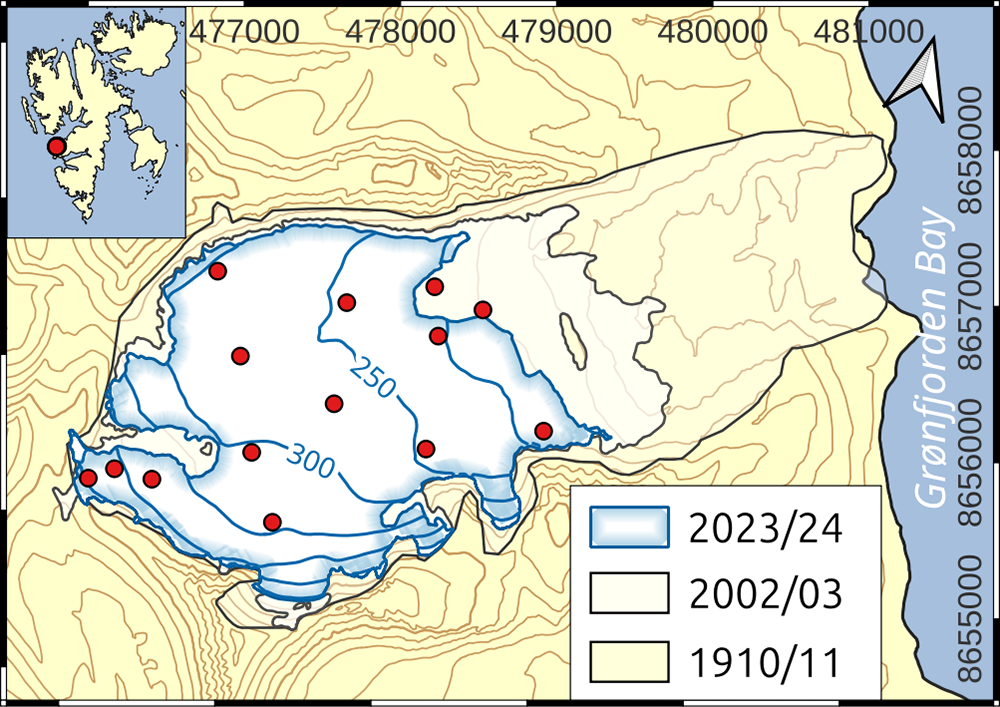
The mass balance of Aldegondabreen is monitored annually using a network of ablation stakes, with the balance year ending in mid-September. The latest layout of stakes has remained unchanged since 2013 (Fig. 1), except for two lower stakes, which were lost due to terminus retreat in 2024. There is no firn zone present on the glacier, and over the last decade, seasonal snow has been completely melting by late summer (Terekhov and others, Reference Terekhov2023).

Figure 1. Ablation stakes (red dots) on the Aldegondabreen and changes in the glacier’s outline (black lines).
2.2. Mass-balance data
The glacier-wide annual mass balance of Aldegondabreen is calculated using the profile method, based on a vertical mass-balance profile. This profile is derived from the stake measurements and approximated as a linear function of elevation. The average mass balance is computed as a weighted mean over 50-m elevation intervals, with each interval weighted according to its share of the total glacier area. The procedure for estimating uncertainties has been described in detail by Terekhov and others (Reference Terekhov2023). Uncertainties of up to 0.25 m w.e. have been obtained, which are typical of mass-balance studies performed by the direct method, as summarized in the review of glaciological measurement uncertainties by Klug and others (Reference Klug2018).
Since 2008, the geodetic mass balance has also been calculated over approximately five year intervals. These calculations serve, among other purposes, to assess potential systematic bias in the glaciological method. Previously published intervals include 2008–13 and 2013–18. In this study, we present the results for the 2018–24 interval, derived from the subtraction of digital elevation models (DEMs) obtained through ground-based Global Navigation Satellite Systems (GNSS) surveys conducted by our team. The geodetic mass balance for the 20th century has been recalculated using the surface elevation change data published by Holmlund (Reference Holmlund2021). We converted the reported elevation changes into water equivalent units by multiplying them by a glacier density of 850 ± 60 kg m−3, following Huss (Reference Huss2013), who recommends this value as representative under a wide range of conditions. It accounts for the fact that the geodetic ‘density’ is typically lower than pure ice due to firn layers and variations in firn compaction related to mass balance changes.
2.3. Climate data
To assess the relationship between the Aldegondabreen mass balance and the local climate, we used near-surface air temperature, precipitation and wind speed data collected at the nearest weather station (WMO identifier 20107), located on the opposite shore of Grønfjorden Bay in Barentsburg at 76 m a.s.l., approximately 10 km northeast of the glacier.
To assess a similar relationship with larger-scale climate fluctuations, we first downloaded the GISS’s Surface Temperature Analysis (GISTEMP) dataset, which provides globally and hemispherically averaged surface air temperature (SAT) anomalies relative to the 1951–80 climate normal. The dataset covers the period from 1880 to 2024 (GISTEMP Team, 2025). It is regularly updated using current data from NOAA’s Global Historical Climatology Network version 4 dataset (land-based meteorological stations) and Extended Reconstructed Sea Surface Temperature version 5 database (ocean surface temperatures), following the methodology described by Hansen and others (Reference Hansen, Ruedy, Sato and Lo2010) and Lenssen and others (Reference Lenssen, Schmidt, Hendrickson, Jacobs, Menne and Ruedy2024).
To adjust the SAT anomalies for the Northern Hemisphere to a pre-industrial baseline (1850–1900), we used the Berkeley Earth dataset (Berkeley Earth, 2021), which extends further back in time. According to this dataset, the average SAT in the Northern Hemisphere during the pre-industrial period was 0.43°C lower than in the 1951–80 baseline. We applied this offset to the original GISTEMP time series, which was then used for correlation analysis and is plotted in subsequent figures.
3. Results and discussion
3.1. A centennial of mass balance
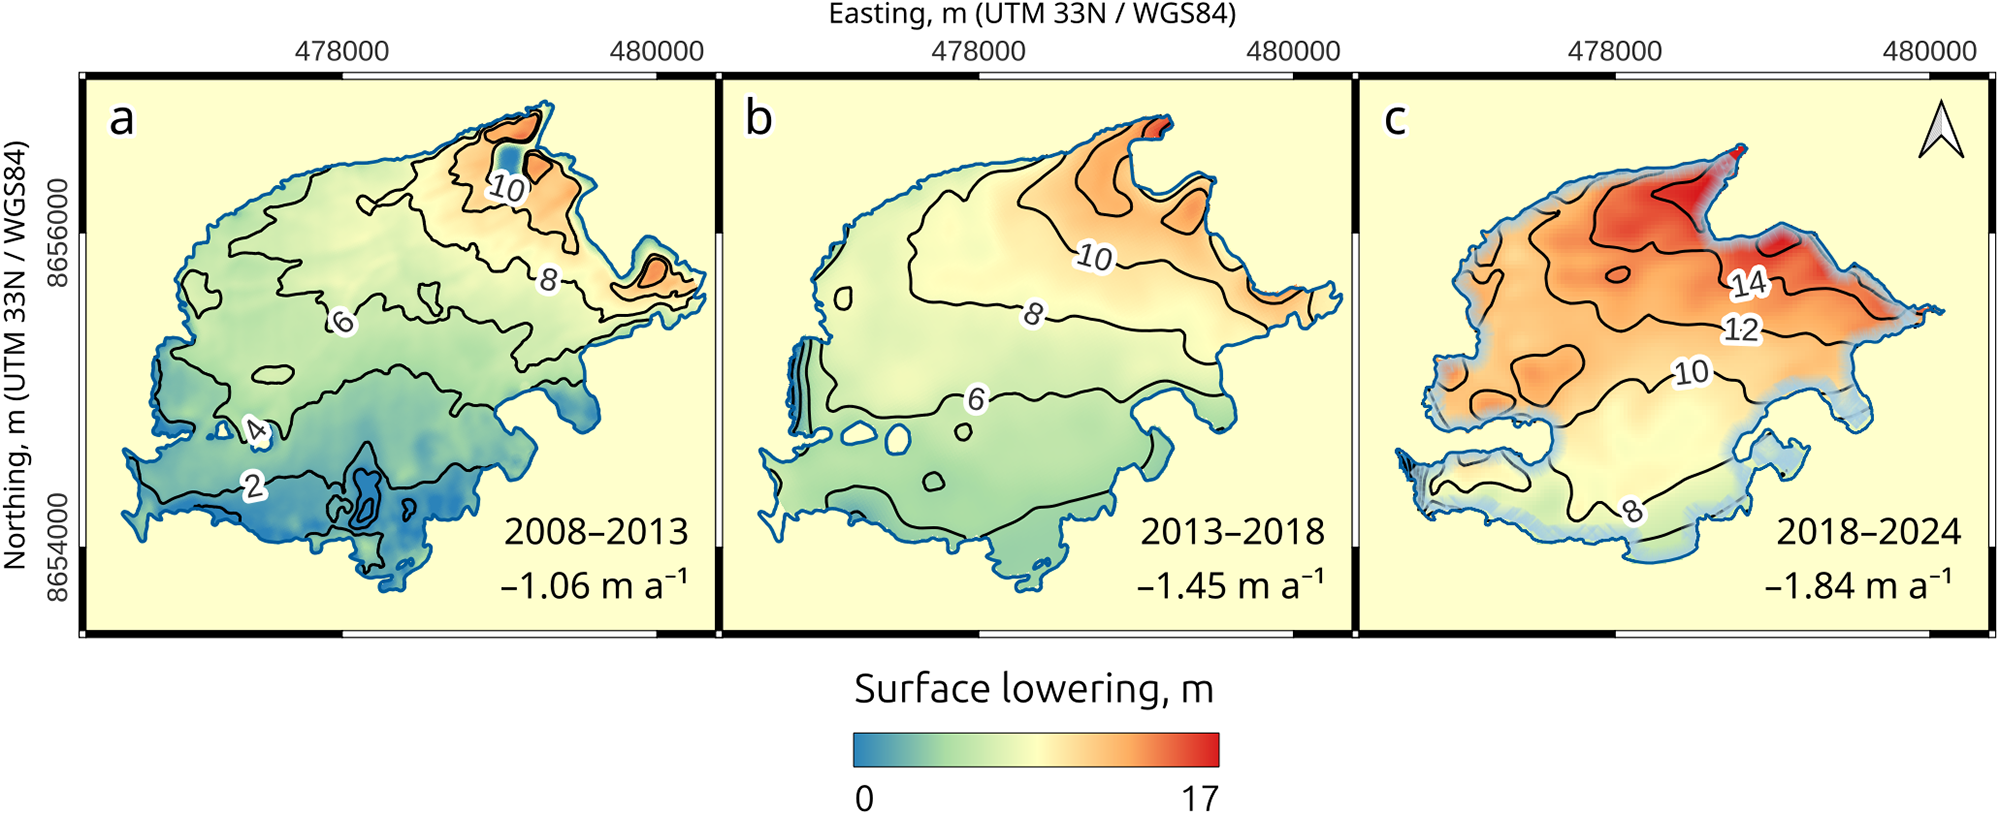
In the last decade, the monitoring strategy has been designed to incorporate multiple complementary methods (e.g. geodetic and geophysical surveys) in order to control for potential systematic errors arising in glaciological mass-balance measurements. An additional outcome has been a more detailed mapping of melting patterns, which was not feasible using the sparse network of ablation stakes alone. As a result, we now have three geodetic mass-balance intervals that complement those previously reported by Holmlund (Reference Holmlund2021): (1) 2008–13, based on Norwegian Polar Institute orthophotos derived from aerial imagery and ArcticDEM strips; (2) 2013–18, ArcticDEM strips versus our ground-based GNSS survey; and (3) 2018–24, both based on our ground-based GNSS surveys. The latter period covers six melt seasons, compared to five each in the other two. Nevertheless, the mean annual area-averaged surface lowering has increased over time (Fig. 2), confirming with independent data that the extreme melting observed in recent years is not a result of systematic errors in our glaciological monitoring.

Figure 2. Recent surface elevation changes in the Aldegondabreen. (a) 2008–13. (b) 2013–18. (c) 2018–24.
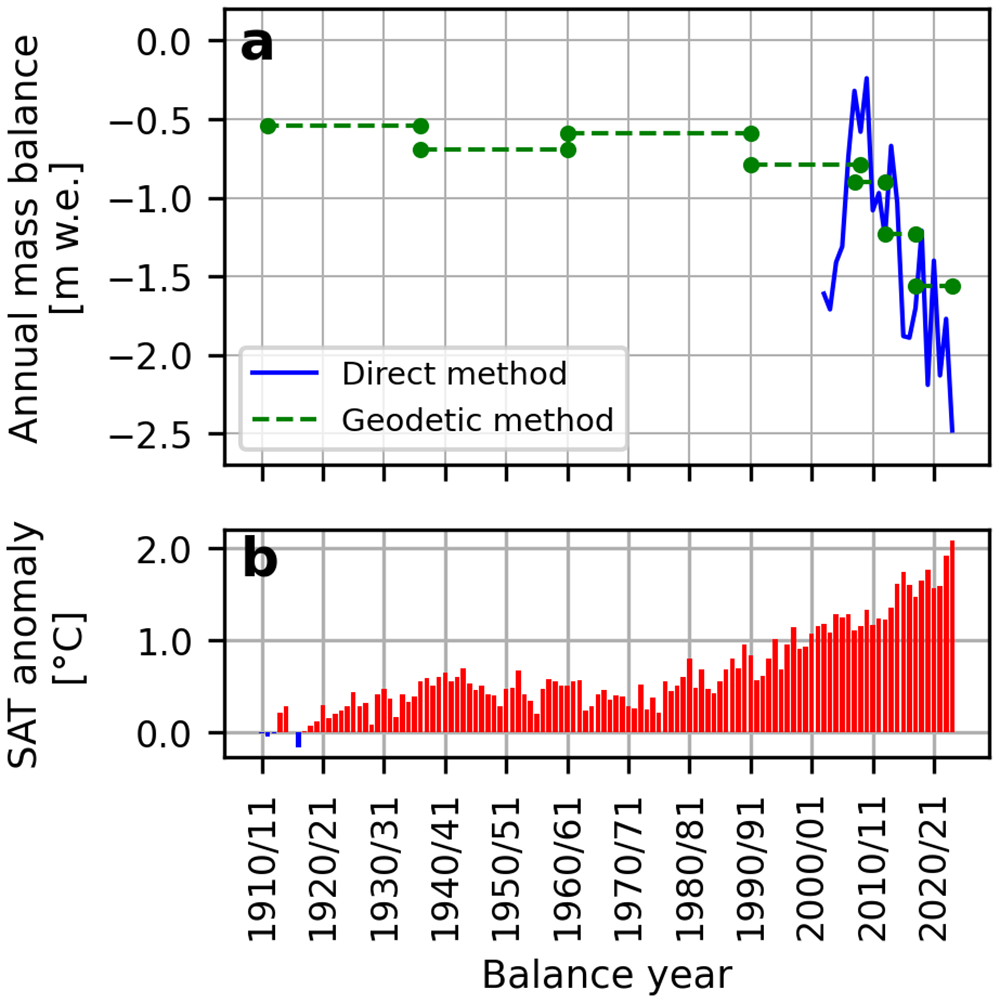
The composite mass-balance series since the early 21st century (the series that can be constructed for Aldegondabreen without resorting to paleoclimatic reconstructions, but rather based on direct measurements or DEM differencing) shows a sharp intensification of mass loss since the mid-2000s (Fig. 3).

Figure 3. (a) Mass balance of the Aldegondabreen. (b) Northern Hemisphere surface air temperature anomalies relative to the pre-industrial period.
Over the last five seasons (2019/20–2023/24), the direct mass-balance measurements have been the most negative values on record, with the glacier losing an average of −2.0 m w.e. a−1. We used a conservative value for the density of the melt layer—850 ± 60 kg m−3. However, there is no longer any firn or perennial snow on Aldegondabreen (firn was present throughout most of the 20th century, but has completely disappeared in recent decades). As a result, the mass losses are occurring almost entirely through the melting of glacier ice. If a more realistic density value—closer to 900 kg m−3—is applied to the recent direct measurements, the specific mass balance in the first quarter of the 21st century becomes even more negative and the contrast with 20th-century conditions becomes markedly more dramatic.
As illustrated in Fig. 3, the mass balance of Aldegondabreen remained negative on a decadal time scale throughout the entire 20th century, even before the onset of modern accelerated warming in the 1980s. This suggests that, even under the highly unlikely scenario of sharply reduced greenhouse gas emissions and a return to mid-20th-century temperature levels, Aldegondabreen would likely continue to lose mass.
3.2. Drivers of the record-high mass loss at the Aldegondabreen
3.2.1. Relationship with local climate
In our recent study analyzing mass-balance data from Aldegondabreen for the years 2002–20, no statistically significant trends were identified (Terekhov and others, Reference Terekhov2023). This result was notable given the well-documented positive temperature trends in the Svalbard region during the same timeframe (Nordli and others, Reference Nordli2020). However, the inclusion of the five most recent years—now among the warmest on record not only across the Svalbard archipelago but also globally—together with an extension of the time series backward using geodetic method, has made the underlying mass-loss trend clearly detectable. A pronounced increase in mass loss from Aldegondabreen has become evident, whereas it remained obscured when only the original, shorter record was considered.
The annual mass balance of a glacier is the net result of two opposing processes: accumulation and ablation. These components can be considered separately when attempting to identify the main drivers of mass loss. In light of this, snowpack height, density and snow water equivalent during the peak accumulation period (April–May) were regularly monitored in the study area, specifically within the catchment regions surrounding Grønfjorden. No statistically significant trends were observed in these variables between 2000 and 2025, including within the Aldegondabreen and in neighboring catchments (Vasilevich and Tretiakov, Reference Vasilevich and Tretiakov2025). This indicates that the winter mass balance of the glacier has remained relatively stable despite notable winter warming trends. Therefore, summer ablation, rather than winter accumulation, appears to be the primary driver of the recent mass loss of Aldegondabreen.
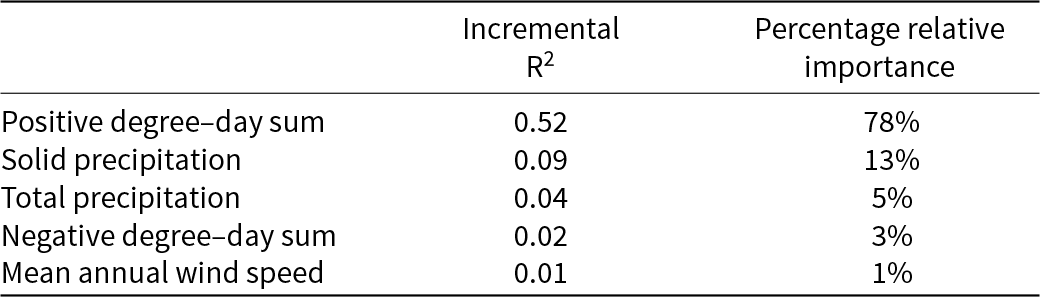
Although it is a well-established fact that the main factor controlling glacier retreat in the Arctic is rising air temperature (e.g. Rounce and others, Reference Rounce2023; The GlaMBIE Team, 2025), we analyzed the available meteorological records from the Barentsburg weather station in order to rank the relative influence of different factors on the melting of Aldegondabreen. There are several methods to perform this, such as principal component analysis or random forest, but we chose the simplest and most interpretable statistical approach: dominance analysis. This method involves examining all possible regression models that can be formed from the input variables. In our study, five annual predictors were selected: positive and negative degree–days sums, total precipitation, solid precipitation and mean wind speed, resulting in a total of 31 possible models. These predictors were chosen because they have previously been shown to correlate with the mass balance of Arctic glaciers (see, e.g. Hagen and Liestøl, Reference Hagen and Liestøl1990; Trachsel and Nesje, Reference Trachsel and Nesje2015) and are simultaneously available for the Barentsburg weather station.
For each predictor, dominance analysis quantifies its additional contribution, measured as the increase in R2 (‘Incremental R2’) when the predictor is added to a subset model containing all other predictors (Azen and Budescu, Reference Azen and Budescu2003). Finally, the Percentage relative importance of each predictor is determined by dividing its overall average incremental R2 contribution by the R2 of the full regression model. The results of the analysis are presented in Table 1. As expected, the leading factor explaining the observed melting of Aldegondabreen is the positive degree–day sum.
Table 1. Relative contribution of meteorological variables measured in Barentsburg to the Aldegondabreen’s annual mass balance (results of the dominance analysis).

However, the strong relationship with the local climate in the Barentsburg area, first, does not provide any insight into how representative the observed melting is for the entire Svalbard archipelago, and second, does not clarify any of the climatic mechanisms behind the ongoing climate change on the archipelago. Therefore, we now turn to the glacier melt in a broader context, considering it against regional climatic trends.
3.2.2. Relationship with global climatic trends
In recent years (particularly in 2022 and 2024), the Svalbard archipelago has experienced prolonged heatwaves: extended periods of persistently increased SAT during summer months. The mechanisms that drive these extreme climatic events were detailed by van den Broek and others (Reference van den Broek, Urbancic, Rantanen and Vihma2025). The latest unusually warm summer in the Svalbard region (2024) was driven by atmospheric circulation through a persistent southerly flow associated with a stable pressure pattern, with a low-pressure anomaly to the west and a high-pressure area (anticyclone) to the east. This pressure gradient resulted in a sustained southerly flow of air that consistently transported warm air into the region. Additional contributions came from the anomalously warm Norwegian and Barents Seas, which further intensified the warming of air masses traveling from northern Eurasia toward Svalbard.
Such circulation patterns are linked to the behavior of the jet stream in the upper troposphere as well as the occurrence of atmospheric blocking. Specifically, when the jet stream becomes highly meridional, its typical meandering shape can be amplified, resulting in the development of blocking highs that trap warm or cold air masses, potentially creating persistent weather extremes. Van den Broek and others (Reference van den Broek, Urbancic, Rantanen and Vihma2025) demonstrated that during the record-breaking summer of 2024, the jet stream indeed exhibited more meridional features and extended deep into the central Arctic. Although such detailed analyses of the causes of extreme summer SAT increases in Svalbard only exist for selected years, these studies have established a notable uptrend in atmospheric blocking leading to enhanced poleward energy transport over the past four decades (You and others, Reference You, Tjernström, Devasthale and Steinfeld2022).
Previous studies have also reported that similar circulation patterns involving a persistent high-pressure system forming over the Ural Mountains and Western Siberia—a phenomenon known as Ural Blocking—can result in the advection of warm air masses from the mid-latitudes, leading to positive temperature anomalies of up to 8°C in the Svalbard region (Crasemann and others, Reference Crasemann2017). Although most climate models project a future decline in blocking frequency across the Northern Hemisphere, summertime Ural Blocking is expected to intensify significantly under ongoing climate change (Lapointe and others, Reference Lapointe2024).
It remains unclear whether the persistent circulation regimes that drive extreme melt in Svalbard will become more frequent in the near future (van den Broek and others, Reference van den Broek, Urbancic, Rantanen and Vihma2025). What is clear, however, is that these events are not merely local in scale: they are linked to synoptic-scale atmospheric dynamics that affect vast sub-continental regions. This behavior is not unique to Svalbard. For example, data from U.S. benchmark glaciers showed that year-to-year variations in mass balance in the North Cascades Range (northwest contiguous USA) were highly correlated between glaciers, and any of the studied glaciers could be used to infer temporal mass variations for the entire region (Fountain and others, Reference Fountain, Hoffman, Granshaw and Riedel2009). These observations highlight the strong influence of large-scale climatic forcing on glacier mass balance. Although the response of individual glaciers varies according to their specific characteristics and local climatic settings, benchmark glaciers nevertheless provide important, directly measured indicators of how hemispheric and global climate variability affects glacier systems.
Within this context, 2024 stands out as a critical year: it was the first year in which the global average temperature exceeded the symbolic threshold of 1.5°C above pre-industrial levels (World Meteorological Organization, 2024; van den Broek and others, Reference van den Broek, Urbancic, Rantanen and Vihma2025). In addition, this was the year in which the Aldegondabreen exhibited its most negative mass balance to date, with an average loss of −2.48 m w.e. a−1; a stark contrast to the long-term average of −0.64 m w.e. a−1 over the first centennial period of the mass-balance record (1910–2008). This record on Aldegondabreen also represented the archipelago-wide maximum of ice loss: in 2024, glacier melting reached an anomaly of up to four standard deviations, exceeding any previous observations and causing a loss of about 1% of the total Svalbard glacier volume (Schuler and others, Reference Schuler2025).
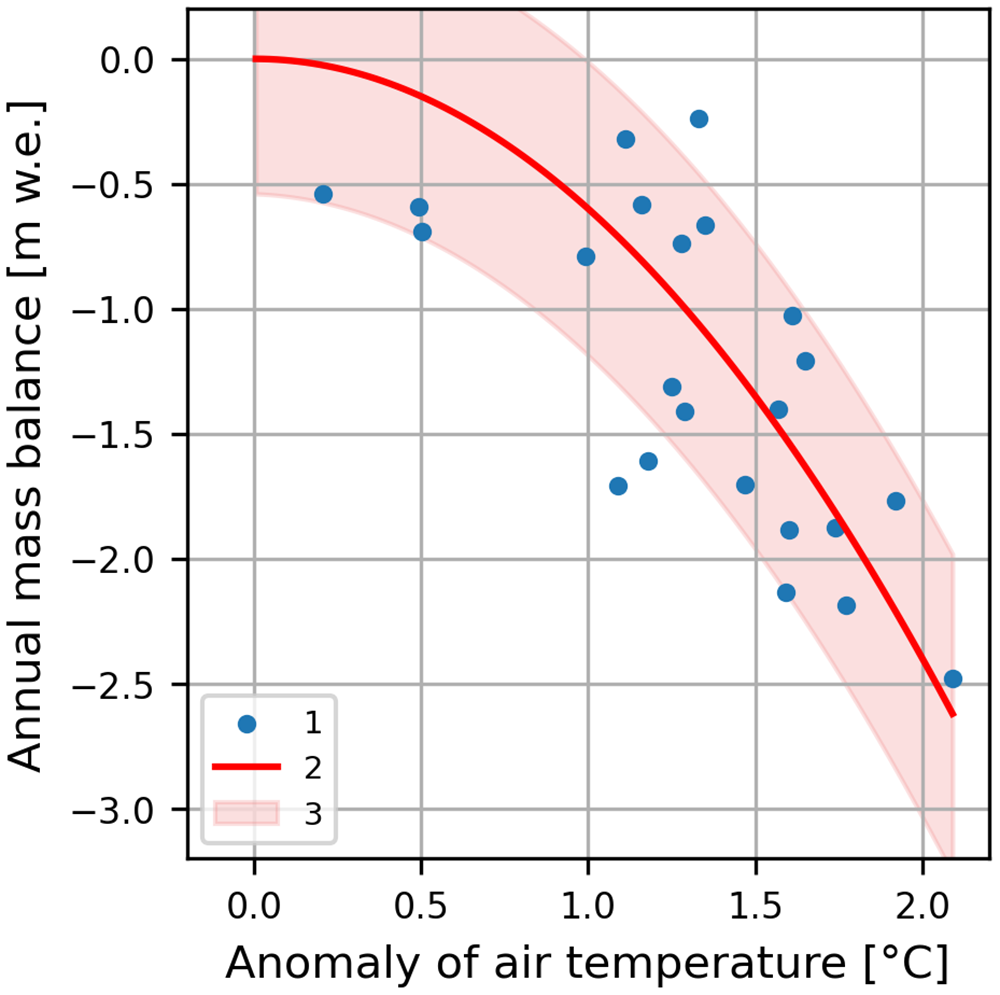
This warming is not only evident in meteorological records from Barentsburg but also in hemispheric-scale SAT datasets. In fact, SAT anomalies in the Northern Hemisphere show a relatively strong relationship (R2 = 0.49 for the quadratic fit) with the available mass-balance measurements for the Aldegondabreen since 1910/11 (Fig. 4). These findings suggest that the glacier’s response reflects broader climate trends rather than being solely driven by local microclimatic conditions near Barentsburg, with hemispheric air temperature explaining about half of the mass balance variance (R2 = 0.46).

Figure 4. Relationship between Aldegondabreen mass balance and Northern Hemisphere surface air temperature anomalies (relative to 1850–1900): 1—measured mass balance values, 2—quadratic fit, 3—95%-prediction band.
3.3. How unprecedented is the mass loss?
3.3.1. Remaining ice volume
Based on the most recent ground-penetrating radar survey, the ice volume of the glacier in 2018 was estimated at 0.278 km3, corresponding to a mean ice thickness of 52 m (or approximately 44 m w.e.) (Borisik and others, Reference Borisik, Novikov, Glazovsky, Lavrentiev and Verkulich2021a). Taking into account the cumulative mass balance from 2018/19 to 2024/25, which amounted to −11.2 m w.e. based on glaciological measurements, the average ice thickness by the beginning of 2025 would have decreased to approximately 33 m w.e. Given that the mean melt rate over the most recent pentad is −2.0 m w.e. a−1 (equivalent to −20 m per decade), the current decadal-scale mass loss is now approaching the magnitude of the total ice reserve.
Previous studies have demonstrated that the spatial variability of glacier melt is strongly influenced by insolation: the spatial variability in melt rates at a given elevation, caused by differences in insolation, corresponds to an equivalent surface elevation difference of approximately 50 m (Terekhov and others, Reference Terekhov, Prokhorova and Demidov2024). The northern part of Aldegondabreen, which is not shaded by surrounding rock formations, experiences more intense melting at similar elevations above sea level. Conversely, the zone of maximum ice thickness (180 m in 2018, currently estimated at about 170 m based on geodetic measurements), which contains temperate ice (Borisik and others, Reference Borisik, Novikov, Glazovsky, Lavrentiev and Verkulich2021a), is located in the southern part of the valley (Fig. 2), where shading by the valley walls substantially reduces solar radiation. As a result, spatial variations in shading and insolation introduce strong spatial heterogeneity in melt rates, which prevents straightforward linear extrapolation of glacier-wide mass loss.
3.3.2. Past episodes of greater ice loss
The history of the glacier that once occupied the valley where the modern Aldegondabreen is located can be traced through paleogeographic evidence back to the Early Holocene. The retreat of the Last Glacial Maximum ice sheet was rapid, driven by relatively high atmospheric temperatures—estimated to be 1–2°C warmer than present-day values in the study area (Birks, Reference Birks1991)—and by ocean temperatures that were at least 6°C higher than today. These temperature peaks occurred around 10.0 and 9.2 thousand years ago (ka), during the Holocene Thermal Maximum (Mangerud and Svendsen, Reference Mangerud and Svendsen2017; Farnsworth and others, Reference Farnsworth2020). However, the paleo-Aldegondabreen, which was a tidewater glacier at that time, may have undergone minor advances around 10.8 ka in the shallow fjord, forming a grounding-line fan (Jóhannesdóttir, Reference Jóhannesdóttir2021).
During the subsequent glacial minimum in the mid-Holocene (approximately 8–6 ka), small glaciers, such as the paleo-Aldegondabreen, may have disappeared completely on Svalbard, as suggested by the absence of glacial deposits on the floors of the major fjords (Farnsworth and others, Reference Farnsworth2020), while only the highest-elevation ice caps persisted (Auer, Reference Auer2025).
Finally, a pronounced Neoglacial cooling began around 4000 years BP (Grinis and others, Reference Grinis, Simonsen, Buchardt, White and Vinther2014). This period of lowered temperatures lasted until the early 20th century, peaked during the Little Ice Age and triggered a renewed readvance of glaciers. In the study area, Kokin and Kirillova (Reference Kokin and Kirillova2017) inferred that the maximum extent of the glaciers around Grønfjorden Bay occurred during the Treskelen stage, dated at 1900 ± 300 yr BP based on the most recent chronological evidence (Philipps and others, Reference Philipps2017). Their conclusion was supported by radiocarbon dates from marine sediments (1980 ± 160 and 2050 ± 120 cal yr BP) on the distal side of the push moraine of the Vestre Grønfjordbreen Glacier, located a few kilometers south of Aldegondabreen (Kokin and Kirillova, Reference Kokin and Kirillova2017). However, it should be noted that this push moraine may have resulted from a glacier surge event that did not necessarily coincide with the region-wide glacier advances across Svalbard. Nevertheless, based on the distribution of moraines in the study area, glaciers in the Grønfjorden Bay were close to their maximum extent in the early 20th century.
Thus, the retreat of the small and relatively low-lying glaciers observed in the study area of the Svalbard archipelago over the past century—which has significantly accelerated in the last decade—may be unprecedented over approximately the last 4000 years, leading to the new, modern glacial minimum.
4. Conclusions
The main result from our monitoring is that the mass balance of the Aldegondabreen has become extremely negative—more than at any time since at least the 1910s. Because we used three independent methods—geodetic, glaciological and geophysical—we are confident that this is not due to any measurement error.
The changes in the glacier’s mass balance are linked not only to the local air temperature (measured at the Barentsburg weather station, about 10 km from the glacier), but also to the mean annual surface temperature anomalies occurring across the Northern Hemisphere. This illustrates that global climate change, strengthened by polar amplification, is the main cause of the glacier’s unprecedentedly negative mass balance.
The record-breaking warm season of 2024, which was extreme both for Svalbard and likely also the globe, had an immediate impact on the glacier. It caused a mass loss of −2.48 m w.e.—much higher than the long-term average of −0.64 m w.e. for the centennial 1910–2008 period.
The current level of mass loss appears to be unmatched since the end of the Little Ice Age and, according to paleoclimate data, possibly over the last 4000 years. By early 2025, the glacier’s remaining ice volume has been estimated at around 33 m w.e., which is comparable to the total amount of ice lost since the onset of glaciological mass-balance monitoring (in 2002/03). While the glacier’s area and volume have been shrinking since at least the 1910s, it is the rate of this shrinkage that now stands out as exceptional. Moreover, the glacier has not been climatically viable under any air temperature conditions recorded since the end of the Little Ice Age.
Acknowledgements
This work was carried out within the framework of the NITR program of Roshydromet 5.1 for 2025–29, ‘Development of models and methods for monitoring and forecasting the state of the atmosphere, ocean, sea ice cover, glaciers and permafrost, as well as the study of ice interaction processes with natural objects and engineering structures for the Arctic’.
Author contributions
A.V.T. designed the study. V.E.D. measured the annual mass balance and homogenized the observational series. U.V.P. analyzed the relationship between mass balance and climate. D.A.S. compiled and interpreted the Holocene history of glacier change. I.I.V. analyzed winter precipitation and snow cover parameters. S.R.V. supervised the research. The original draft was written by A.V.T., and all authors contributed to the final version of the manuscript.
Competing interests
The authors declare that they have no conflicts of interest.

 Open access