


1. General introduction
Metaphors, along with other forms of figuration, are widely used in advertising. This practice extends beyond the linguistic component of advertisements, and often also includes visual elements. It is not surprising, then, that figurativeness in advertising, in both linguistic and visual modes, has attracted the attention of scholars in a variety of research fields. Numerous theoretically oriented studies, ranging from classic works in visual rhetoric such as Barthes (Reference Barthes1964), to more recent ones in cognitive linguistics, semiotics and other scholarly traditions, have been devoted to this topic (Bolognesi & Wermmann Horvat, Reference Bolognesi and Wermmann Horvat2022; Forceville, Reference Forceville1996; McQuarrie & Mick, Reference McQuarrie and Mick1996; Pérez Sobrino, Reference Pérez Sobrino2017; Pérez Sobrino et al., Reference Pérez Sobrino, Littlemore and Ford2021).
Different types of visual and visuo-linguistic metaphors have been identified and described in the literature (Forceville, Reference Forceville1996, Reference Forceville, McQuarrie and Phillips2008; Forceville & Urios-Aparisi, Reference Forceville and Urios-Aparisi2009; Phillips & McQuarrie, Reference Phillips and McQuarrie2004). In advertisements, purely visual metaphors are rare, and visual and linguistic elements often interact to construct visuo-linguistic metaphors, in which one metaphorical term is conveyed visually (typically the target, i.e., the advertised product) and the other term is conveyed linguistically. For example, an advertisement of liquorice candies described by Forceville (Reference Forceville1996, pp. 148–149) features an image of the black candies and the slogan ‘Black gold’: the visually represented liquorice is metaphorically described as a valuable good by the linguistic expression black gold. In some studies, the focus is extended from metaphors to other figures of speech. For example, Pérez Sobrino (Reference Pérez Sobrino2017) analysed not only linguistic and visual metaphors but also linguistic and visual metonymies and the interaction between these two figures in advertising. Huhmann (Reference Huhmann, Ihlen and Heath2018), building on previous work by McQuarrie and Mick (Reference McQuarrie and Mick1996), proposes a typology of figures used in advertising that extends classical rhetoric’s taxonomies to visuals. For example, ‘a model’s exaggerated long legs to overstate Bianco heels’ height-enhancing ability’ (p. 233) is classified as a hyperbole; ‘socks shown among cacti with an inset of fabric softener implies that these socks are not prickly’ (p. 236) as irony; and ‘Viagra commercial show[ing] couple dancing rather than the medication’s effects’ (p. 234) as euphemism (for further discussion, see Huhmann & Albinsson, Reference Huhmann and Albinsson2019, which reviews and discusses different taxonomies of visual rhetorical figures).
This predominantly theoretical line of research is complemented by a more applied approach. Given that the primary purpose of commercial advertisements is to sell the advertised product, the use of metaphors and other figures is also of interest to marketing scholars. In this field, the focus is not so much on how metaphors are used in advertising but on the effect they have on the recipients, that is, whether metaphors are persuasive and can thus be used as an effective tool to increase sales. Therefore, research in marketing and psychology experimentally investigates the impact of the use of linguistic and visual figuration on consumers’ attitudes and behaviour (cf. Dehay & Landwehr, Reference Dehay and Landwehr2019, for a review). The degree of effectiveness is typically measured through experiments in which participants are exposed to carefully selected and/or manipulated advertisements and subsequently answer questions such as Do you like this advertisement? Do you think you would buy the advertised product? Do you think the advertised product is a good product? Footnote 1. Based on experiments of this kind, it has been demonstrated that, overall, the use of metaphors in advertisements enhances their persuasiveness (see the meta-analyses by Sopory & Dillard, Reference Sopory and Dillard2002; and Van Stee, Reference Van Stee2018).
Another advertising strategy, of a different nature, also appears to be effective: appealing to consumers’ sensory perception. Research in sensory and multisensory marketing indicates that directly engaging the senses has a positive impact on sales (Hultén et al., Reference Hultén, Broweus and Dijk2009; Krishna, Reference Krishna2013; Pandey & Tripathi, Reference Pandey and Tripathi2025; von Wallpach & Kreuzer, Reference von Wallpach and Kreuzer2013; Wörfel et al., Reference Wörfel, Frentz and Tautu2022). This is why, for instance, many brands rely on jingles to advertise their products and stores often have background music and scents, and carefully designed lighting. Indirectly evoking the senses through language is also common, with slogans that emphasise the specific sensory qualities of products or their sensoriality more generally. For instance, Sony advertises the controller for its PlayStation with the slogan ‘Heighten your senses’ (for further examples of similar sensory slogans, see Howes & Classen, Reference Howes and Classen2014, p. 125).
In certain cases, multiple senses are evoked simultaneously, often resulting in slogans that feature synaesthetic metaphors, that is, metaphors that combine linguistic expressions that refer to different sensory modalities (e.g., Strik-Lievers, Reference Strik-Lievers2017; Winter, Reference Winter2019a). For example, the Skittles candies brand invites consumers to ‘Taste the rainbow’, evoking both the flavour (taste) and the candy’s characteristic colourfulness (rainbow). In print advertisements, synaesthetic effects can be achieved not only through linguistic synaesthesia but also by combining sensory-evoking visual and linguistic elements (Bolognesi & Strik-Lievers, Reference Bolognesi and Strik-Lievers2020). For example, the visual representation of a brightly coloured rainbow enhances the focus on the visual properties of rainbows in the slogan ‘Taste the rainbow’. Given that synaesthesia involves both metaphor (whether linguistic or visual) and the senses, it serves as an ideal test case for exploring the effects that metaphors and sensory cues actually have on consumers’ responses to advertisements.
The aim of the present paper is to build upon previous research on the effects of metaphors, images and sensory engagement in advertising (Section 2) and on the theoretical literature on synaesthetic print advertising (Section 3) to empirically explore their communicative effectiveness. Such effectiveness is operationalised in two studies (Sections 4 and 5), in which we investigate how human ratings of appreciation and purchase intentions of the advertised products relate to different metaphorical constructions.
2. Metaphors, images and the senses in advertising
2.1. Effects of metaphors and images
Metaphors have been shown to increase the persuasiveness of messages across various domains, such as politics, health, science and advertising (see the meta-analyses by Sopory & Dillard, Reference Sopory and Dillard2002, for studies from 1983 to 2000; and Van Stee, Reference Van Stee2018, for studies from 2001 to 2015). Another line of research focused on (metaphorical and non-metaphorical) visuals, suggesting that images can also be persuasive, and are often more persuasive than (metaphorical and non-metaphorical) linguistic argumentation (Jeong, Reference Jeong2008; Messaris, Reference Messaris1997; Scott, Reference Scott1994).
In the context of advertising, several experimental studies have investigated consumers’ responses to the presence of metaphors, to ascertain whether metaphors enhance the effectiveness of advertisements. Effectiveness is typically assessed by asking participants to rate advertisements for aspects such as perceived complexity, appreciation and purchase intentions as well as by evaluating participants’ performance in tasks measuring recall and understanding, among other measures. Overall, metaphorical advertisements tend to be more effective than non-metaphorical advertisements (see reviews by Dehay & Landwehr, Reference Dehay and Landwehr2019; Septianto et al., Reference Septianto, Pontes and Tjiptono2022; for a cognitive linguistics perspective, see Hidalgo-Downing & Kraljevic-Mujic, Reference Hidalgo-Downing, Kraljevic-Mujic, Semino and Demjén2016; Pérez Sobrino, Reference Pérez Sobrino2017; Pérez Sobrino et al., Reference Pérez Sobrino, Littlemore and Ford2021); furthermore, the incorporation of visual elements enhances effectiveness. Visual metaphors have been shown to be more persuasive not only compared to non-metaphorical images (Burgers et al., Reference Burgers, Eden, De Jong and Buningh2016; García-Madariaga et al., Reference García-Madariaga, Moya, Recuero and Blasco2020) but also compared to linguistic metaphors (McQuarrie & Phillips, Reference McQuarrie and Phillips2005) and non-metaphorical language (Mitchell & Olson, Reference Mitchell and Olson1981).
It is important to acknowledge that, despite the overall effectiveness of both linguistic and visual metaphors, consumer responses vary based on a number of factors. In addition to variables such as consumer’s age (Pawlowski et al., Reference Pawlowski, Badzinski and Mitchell1998), level of education (Lagerwerf & Meijers, Reference Lagerwerf and Meijers2008), need for cognition (Chang & Yen, Reference Chang and Yen2013) and individual propensity to metaphor (Bok & Yeo, Reference Bok and Yeo2019; Kim & Park, Reference Kim and Park2019), the characteristics of metaphorical advertisements also seem to play a role. Phillips (Reference Phillips2000) investigated the impact of linguistic cues in advertisements with visual metaphors and demonstrated that such cues improve consumers’ comprehension but, at the same time, diminish appreciation. However, if the visual metaphor is extremely complex, linguistic cues facilitate consumers’ interpretation (Khan et al., Reference Khan, Turner and Butt2024), consequently leading to an increase in appreciation (Ryoo et al., Reference Ryoo, Jeon and Sung2021). Other studies have focused on different types of figurative language and images in advertising, including hyperbole (Stern & Callister, Reference Stern and Callister2020), personification (Delbaere et al., Reference Delbaere, McQuarrie and Phillips2011) and irony (Burgers et al., Reference Burgers, Konijn, Steen and Iepsma2015), showing that their effects may differ from those of metaphors. Conventional metaphors, for instance, are associated with increased consumer appreciation of advertisements and persuasiveness, whereas conventional irony is negatively evaluated and does not affect persuasiveness (Burgers et al., Reference Burgers, Konijn, Steen and Iepsma2015).
Besides assessing the effectiveness of metaphorical advertising, it is also crucial to understand why it is effective (Jeong, Reference Jeong2008; Sopory & Dillard, Reference Sopory and Dillard2002). In this regard, the existing literature has primarily focused on cognitive and affective factors. One consequence of metaphorical argumentation, both linguistic and visual, is that, by being implicit to some extent, an increase in the level of cognitive elaboration is required to interpret the message. Once the metaphorical ‘riddle’ is solved, the recipient experiences a so-called ‘aha moment’, which, in turn, triggers positive affect and therefore brand recognition, recall, and purchase intentions (Topolinski & Reber, Reference Topolinski and Reber2010; e.g., Gkiouzepas & Hogg, Reference Gkiouzepas and Hogg2011; Mohanty & Ratneshwar, Reference Mohanty and Ratneshwar2015; Septianto et al., Reference Septianto, Pontes and Tjiptono2022; see García-Madariaga et al., Reference García-Madariaga, Moya, Recuero and Blasco2020, for neurophysiological evidence). Nevertheless, an increase in metaphorical complexity does not necessarily correspond to an increase in positive affect. Indeed, an inverted U-shaped relationship between metaphor complexity and appreciation has been demonstrated (Van Mulken et al., Reference Van Mulken, Le Pair and Forceville2010). In other words, metaphors must strike a balance between being sufficiently challenging to engage cognitive abilities and not being overly complex, to avoid frustrating consumers.
Riddle solving is, of course, particularly relevant when it comes to novel and highly creative metaphors. Conventional and less creative metaphors, however, are also effective. In this case, Steen (Reference Steen2011) suggests that positive effects are mainly attributable to the power of metaphors to make abstract concepts (in advertisements, the product’s qualities) more concrete, thereby enhancing their accessibility. This may be a more effective approach than explicitly declaring the product’s qualities in a non-metaphorical message (for experimental evidence, see Burgers et al., Reference Burgers, Konijn, Steen and Iepsma2015).
2.2. Effects of sensory engagement
Interestingly, the communicative effectiveness of employing metaphors and that of engaging the senses can be at least in part explained in a similar way. In particular, affective factors seem to play a crucial role in both cases. As with metaphors, the senses, whether directly involved or evoked in advertisements through language and images, tap into our emotions, thus making products more memorable and consumers more likely to buy them. Indeed, research in marketing has documented the effectiveness of a variety of sensory strategies. For example, in the context of food, ambient food-related aromas have been shown not only to enhance appetite but also to influence the actual food choices of consumers (see references in Spence, Reference Spence, Martineau and Racine2020, p. 21). Sensory stimulation is also effective when it pertains to a different sense than the one it is supposed to influence, based on the cross-modal correspondences that characterise human perception (Calvert et al., Reference Calvert, Spence and Stein2004). For example, carefully selected music can enhance or modify the gustatory experience of the food it accompanies (a phenomenon known as ‘sonic seasoning’; Spence, Reference Spence, Minsky and Fahey2017; Spence et al., Reference Spence, Wang, Reinoso-Carvalho and Keller2021); cross-modal correspondences between fragrances and sounds may be exploited for scent marketing purposes (Spence et al., Reference Spence, Di Stefano, Reinoso-Carvalho and Velasco2024); and visual cues such as colour and shape can influence food perception and purchasing choices (see Motoki et al., Reference Motoki, Spence and Velasco2023, for a systematic review, which also discusses mixed, limited, and null evidence in this regard).
These strategies fall under the line of research known as ‘sensory marketing’, which is sometimes also referred to as ‘multisensory marketing’, or ‘synaesthetic marketing’, when multiple senses are involved. Aradhna Krishna, a prominent scholar in this field (see the bibliometric analysis by Wörfel et al., Reference Wörfel, Frentz and Tautu2022), defines sensory marketing as ‘marketing that engages the consumers’ senses and affects their perception, judgment and behavior.’ From a managerial perspective, sensory marketing can be used to create subconscious triggers that characterise consumers’ perceptions of abstract notions of the product, e.g., its sophistication or quality (Krishna, Reference Krishna2012, p. 332). This definition highlights two important points. Firstly, the effect of sensory involvement occurs at a subconscious level. This reminds us of the role of implicitness in determining the effectiveness of metaphorical argumentation, i.e., implicit messages often manage to reach their recipients by passing under the radar of conscious cognitive examination. Incidentally, this raises a number of ethical issues, which are currently being discussed. According to Spence (Reference Spence, Martineau and Racine2020), for instance, sensory marketing tends to push consumers towards less healthy food behaviours, and ethical guidelines are therefore needed. The second relevant point raised by Krishna’s definition is that sensory marketing strategies allow consumers to access the abstract notions of the product. This, again, reminds us of the workings of metaphors, which, in their conventional instances, often facilitate access to abstract concepts and, in the field of advertising, to the qualities of products.
Sensory and multisensory marketing can be implemented by directly engaging the senses (e.g., by spreading a fragrance that may induce customers to buy more food or specific kinds of food), but it can also be realised through language and images. This is the case of linguistic and visual synaesthesia, which is often used to indirectly evoke the senses in advertising.
3. Synaesthetic (visual) metaphors in advertising
As mentioned in Section 1, synaesthesia is a figure of speech that combines linguistic expressions that refer to different sensory modalities (e.g., in sweet music, a hearing noun is qualified by a taste adjective) and is typically considered to be a type of metaphor (Strik-Lievers, Reference Strik-Lievers2017; for a different theoretical perspective, see Winter, Reference Winter, Speed, O’Meara, Roque and Majid2019b; and the annotated bibliography by Strik-Lievers, Reference Strik-Lievers and Aronoff2023). In advertising, especially for products that are typically sold for their sensory qualities such as food, drinks and perfumes, synaesthetic metaphors are frequently employed in slogans. Howes and Classen (Reference Howes and Classen2014, pp. 143, 174) provide several examples, including The loudest taste on Earth for Doritos chips, You’ve never seen a taste like this before for Crystal Pepsi and Listen and you’ll see for B&W loudspeakers.
To the best of our knowledge, there are only a few studies specifically assessing the effectiveness of linguistic synaesthetic metaphors in advertising. Nevertheless, some initial evidence can be found in the marketing literature. Nelson and Hitchon (Reference Nelson and Hitchon1999) tested 112 English-speaking students on their responses to novel (as opposed to conventional) synaesthetic slogans for different products. The results show that synaesthetic metaphorical slogans are overall more appreciated than non-metaphorical slogans, with the effect being stronger when the use of the advertised product does not actually involve both senses evoked in the slogan. For example, a synaesthetic slogan like bright sounds was appreciated more when used to advertise a radio station (sound-related) than a television (TV) station (both sound- and sight-related).
As anticipated in Section 1, Bolognesi and Strik-Lievers (Reference Bolognesi and Strik-Lievers2020) suggested that, in print advertising, synaesthetic metaphors are sometimes constructed not only through language but also through images or a combination of the two. In their analysis of a sample of print advertisements, Bolognesi and Strik-Lievers identified three main types of synaesthetic print advertisements:
-
(i) Linguistically conveyed synaesthesia: The slogan contains a synaesthetic metaphor, but the image does not contribute to the construction of this synaesthesia, e.g., potato chips advertised with the synaesthetic slogan Like sweet banjo music to your tongue and the image of a bag of chips.
-
(ii) Visually and linguistically conveyed synaesthesia: Both the slogan and the image contribute to the construction of the synaesthesia, e.g., Toblerone chocolate bar advertised with the synaesthetic slogan Music to your mouth, and the image of the triangle musical instrument, which also points to the domain of sound evoked by the slogan.
-
(iii) Visually conveyed synaesthesia: Only the image is synaesthetic, e.g., an ice-cream is advertised with an image in which the ice-cream ingredients are aligned to a violin’s constituent parts, possibly evoking an association between the ice-cream’s taste and the violin’s sound.
Considering what we know from cognitive linguistics and marketing research about the effectiveness of metaphors, images and multisensory evocation in advertising, the present study examines the impact of different combinations of these three factors on consumer appreciation and purchase intentions. It does so by analysing responses to the three different types of synaesthetic print advertisements as opposed to non-metaphorical advertisements. Our research questions and hypotheses are as follows:
RQ1: How do visual, linguistic and visuo-linguistic synaesthetic metaphors in advertisements affect appreciation and purchase intentions, compared to non-metaphorical ads?
RQ2: How does the multimodality of advertisements affect appreciation and purchase intentions?
H1: Visuo-linguistic metaphors, presenting metaphorical constructions in both visual and linguistic modes, provide a double channel for metaphor construction and will thus be the most appreciated condition, followed by visual metaphors only, linguistic metaphors only, and non-metaphorical adverts. Even though our study is exploratory with regard to purchase intentions, we predict a similar trend as for appreciation: i.e., visuo-linguistic metaphors will be rated as highest in purchase intentions, followed by visual metaphors only, linguistic metaphors only and non-metaphorical adverts.
H2: Multimodality, irrespective of experimental condition, will lead to higher appreciation and purchase intentions. That is, the more sensory modalities are evoked by the advertisement, the greater the appreciation and purchase intentions will be.
4. Study 1
4.1. Method
All materials, stimuli, instructions to participants and the code used for the analyses are stored in the online repository Open Science Framework (OSF) at https://osf.io/efzr5.
This study was reviewed and approved by the Faculty of Science and Technology Research Ethics Committee at Lancaster University (LU). For further information about how LU processes personal data for research purposes and data rights, visit www.lancaster.ac.uk/research/data-protection.
4.1.1. Materials
Eight advertisements were selected from the platform Ads of the World, which, according to Bolognesi and Strik-Lievers (Reference Bolognesi and Strik-Lievers2020), present a synaesthetic metaphor constructed in either the visual mode (advert’s picture) or linguistic mode (accompanying slogan). The procedure to select these ads was as follows: ads for products that clearly related to a specific sensory modality X were first selected, taking into account all the visual and linguistic sensory information present in the ad. Then, visual and linguistic properties used to advertise the product that pointed to a different sensory modality Y were searched. If such properties were found, the ad was considered a good candidate for classification as a synaesthetic metaphor. Out of eight ads, seven contained a visual synaesthetic metaphor accompanied by a non-metaphorical slogan, while one ad contained both visual and linguistic synaesthetic metaphors, in both picture and slogan. These ads were then manipulated using a photo editor software (Photoshop) to obtain three additional versions of the same advert: one in which both picture and slogan contained a synaesthetic metaphor, one in which only the picture contained a synaesthetic metaphor, accompanied by a non-metaphorical slogan, one in which only the slogan contained a synaesthetic metaphor, accompanied by a non-metaphorical picture, and one in which both picture and slogan were non-metaphorical. These four conditions are exemplified in Figure 1. We ended up with 32 adverts in total.

Figure 1. Example of the four experimental conditions generated on the basis of an original advertisement: (a) visual synaesthetic metaphor and linguistic synaesthetic metaphor; (b) no visual synaesthetic metaphor and linguistic synaesthetic metaphor; (c) visual synaesthetic metaphor and no linguistic synaesthetic metaphor; (d) no visual and no linguistic synaesthetic metaphor.
An online survey was set up on Qualtrics and comprised 11 questions aimed at measuring the two variables of interest, namely appreciation and purchase intentions, and two control variables, namely realism and complexity (see Figure 2 for a screenshot). Realism and complexity were included as control variables in this study to account for potential confounding factors that could influence participants’ responses to the advertisements, independently of their metaphorical content. Perceived realism varies across different types of visual metaphors (Gkiouzepas & Hogg, Reference Gkiouzepas and Hogg2011) and can affect how credible or believable an advertisement appears, which, in turn, may impact both appreciation and purchase intentions (Kim et al., Reference Kim, Choi and Wakslak2019). Similarly, perceived complexity can influence cognitive processing and aesthetic judgement (e.g., Friedenberg & Liby, Reference Friedenberg and Liby2016), with overly complex stimuli potentially leading to confusion or reduced engagement (Van Mulken et al., Reference Van Mulken, Le Pair and Forceville2010). By measuring and controlling for these dimensions, we aimed to isolate the specific contribution of metaphorical and multisensory content to the outcomes of interest. All questions consisted of 5-point Likert scales ranging from −2 to +2. Appreciation, i.e., the extent to which an advertisement is liked or perceived as pleasant/appealing, was measured using one unipolar question ‘I like this advertisement’ (−2 = disagree, 2 = agree) and three bipolar scales based on the common question ‘What is your opinion about this advertisement?’, ranging from bad/unpleasant/unappealing (−2) to good/pleasant/appealing (2); these scales were derived from Margariti et al. (Reference Margariti, Boutsouki, Hatzithomas and Zotos2019). Purchase intentions, also called persuasion, consists in the self-reported likelihood of purchasing a product; it was measured using three statements based on Maheswaran and Meyers-Levy (Reference Maheswaran and Meyers-Levy1990) and Chang and Yen (Reference Chang and Yen2013): ‘I’d like to buy the advertised product soon’, ‘I’d like to buy the advertised product in the future’, and ‘This advertisement made me more likely to purchase this product’ (−2 = strongly disagree and 2 = strongly agree). Realism, i.e., the extent to which the advert was perceived as a real advert, was measured using two bipolar scales based on the common statement ‘I find this advertisement’, ranging from realistic/real (−2) to unrealistic/fictitious (2); these scales were adapted from McQuarrie and Mick (Reference McQuarrie and Mick1996, Reference McQuarrie and Mick1999) and Gkiouzepas and Hogg (Reference Gkiouzepas and Hogg2011). Finally, complexity was measured using two bipolar scales based on the common statement ‘In terms of complexity, I found this ad’, ranging from straightforward/easy to understand (−2) to unclear/difficult to understand (2); these scales were based on Van Mulken et al. (Reference Van Mulken, Le Pair and Forceville2010). To avoid repetition of the same advert in different versions (or experimental conditions), four different surveys were created with eight adverts each; each advert was presented only once in one condition, and the total number of adverts per condition was two.

Figure 2. Excerpt of survey, showing how appreciation was operationalised to elicit participants’ ratings. For a screenshot of the full questionnaire used, refer to the materials available at the OSF link.
A separate online survey was set up to investigate the extent to which the advertisements used were perceived to be associated with the five basic sensory modalities. To this end, we collected ratings for each of the five senses for all 32 experimental stimuli. We adapted the instructions by Lynott and Connell (Reference Lynott and Connell2009), who collected ratings in response to single words. We asked: ‘To what extent does this ad contain information related to the sense of: Touch/Smell/Taste/Hearing/Vision?’ Each of the five scales ranged from 0 (not at all) to 4 (very much).
4.1.2. Participants
A total of 43 participants took part in the appreciation and purchase intentions survey (37 women, 6 men, mean age = 21.9 years, standard deviation (SD) = 3.8; range: 18–39) and were paid £3.5 for their time. This implies that each of the four lists was rated by 10–12 participants. All participants were native speakers of English. A different group of 20 native speakers of English took part in the sensory survey (16 women, 4 men, mean age = 22.4 years, SD = 5.1; range: 18–39) and was paid £5 for their time. Participants were recruited either through SONA, the online recruitment system used by the Psychology Department at LU, or opportunity sampling, and were mostly students or staff working at LU.
4.1.3. Procedure
Participants who signed up for the appreciation and purchase intentions survey were randomly assigned to one of the four surveys and received a corresponding uniform resource locator (URL). The survey first provided information about the study, the task to be completed and approximate duration; then, participants completed an online consent form, and next, they were presented with eight adverts each, in randomised order. After each advert, the 11 questions described in Materials were presented in the following order: questions about appreciation first, followed by complexity, purchase intentions and realism. This is because appreciation or liking is based on personal intuition, so we wanted to measure it first to avoid influence from previous ratings. Then, we wanted to avoid appreciation and purchase intentions to follow one another, again to avoid the influence of one over the other, given that these are our variables of interest. Therefore, we intermixed them with complexity. Finally, realism was measured last because rating an item as a real versus a fake advert could have influenced the rating of other variables. Each participant was presented with all four experimental conditions in a fully within-participant design. The whole task lasted about 15 minutes. At the end, a short debrief explained the purpose of the study and provided some references to related research.
Participants who signed up for the sensory survey received a unique URL. After the information and consent form, participants were presented with all 32 adverts in randomised order and rated each of them for the five sensory modalities. The task lasted between 20 and 30 minutes and was followed by a short debrief.
4.1.4. Data analysis
A principal component analysis (PCA) was conducted using Statistical Package for the Social Sciences (SPSS) Statistics software to reduce the number of dependent variables (11) and extract four underlying components corresponding to our variables of interest and control variables. A PCA with orthogonal (varimax) rotation was conducted to ensure the components extracted would be independent from one another; extraction was based on a fixed number of four factors, given that our scales were designed to measure appreciation, purchase intentions, complexity and realism.
To test whether each of the four extracted components differs across the four experimental conditions, we ran four separate linear mixed-effects models (LMEMs) predicting each component, using the package lme4 in R (Bates et al., Reference Bates, Mächler, Bolker and Walker2015). In each LMEM, we deviation-coded the fixed factors of Picture (negative = non-metaphorical and positive = metaphorical) and Slogan (negative = non-metaphorical and positive = metaphorical). We included all main effects and interactions between the two factors in the fixed effects structure and employed the maximal random effects structure with participants and items as crossed random factors. The p-values for fixed effects were computed using Satterthwaite’s approximation using the lmerTest package (Kuznetsova et al., Reference Kuznetsova, Brockhoff and Christensen2017). In the case of significant interactions between picture and slogan, these were further unpacked by conducting post hoc comparisons and applying Tukey’s correction for multiple comparisons.
Modality exclusivity was computed by combining the ratings obtained for the five different senses following Lynott and Connell (Reference Lynott and Connell2009). The score obtained ranges from 0 = least exclusive, i.e., most multimodal, to 1 = most exclusive, i.e., most unimodal. To investigate relationships between Modality exclusivity and each of the four components, mixed-effects models with Modality exclusivity as the dependent variable and each of the four components as predictors were conducted, by controlling for random effects of subjects only on the intercept and for random effects of items on both intercept and slope. Also, a model with Picture, Slogan and their interaction as predictors, and Modality exclusivity as dependent variables, was run by only including random effects of items on the intercept.
4.1.5. Reliability analysis
A reliability analysis based on internal consistency, i.e., Cronbach’s alpha, was conducted for both questionnaires: the one on appreciation, purchase intentions, realism and complexity and the one on the sensory scales. This is to verify that participant ratings were consistent for each variable rated and across items. The first data set was split into four subscales for the four underlying constructs, but an overall reliability score was also computed for all 11 variables together. The second data set was split by sensory modality.
4.2. Results
4.2.1. Principal component analysis
The data set contains 11 variables and 342 observations and has therefore a very good variable-to-observation ratio (well above 1:10; e.g., Mundfrom et al., Reference Mundfrom, Shaw and Ke2005). Four independent components were extracted through orthogonal (varimax) rotation, all with eigenvalue > 1, with 86.32% of the total variance explained. The Kaiser–Meyer–Olkin (KMO) measure of sampling adequacy was superb (.86, χ2(55) = 3453.86, p < .001; see Sofroniou & Hutcheson, Reference Sofroniou and Hutcheson1999), showing that factor analysis is appropriate for these data. The table of anti-image correlations showed very high correlations in the diagonal elements (all > .76 when the minimum acceptable should be > .5). The rotation converged in six iterations. Refer to Tables 1 and 2 for the results.
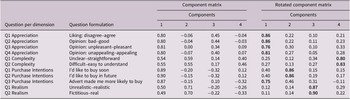
Table 1. Study 1: Components extracted and percentages of variance explained before and after rotation

Table 2. Study 1: Component matrix before rotation (left) and rotated component matrix (right). Factor loadings after rotation > .7 are bolded

Note: Principal component analysis: Varimax rotation with Kaiser normalisation. Rotation converged in six iterations.
The first component extracted explains 34.05% of the variance after rotation; it loads highly not only on all appreciation variables but also on one purchase intention variable. We called this variable ‘Appreciation and purchase intentions’. The second component explained an additional 18.37% of the variance after rotation; this component loads highly only on purchase intentions variables, and we called it ‘Purchase intentions’. The third component extracted explained 17.55% of additional variance after rotation; this component loads highly on the realism variables, and we called it ‘Realism’. The fourth component explained an additional 16.35% of variance; this component loads highly on the complexity variables, and we called it ‘Complexity’.
4.2.2. Manipulation check
To test whether modified adverts (N = 88) were perceived as ‘more fake’ or less realistic than the original adverts (N = 260), we used LMEMs with the fixed effect of Advert (original and modified) and random effect of participants to predict Realism. We found that modified adverts were perceived as significantly more realistic, M = 0.10, confidence interval (CI) = [−0.05, –0.25], than original ones, M = −0.30, CI = [−0.55, −0.04], t(49.18) = −3.09, p = .003.
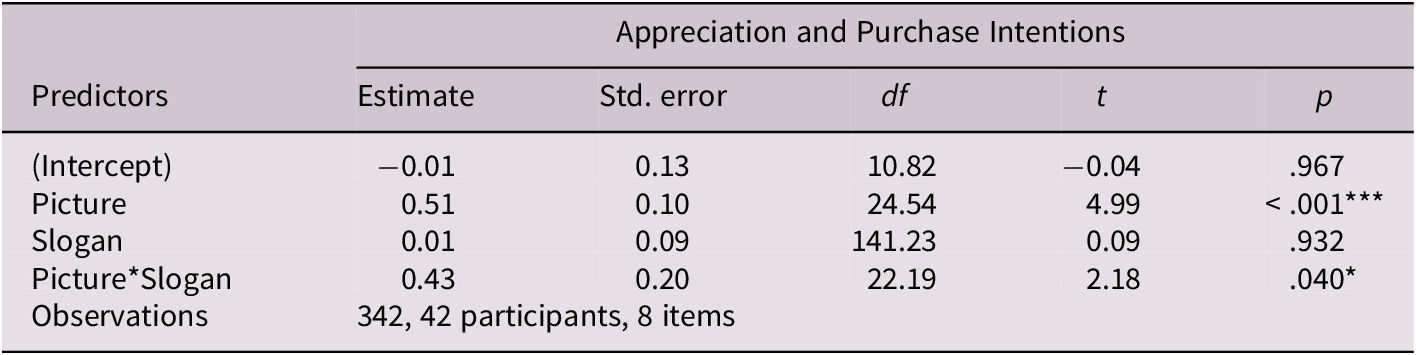
4.2.3. First component: Appreciation and purchase intentions
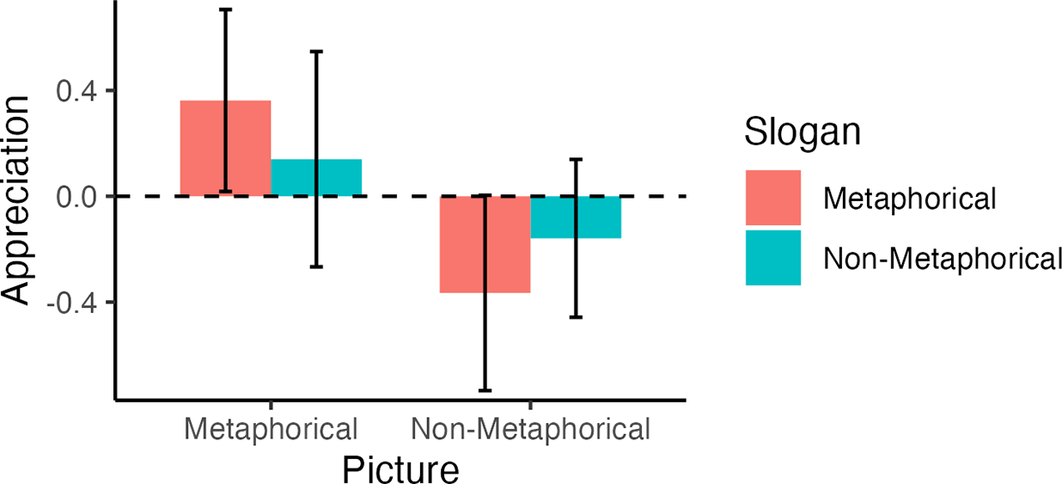
A highly significant effect of Picture showed that metaphorical pictures, M = 0.22, CI = [−0.11, 0.55], are more appreciated than non-metaphorical pictures, M = −0.21, CI = [−0.55, 0.13], independent of the type of slogan. Furthermore, a significant interaction showed that, while for metaphorical pictures the presence of a metaphorical slogan enhances appreciation, for non-metaphorical pictures, the presence of a metaphorical slogan reduces appreciation - significant contrast between metaphorical picture and slogan and non-metaphorical picture with metaphorical slogan, at p = .005; for all contrasts, see supplementary information (SI) at the OSF link. See Table 3 for the model and Figure 3 for the interaction. No significant effect of Slogan was found.
Table 3. Summary of fixed effects in the model of Appreciation and Purchase Intentions (Study 1)

Note: Significant at *p < .05, **p < .01, ***p < .001.

Figure 3. Means and confidence intervals of the interaction between Picture and Slogan for Appreciation and Purchase Intentions (Study 1). M = metaphorical; NM = non-metaphorical.
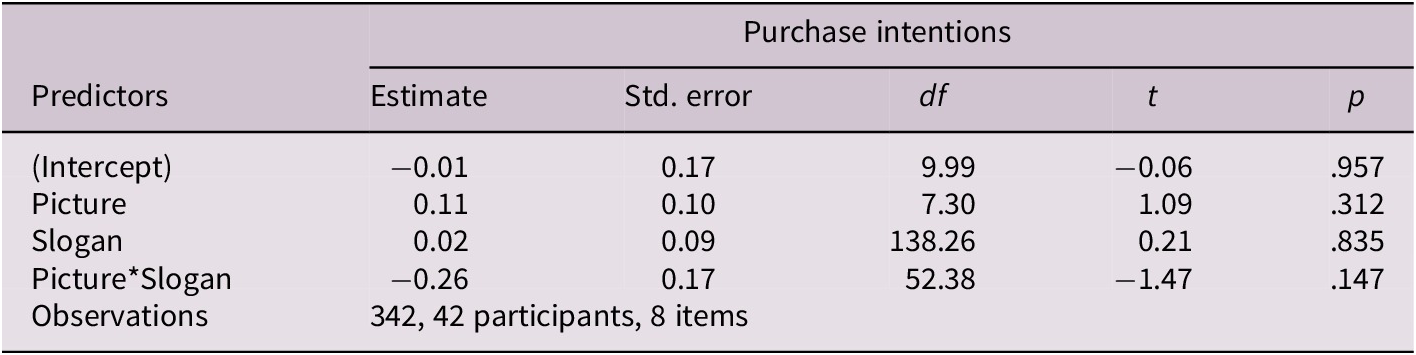
4.2.4. Second component: Purchase intentions
No significant main effects or interactions were found. See Table 4 for the model and refer to the SI for descriptive statistics.
Table 4. Summary of fixed effects in the model of Purchase Intentions (Study 1)

4.2.5. Third component: Realism
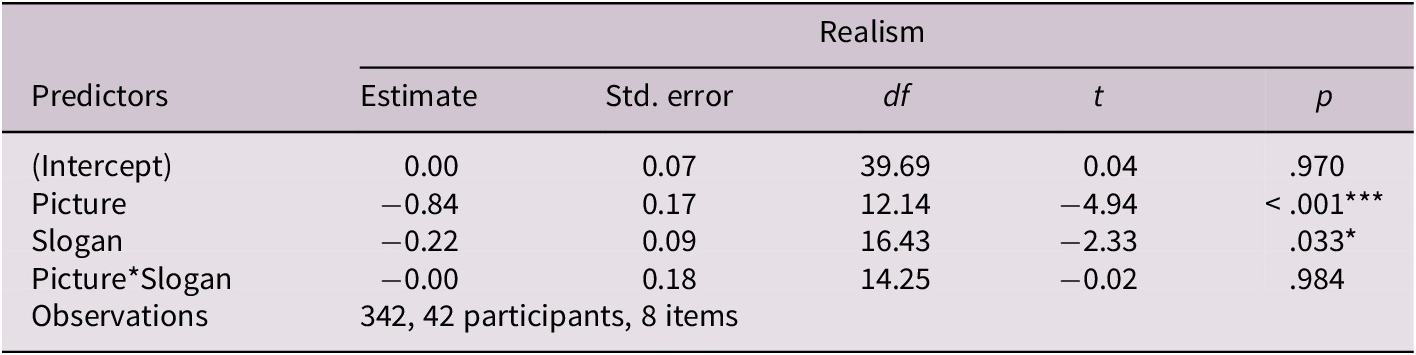
A highly significant effect of Picture showed that non-metaphorical pictures, M = 0.42, CI = [0.20, 0.64], are perceived as more realistic than metaphorical pictures, M = −0.42, CI = [−0.67, −0.16]; furthermore, a significant effect of Slogan showed that non-metaphorical slogans, M = 0.11, CI = [−0.07, 0.29], are perceived as more realistic than metaphorical slogans, M = −0.11, CI = [−0.29, 0.08]. No interaction was found. See Table 5 for the model.
Table 5. Summary of fixed effects in the model of Realism (Study 1)

Note: Significant at *p < .05, **p < .01, ***p < .001.
4.2.6. Fourth component: Complexity
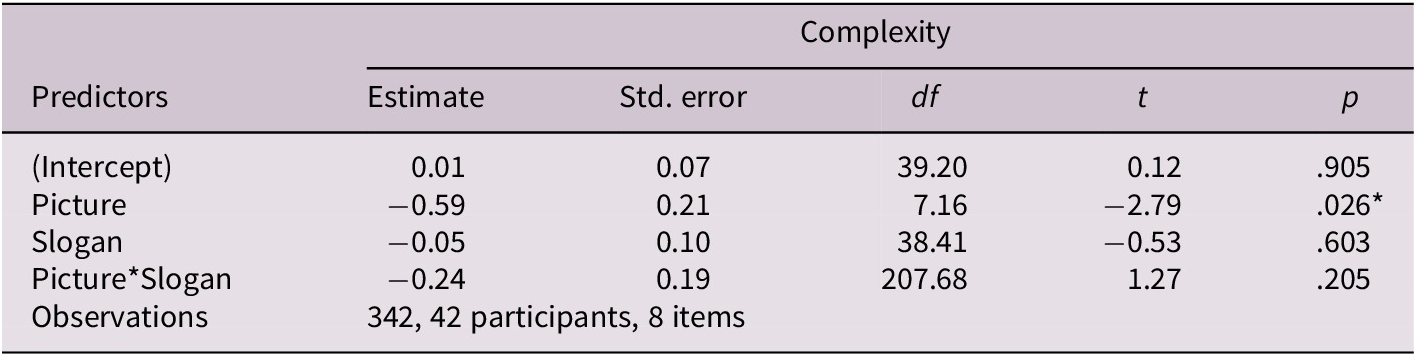
Because the model did not converge, the random effect of the item on the intercept was excluded. A significant effect of Picture showed that metaphorical pictures, M = −0.28, 95% CI = [−0.55, −0.02], were perceived as more complex than non-metaphorical pictures, M = 0.30, 95% CI = [0.03, 0.57]. Note that the signs are counterintuitive because the variable was reversed in the code. No significant main effect of Slogan or interaction between Picture and Slogan was found. See Table 6 for the model.
Table 6. Summary of fixed effects in the model of Complexity (Study 1)

Note: Significant at *p < .05, **p < .01, ***p < .001.
4.2.7. Modality exclusivity
The scores ranged from 0.19 to 0.57 (mean = 0.40 and SD = 0.11), meaning that our adverts are fairly multimodal (1 = most modality exclusive/most unimodal). The first component, Appreciation and purchase intentions, significantly predicted Modality exclusivity, showing a negative coefficient, b = −0.51, standard error (SE) = .14, t = −3.70, p < .001, meaning that the more ads were appreciated, the more multimodal they were rated. The second component, Purchase intentions, did not significantly predict Modality exclusivity, p > .445. Realism significantly predicted Modality exclusivity, showing a positive coefficient, b = 1.08, SE = .29, t = 3.76, p = .016; i.e., the more realistic ads were perceived, the less multimodal they were rated. Finally, Complexity did not significantly predict Modality exclusivity, p > .127.
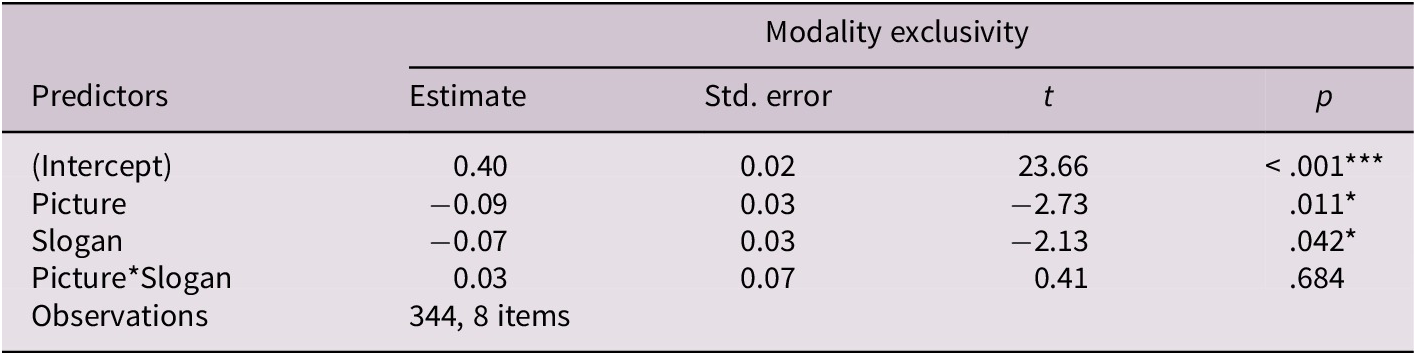
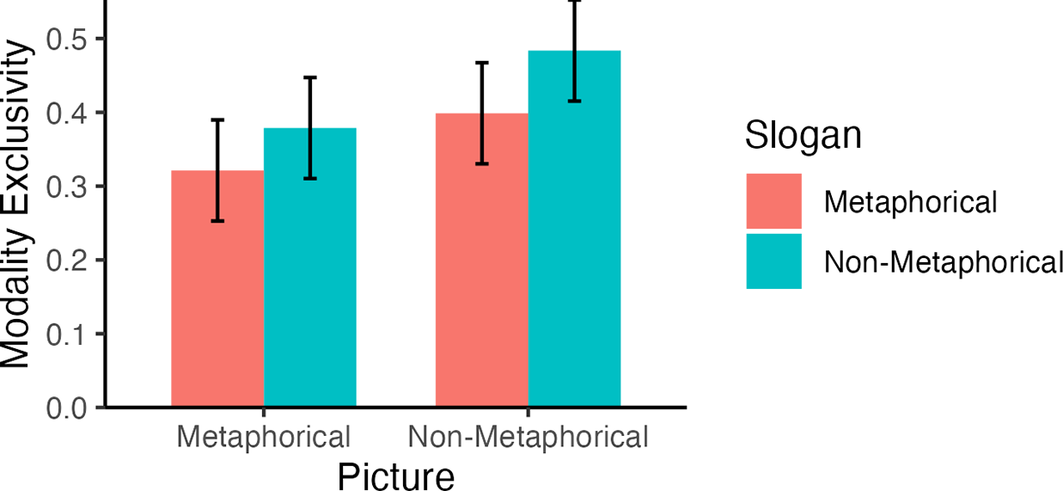
In the model with Picture and Slogan as predictors, we found main effects of both, whereby metaphorical pictures/slogans were more multimodal than their non-metaphorical versions. No significant interaction of Picture by Slogan was found (see Table 7 and Figure 4).
Table 7. Summary of fixed effects in the model of Modality Exclusivity (Study 1 only)

Note: Significant at *p < .05, **p < .01, ***p < .001.

Figure 4. Means and confidence intervals of the main effects of Picture and Slogan for Modality Exclusivity, which range from 0 (least exclusive/most multimodal) to 1(most exclusive/most unimodal), for Study 1 only.
4.2.8. Reliability analysis
The results show high reliability overall (see Table 8). Alpha if each item deleted could not be calculated for subscales that only had two items. The hearing scale had 31 items because one item low in hearing was rated 0 by all participants, hence showing no variability.
Table 8. Measures of internal consistency – Cronbach’s alpha. High consistency is indexed by alpha between .7 and .8. For the questionnaires including appreciation, purchase intentions, realism and complexity, number of items refers to the number of questions asked. For the questionnaire on sensory scales, number of items refers to the total number of adverts rated

4.3. Discussion
Study 1 showed that four underlying constructs explained distinct portions of variance in our data set: ‘Appreciation and purchase intentions’ was the most prominent principal component, followed by purchase intentions, realism and complexity, as it explained the largest portion of variability in the data. Study 1 also showed that metaphorical pictures in ads were more appreciated than non-metaphorical pictures, in line with the higher persuasiveness and effectiveness of visual metaphors than non-metaphorical images (e.g., García-Madariaga et al., Reference García-Madariaga, Moya, Recuero and Blasco2020; Pérez Sobrino et al., Reference Pérez Sobrino, Littlemore and Ford2021). Metaphorical pictures were also perceived as less realistic. The type of slogan per se did not show differences in appreciation. However, in line with our first hypothesis, when a metaphorical slogan accompanied a metaphorical picture, appreciation increased, possibly because this combination facilitated comprehension and, in turn, appreciation (e.g., Phillips, Reference Phillips2000; Ryoo et al., Reference Ryoo, Jeon and Sung2021). In contrast, when a metaphorical slogan accompanied a non-metaphorical picture, appreciation decreased, possibly because the linguistic metaphor on its own, with no matching picture, is harder to make sense of and, in turn, appreciate. Furthermore, Study 1 showed that the ads used were fairly multimodal overall, and that appreciation increased for more multimodal ads, thus supporting our second hypothesis as well as predictions from sensory marketing (e.g., Krishna, Reference Krishna2012); realism increased instead for more unimodal ads. Finally, in line with our ad manipulation, metaphorical pictures and metaphorical slogans were, respectively, more multimodal than their non-metaphorical counterparts.
5. Study 2
A second study was conducted using a very similar version of the first online survey from Study 1, to measure again appreciation, purchase intentions, complexity and realism. Study 2 was motivated by the fact that we aimed to obtain a better measure of purchase intentions and a better distinction between appreciation and purchase intentions when extracting principal components. Furthermore, we aimed to run a larger study with higher statistical power. No second survey on sensory scales was conducted in Study 2. However, we tested the second hypothesis by using the freshly collected ratings as predictors of the modality exclusivity scores obtained in Study 1.
5.1. Method
5.1.1. Materials
In Study 2, the same adverts as in Study 1 were used, and only the appreciation and purchase intentions survey was conducted. This survey was almost identical to the one used in Study 1, except for two key changes. In Study 1, the scales used to measure purchase intentions erroneously contained 7 points instead of 5, so in Study 2 this was modified to be consistent with all other variables measured. Furthermore, the wording of these scales was changed; while in Study 1 the wording referred to the purchase intentions of the participant themselves, in Study 2 the wording referred to other people: ‘How likely would people be to buy this product soon?’, ‘How likely would people be to buy this product in the future?’, ‘This ad will make people more likely to buy this product’. Bipolar scales ranged from unlikely (−2) to likely (2). This change was motivated by the fact that personal factors do influence purchase intentions (Habich-Sobiegalla et al., Reference Habich-Sobiegalla, Kostka and Anzinger2019); thus, referring to others can be a more objective measure. Also, the modified statements may be better distinguished from the appreciation scales; in fact, the first component extracted by the PCA in Study 1 also loaded on one of the purchase intentions scales, in addition to the appreciation scales.
5.1.2. Participants
A total of 110 participants took part in the appreciation and purchase intentions survey (88 women, 20 men, 2 unknown, mean age = 38.1 years, SD = 18.6; range: 18–78), with each of the four lists rated by 27–28 participants on average. All participants were native speakers of English with no history of learning disabilities. Participants voluntarily took part without receiving any monetary compensation. They were recruited through opportunity sampling and included students and non-students, at LU and other parts of the United Kingdom.
5.1.3. Procedure
This study was also reviewed and approved by the Faculty of Science and Technology Research Ethics Committee. The procedure was identical to the one used in Study 1 for the appreciation and purchase intentions survey.
5.1.4. Data analysis
The same analyses described in Study 1 were conducted. However, the sensory scales were rated only in Study 1. Therefore, the analyses with Modality exclusivity include scores obtained in Study 1 but with the new four components obtained through PCA in Study 2.
5.2. Results
5.2.1. Principal component analysis
The data set contains 11 variables and 880 observations and has therefore an excellent variable-to-observation ratio. Four independent components were extracted through orthogonal (varimax) rotation, with the first two components having eigenvalues > 1 and with 88.36% of the total variance explained. The KMO measure of sampling adequacy was superb (.89, χ 2 (55) = 9629.09, p < .001). The table of anti-image correlations showed very high correlations in the diagonal elements (all > .81). The rotation converged in six iterations. Refer to Tables 9 and 10 for the results.
Table 9. Study 2: Components extracted and percentages of variance explained before and after rotation

Table 10. Study 2: Component matrix before rotation (left) and rotated component matrix (right). Factor loadings after rotation > .6 are bolded

Note: Principal component analysis: Varimax rotation with Kaiser normalisation. Rotation converged in six iterations.
The first component extracted explains 31.06% of the variance after rotation and loads highly on all appreciation variables. We called this variable ‘Appreciation’. The second component explained an additional 21.34% of the variance; it loads highly on all purchase intentions variables; however, the loading onto the third variable is lower, .63. We called this variable ‘Purchase intentions’. The third component explained 18.01% of additional variance; it loads highly only on the realism variables, and we called it ‘Realism’. The fourth component explained an additional 17.94% of variance; this component loads highly only on the complexity variables, and we called it ‘Complexity’.
5.2.2. Manipulation check
Similarly to Study 1, we found again that modified adverts were perceived as significantly more realistic, M = 0.14, CI = [0.06, 0.22], than original ones, M = −0.39, CI = [−0.54, −0.24], t(147.78) = −6.53, p < .001.
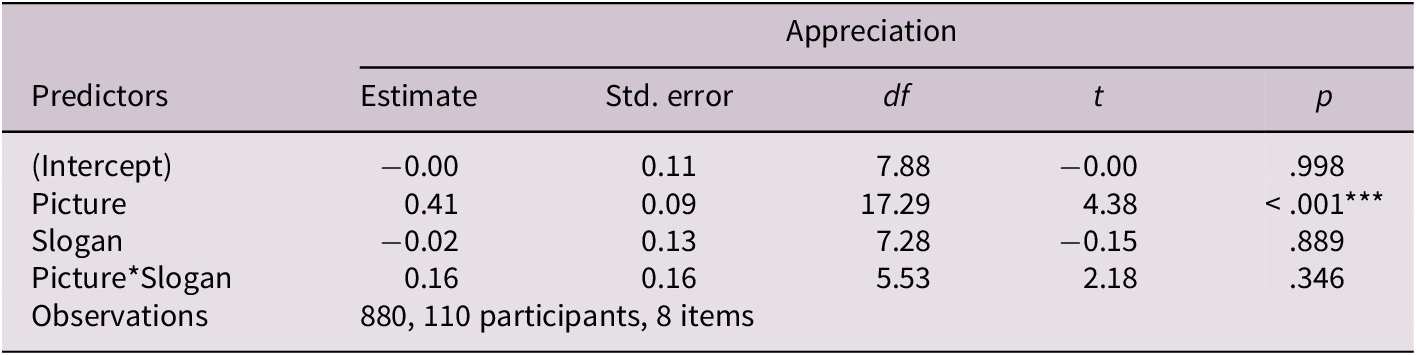
5.2.3. First component: Appreciation
Similarly to Study 1, a highly significant effect of Picture showed that metaphorical pictures, M = 0.20, CI = [−0.12, 0.52], are more appreciated than non-metaphorical pictures, M = −0.20, CI = [−0.43, 0.03], independent of the type of slogan. However, no significant interaction was found, and there was no effect of Slogan (see Table 11).
Table 11. Summary of fixed effects in the model of Appreciation (Study 2)

Note: Significant at *p < .05, **p < .01, ***p < .001.
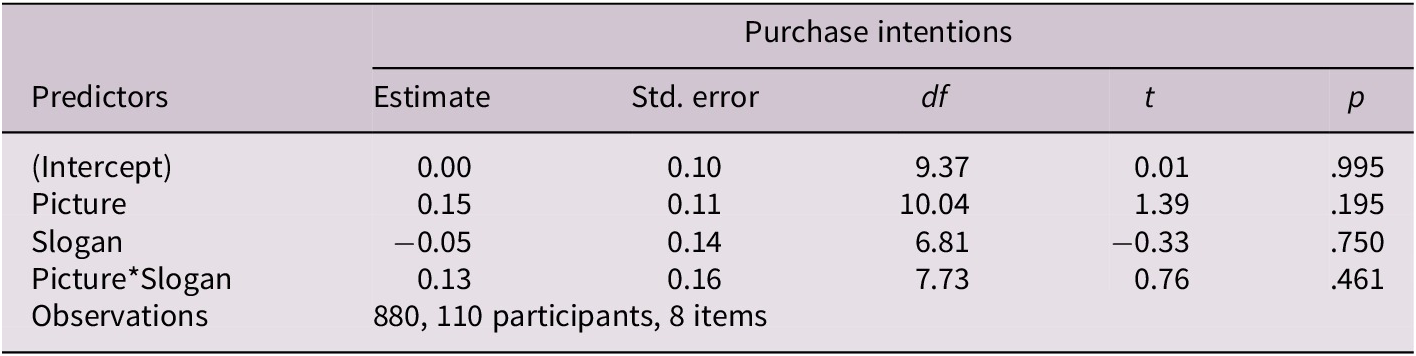
5.2.4. Second component: Purchase intentions
In line with Study 1, no significant main effects or interaction was found. See Table 12 for the model and refer to the SI for descriptive statistics.
Table 12. Summary of fixed effects in the model of Purchase Intentions (Study 2)

Note: Significant at *p < .05, **p < .01, ***p < .001.
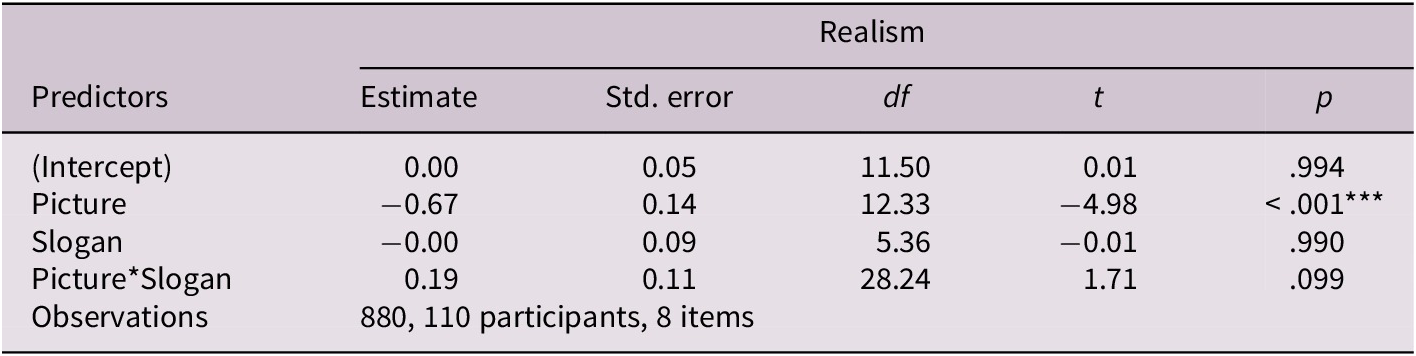
5.2.5. Third component: Realism
In line with Study 1, a highly significant effect of Picture showed that non-metaphorical pictures, M = 0.34, CI = [0.21, 0.46], are perceived as more realistic than metaphorical pictures, M = −0.34, CI = [−0.57, –0.10]. However, no effect of Slogan was found, nor an interaction. See model in Table 13.
Table 13. Summary of fixed effects in the model of Realism (Study 2)

Note: Significant at *p < .05, **p < .01, ***p < .001.
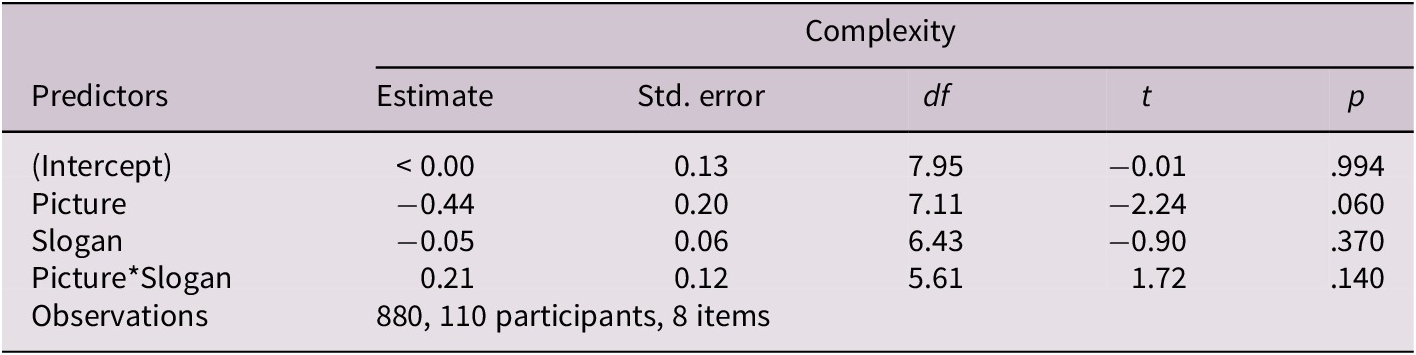
5.2.6. Fourth component: Complexity
Only a marginally significant main effect of Picture was found, showing a similar direction as the significant effect in Study 1, i.e., a trend towards metaphorical pictures, M = −0.22, CI = [−0.56, 0.12], being perceived as more complex than non-metaphorical pictures, M = .22, CI = [−0.12, 0.56]; however, this effect did not reach the statistical significance threshold. Note that the signs are counterintuitive because the variable was reversed in the code. No significant main effect of Slogan or interaction was found. See model in Table 14.
Table 14. Summary of fixed effects in the model of Complexity (Study 2)

Note: Significant at *p < .05, **p < .01, ***p < .001.
5.2.7. Modality exclusivity
In line with Study 1, Appreciation negatively predicted Modality exclusivity, b = −0.50, SE = .16, t = −3.24, p = .019, i.e., the more multimodal the adverts, the more they are appreciated. Purchase intentions did not significantly predict Modality exclusivity, p = .967. Realism positively predicted Modality exclusivity, b = 0.63, SE = .20, t = 3.14, p = .021, i.e., the less multimodal the adverts, the more realistic. Complexity did not significantly predict Modality exclusivity, p = .162.
5.2.8. Reliability analysis
The results show high reliability overall (see Table 8 in Study 1). Alpha if each item deleted could not be calculated for subscales that only had two items.
5.3. Discussion
In Study 2, a larger participant sample was tested, and the wording of the variables used to measure purchase intentions was modified to refer to ‘people’ rather than to the participants themselves using ‘I’ (Study 1). These changes led to better distinction in the PCA between appreciation and purchase intentions, which did not share any items (unlike Study 1, in which one item was shared between the first two components extracted). In fact, unlike in Study 1, the first component extracted in Study 2 was labelled solely ‘appreciation’. Similarly to Study 1, appreciation explained the largest portion of variability in the data, followed by purchase intentions, realism and complexity. Once again, metaphorical pictures in ads were more appreciated than non-metaphorical pictures, confirming visual metaphors’ higher persuasiveness and effectiveness (e.g., García-Madariaga et al., Reference García-Madariaga, Moya, Recuero and Blasco2020; Pérez Sobrino et al., Reference Pérez Sobrino, Littlemore and Ford2021), and were perceived as less realistic; no differences were observed for the type of slogan. However, in Study 2, we did not find any evidence that the presence of metaphorical slogans differentially affected appreciation for metaphorical versus non-metaphorical picturesFootnote 2. Finally, similarly to Study 1, appreciation increased for more multimodal ads, in line with sensory marketing (e.g., Krishna, Reference Krishna2012), further supporting our second hypothesis, while realism increased for more unimodal ads.
6. General discussion and conclusion
This study investigated how different types of synaesthetic metaphors in advertisements (visual, linguistic and visuo-linguistic) affect appreciation and purchase intentions (RQ1) and how the multimodality of advertisements influences these same responses (RQ2).
We hypothesised that visuo-linguistic metaphors will be the most appreciated, followed by visual metaphors, linguistic metaphors, and non-metaphorical ads. We predicted that purchase intentions will follow a similar pattern (H1). Moreover, we predicted that higher multisensoriality, regardless of ad type, will lead to greater appreciation and purchase intentions (H2).
In relation to H1, an assessment of the stimuli’s perceived quality revealed that the modified advertisements, specifically created for the experiment, were not judged as obviously artificial or excessively edited. On the contrary, participants rated the modified ads as more realistic than the original ones. This unexpected difference in perceived realism can likely be attributed to the nature of the content: most original ads featured either a metaphorical image or a combination of metaphorical image and slogan, which may have been perceived as particularly implausible (e.g., a volcano representing chilli sauce). In contrast, the modified ads typically included either fully literal content (both image and slogan), a literal image paired with a metaphorical slogan, or, when a metaphorical image was used, a corresponding metaphorical slogan helped render the overall message more coherent. Regarding complexity, metaphorical pictures were judged to be significantly more complex than non-metaphorical ones. This may be due to the fact that the synaesthetic metaphors used are relatively novel metaphors, with no standard, conventionalised meaning, and the visual metaphors in particular are open to different interpretations, given no language-mediated conceptualisation (e.g., Burgers et al., Reference Burgers, Konijn, Steen and Iepsma2015). No significant effects of slogan type or picture–slogan interaction were observed for complexity.
Overall, we found that the ways in which images and slogans matched up to construct either a non-metaphorical or a visual, linguistic or visuo-linguistic metaphorical message affected how much viewers liked the ads. Specifically, ads with metaphorical pictures paired with metaphorical slogans were the most appreciated, supporting H1. This indicates that visuo-linguistic metaphors, which present metaphors in both visual and linguistic modes, indeed provide a double channel for metaphor construction, leading to higher appreciation. These images were followed in appreciation by those that presented metaphors only in the visual modality, and then those that presented only linguistic metaphors. We interpret the lower appreciation of linguistic metaphors as follows: while a metaphorical slogan can help clarify the meaning of a metaphorical image, thereby enhancing the advertisement’s appreciation in visuo-linguistic ads, a linguistic metaphorical slogan that is paired with a literal image may result in a mismatch that could reduce appreciation due to a perceived lack of coherence.
The expected trend for purchase intentions was not observed; no significant effects were found, suggesting that appreciation does not necessarily translate into higher purchase intentions, as initially hypothesised. The reason for this finding may lie in the fact that, while the appreciation of an advertisement may be driven by the aesthetics of the images and the overall pleasure derived by the resolution of the riddle involved in metaphor interpretation (as argued also by Littlemore, Reference Littlemore2019, in relation to the variable often labelled as ‘need for cognition’), additional factors beyond aesthetic appeal and cognitive engagement influence consumers’ intentions to purchase. In other words, although previous research has often highlighted the persuasive power of metaphors in marketing, particularly in terms of their positive impact on purchase intentions (e.g., see discussions in Hidalgo-Downing & Kraljevic-Mujic, Reference Hidalgo-Downing, Kraljevic-Mujic, Semino and Demjén2016; Pérez Sobrino, Reference Pérez Sobrino2017; Pérez Sobrino et al., Reference Pérez Sobrino, Littlemore and Ford2021; Burgers et al., Reference Burgers, Eden, De Jong and Buningh2016; García-Madariaga et al., Reference García-Madariaga, Moya, Recuero and Blasco2020), our findings concerning synaesthetic metaphors point to a divergence between appreciation and actual purchase intent. This discrepancy provides valuable insights for applied marketing research, emphasising the need to distinguish between cognitive–aesthetic engagement and consumer decision-making processes. Future research could examine whether similar divergences between appreciation and purchase intentions emerge with audiovisual synaesthetic metaphors in TV commercials, where the integration of sound and image may amplify sensory engagement, potentially altering even more deeply the balance between aesthetic appreciation and consumer behaviour.
In relation to our second hypothesis, we examined how the sensory appeal of ads, measured as modality exclusivity (how much the ads engage exclusively one sense as opposed to multiple senses), related to our experimental variables. Results revealed that higher appreciation predicts greater multimodality (i.e., lower exclusivity), in line with our H2, suggesting that ads blending sensory experiences are more favourably received (as suggested in Krishna, Reference Krishna2012; Spence, Reference Spence, Martineau and Racine2020; Spence et al., Reference Spence, Wang, Reinoso-Carvalho and Keller2021; Wörfel et al., Reference Wörfel, Frentz and Tautu2022).
Purchase intentions, however, did not significantly predict modality exclusivity. Additionally, ads perceived as more realistic tended to be less multimodal, indicating a potential trade-off between perceived realism and sensory engagement. Complexity of ads, though showing a trend, did not significantly predict modality exclusivity either. These findings suggest a nuanced impact of sensory integration in advertising effectiveness: on one hand, the use of multisensory elements in advertisements indeed enhances appreciation among viewers, aligning with established literature in multisensory marketing (Krishna, Reference Krishna2012; Spence, Reference Spence, Martineau and Racine2020; Spence et al., Reference Spence, Wang, Reinoso-Carvalho and Keller2021; Wörfel et al., Reference Wörfel, Frentz and Tautu2022); on the other hand, this increased appreciation does not necessarily translate into increased purchase intentions, revealing once again a divergence between these two outcome measures. This discrepancy, as in the previous study, suggests that, while sensory-rich ads are effective in capturing attention and fostering positive aesthetic responses, they may not always succeed in driving consumers’ behaviour towards purchasing the advertised products. Moreover, the observation that more fantastical or less realistic ads are more appreciated raises a critical issue for product-focused advertising: ads that lean heavily on fantasy and creativity might compromise product memorability and consumer recall, potentially diminishing their effectiveness in promoting specific products (e.g., Jin et al., Reference Jin, Kerr, Suh, Kim and Sheehan2022; Till & Baack, Reference Till and Baack2005). This highlights a strategic challenge for advertisers in balancing creativity with the need for consumers to recognise and remember the products being advertised. Therefore, while multisensory approaches effectively enhance initial engagement and aesthetic appeal, their influence on actual consumer behaviour remains uncertain and warrants cautious evaluation in advertising strategy. These findings serve as a reminder also to researchers to not assume a direct link between multisensory stimulation and purchase intentions, even though some previous studies lean towards that direction (e.g., see Li et al., Reference Li, Guo, Wu and Spence2022, for a review).
To conclude, the study’s findings indicate that synaesthetic metaphors, especially when combined with language or presented visually, are highly appreciated by viewers. This aligns with previous research emphasising the appeal of metaphorical and multisensory elements in advertising. However, it raises questions about whether this appreciation primarily reflects pleasurable feelings evoked by the aesthetics of the ad, rather than influencing actual purchase intentions. Our research highlights a notable gap between how ads are appreciated and their potential to drive consumers’ purchasing decisions. There is a concern that such creative elements might distract from the main goal of promoting product sales. This dual impact, namely enhancing aesthetic appeal while potentially diluting commercial effectiveness, points to the nuanced role of metaphorical synaesthetic creativity in advertising and to its implications for marketing strategies moving forward.
Future research should focus on replicating our findings using a broader range of advertisements across various product categories to enhance the generalisability of our results. Exploring individual differences such as age, gender, cognitive styles, personal beliefs and consumer habits could provide deeper insights into how these factors influence both the appreciation of advertisements and their impact on purchase intentions. As a matter of fact, addressing these individual differences explicitly in future studies may contribute to a more comprehensive understanding of how consumers respond to different advertising strategies, and what the role of metaphor in determining these effects is.
Acknowledgements
Francesca Strik Lievers has written the introduction, i.e., sections 1, 2 and 3. Francesca Citron has written method and results for both Studies 1 and 2, i.e., sections 4 and 5. Marianna Bolognesi has written the discussion and conclusions, i.e., section 6. All three authors have conceptualised and designed the studies together, prepared the stimuli and the surveys’ instructions. Francesca Citron and Bo Yao have analysed the data. The authors thank former students Pan Yue, Xiaoying Chen and Emily Davenport for having created different versions of the advertisements, set up the online surveys and collected the data.


 Open access