


Despite years of research and intervention efforts, obesity still remains a major public health problem worldwide(1). Recent statistics from the WHO indicate, on a global scale, that over 890 million adults and 190 million children and adolescents suffered from obesity in 2022(2). Although population groups of all ages are concerned, young adults appear to be particularly vulnerable to excess weight(Reference Dietz3,Reference Lanoye, Brown and LaRose4) . In the transition to adulthood, several changes are likely to take place, such as leaving parental home to become financially independent, finishing school, entering the labour market and sometimes becoming parents. These changes may be accompanied with changes in lifestyle and health-related behaviours(Reference Nelson, Story and Larson5,Reference Winpenny, van Sluijs and White6) . Some studies have shown that young adults are particularly at risk of having lower quality diets(Reference Lanoye, Brown and LaRose4–Reference Winpenny, van Sluijs and White6). Because diet is one important modifiable factor for preventing excess weight, understanding how overall dietary habits relate to weight status in the period of young adulthood is fundamental to implementing relevant public health policies and strategies for healthy eating and healthy weight. So far, however, studies on the longitudinal associations between dietary patterns and body weight in young adults remain scarce(Reference Ushula, Mamun and Darssan7).
During the period spanning from childhood to adulthood, diet also plays a crucial role for the growth and development of individuals(Reference Herman, Taylor Baer and Adams8). Dietary habits that are developing throughout this period may further set the stage for diet quality later in life, which could have a cumulative impact (for better or for worse) on various health outcomes, including weight status(Reference Herman, Taylor Baer and Adams8,Reference Kaikkonen, Mikkilä and Raitakari9) . From a life-course perspective, early preventive interventions aiming to promote healthy eating and healthy weight among young adults would benefit from understanding how food choices in early years contribute to dietary habits later on.
In the last decades, longitudinal studies have been used for investigating stability or changes in dietary intakes at various life stages, namely during childhood(Reference Sørensen, Aamodt and Brantsæter10–Reference Lioret, Betoko and Forhan13), from childhood to adolescence(Reference Ambrosini, Emmett and Northstone14–Reference Northstone, Smith and Newby16) or from adolescence to adulthood(Reference Appannah, Murray and Trapp17–Reference Christoph, Larson and Winkler21). Using various methodologies, most of these studies have generally reported fair to moderate tracking of various dietary outcomes (e.g. nutrients, specific food, overall patterns and diet quality indices) over time. Studies of longitudinal associations from early childhood up to adulthood, however, remain limited(Reference Luque, Escribano and Closa-Monasterolo11,Reference Craigie, Lake and Kelly22) . We are not aware of any large prospective study beginning before age 2 years (all the same age at baseline) and reporting food consumption from early, through middle and late childhood and up to adulthood. A better understanding of the links between food consumed in specific childhood period and diet in young adulthood is crucial for planning comprehensive and timely dietary interventions that may contribute, in the long term, to population health and prevent excess weight problems.
The first objective of the present study was to examine the longitudinal associations between dietary intakes and weight in young adulthood. We hypothesised that healthier dietary habits are associated with a lower BMI and lower probabilities of excess weight over a 1-year period, and that less healthy dietary habits are associated with higher BMI and higher probabilities of excess weight a year later. A second objective was to investigate how food consumption at various stages in childhood relates to dietary intakes in young adulthood. We hypothesised that healthier food choices in childhood are associated with healthier diets in young adulthood, and that less healthy food choices in childhood are associated with less healthy diets in young adulthood.
Methods
Participants
We conducted a secondary analysis of data collected over a period of 23 years, as part of the Québec Longitudinal Study of Child Development (QLSCD)(23). This large birth-cohort study (n 2120) began at the end of the 1990s and included a representative sample of children born in Québec (Canada) in 1998 (excluding multiple births and children with gestational age at birth < 24 or > 42 weeks or suffering from severe illnesses or whose mother could not speak French or English). Designed to investigate multiple environmental and behavioural factors that may influence children cognitive and psychosocial development, the QLSCD had numerous data collection waves from the age of 5 months and then every year or every 2 years up to age 25 years(Reference Orri, Boivin and Chen24).
The study sample included 700 participants (33 % of the original cohort) who took part in a dietary study conducted when participants were aged 22 years (see online Supplementary Figure 1 for a flow chart of participants included in different analyses). In comparison with other QLSCD participants (i.e. those who did not provide dietary data at age 22 years), the study sample had a lower representation of males and of participants born in families with a lower socio-economic status (online Supplementary Table 1).
This study was conducted according to the guidelines laid down in the Declaration of Helsinki, and all procedures involving human subjects were approved by the research ethics committee at the Institut de la Statistique du Québec. The dietary study conducted when QLSCD participants were aged 22 years was also approved by the ethics committee of the University of Ottawa (Ethics File Number: H-12-19-5304). Written informed consent was obtained from all participants.
Weight measures in adulthood
Self-reported height and weight were collected from participants at age 22 years, as part of the dietary study, and a year later, as part of the regular QLSCD data-collection activities, using Web-based questionnaires. At both ages, BMI (kg/m2) was computed. BMI change (Δ) over a 1-year period was calculated by the difference between BMI at age 23 years and BMI at age 22 years. At age 23 years, weight status (underweight, normal weight, overweight and obesity) was determined using WHO classification cut-offs(25).
To account for potential measurement error in self-reported data, a correction was applied to anthropometric data, based on equations derived from comparison between measured and self-reported data in a population-based Canadian survey(Reference Shields, Gorber and Janssen26). The corrected BMI was used in the main analyses. A sensitivity analysis using uncorrected anthropometric data is also presented in the online Supplementary materials (further discussed below in the Results section).
Dietary measures in adulthood
The dietary study conducted at age 22 years included sixty food frequency questions covering major food groups consumed by the Canadian population(27). As part of a Web-based questionnaire, these frequency questions referred to usual intakes at the time of the dietary study and included three choices of portions to assess relative quantities consumed. These frequency questions allowed identifying food patterns of major combinations of foods as consumed in the study sample. Specifically, the sixty food items were first aggregated into sixteen food groups. Patterns were derived by exploratory factor analysis (EFA), using principal axis factoring as extraction method and direct oblimin as rotation method. A solution with four factors was found to best describe latent food patterns in the study sample based on a combination of parallel analysis of scree plot and comparisons of fit indices (i.e. Tucker–Lewis Index, Root Mean Square Error of Approximation and the Bayesian Information Criterion). The cutting value for item loadings on each factor (food pattern; labelled healthy, beverage-rich, protein-rich, high-energy-density) was 0·3. The Tucker–Lewis Index and the root mean square error of approximation of the final model were 0·86 and 0·042, respectively. Details about the dietary study and food patterns derived at age 22 years are available in an earlier publication(Reference Dubois, Bédard and Goulet28).
In the present study, young adults’ diet was operationalised by their score on each of the four food patterns identified(Reference Dubois, Bédard and Goulet28) (i.e. for a given pattern, the score obtained by a participant through exploratory factor analysi). The healthy pattern is characterised by a high consumption of fruit (excluding juice), vegetables, whole-grain products and legumes, nuts and seeds. The beverage-rich pattern refers to a high consumption of sugar-sweetened beverages (SSB) and, to a lesser extent, of unsweetened milk and plant-based drinks. The protein-rich pattern is characterised by a high consumption of animal sources of protein such as red meat, eggs and non-fried poultry, fish and shellfish. Finally, the high-energy-density pattern refers to a high consumption of processed meat (including pizza and fried poultry/fish/shellfish), alcohol, cheese and fatty/salty snacks, including French fries.
Dietary measures in childhood
We examined consumption of various types of food throughout childhood using frequency questions in ten waves of data collection covering three periods, i.e. early (ages 1·5, 2·5, 3·5 and 4·5 years), middle (ages 5, 6 and 7 years) and late (ages 10, 12 and 13 years) childhood. Except at age 13 years where children answered these questions, the parent most knowledgeable about the child (usually the mother) answered the frequency questions as part of an interviewer-administered or a self-completion questionnaire (depending on the data collection wave).
Using the last week as the reference period, the questions asked for frequency of consumption of 14 to 15 food items up to age 12 years, with sugary drinks and sodas added to the list from age 6 years. At age 13 years, the list of items was modified slightly to obtain more details on disaggregated categories of food. Among that list, twenty items corresponded to categories covered in earlier data collection waves (see online Supplementary Table 2 for details on frequency questions by data collection wave). Possible answers included never, once or twice a week, 3 to 4 times a week, 5 to 6 times a week, once a day, twice a day (twice a day or more, before age 6 years), 3 times a day and 4 times a day or more. Middle points were used for coding answers referring to a range of frequency (e.g. 3·5 for 3 to 4 times). Maximum frequencies, corresponding to ‘twice a day or more’ (before age 6 years) and ‘4 times a day or more’ (at other ages), were coded as 2 and 4, respectively. Frequencies per week were converted to frequencies per day by dividing numbers by 7. For a given food item, frequencies per day thus ranged from 0 to 2 for data collection waves before age 6 years and from 0 to 4 thereafter. Each item was assigned to one of eight food groups: ‘milk’; ‘milk products’ (including cheese, yogurt and milk-based desserts); ‘fruit and vegetables’ (including potatoes); ‘juice and SSB’ (this food group exclusively refers to juice and fruit drinks before age 6 years); ‘meat, poultry and fish’; ‘legumes’ (at all ages except 13 years); ‘cereal products’ (including bread, cereals and pasta) and ‘sweets and snack food’ (including pastry, sweets, cookies and potato chips). The frequencies of consumption (per day) of each item included in a food groups were summed. For each childhood period (early, middle and late childhood), an average frequency of consumption per day was calculated for each participant, using all data available during that period.
Covariates
All multivariable analyses considered the sex of the participant and some potentially confounding factors based on previous studies among QLSCD participants(Reference Nelson, Story and Larson5,Reference Dubois, Farmer and Girard29) . In analyses related to the first objective, covariates included the living situation and the level of education of the participants at age 22 years. This information was self-reported in the Web-based questionnaire of the dietary study. In analyses related to the second objective, covariates included maternal education and household income. This information was reported by a parent at the first data collection wave, when QLSCD participants were children.
Statistical analysis
χ 2 tests and ANOVA were used to compare the characteristics of the participants (for categorical and continuous variables, respectively). Linear and logistic regressions analyses (for continuous and categorical outcomes, respectively) were used to investigate longitudinal associations between food patterns at age 22 years and weight status at age 23 years (first objective). In these analyses, independent variables referred to scores of the four patterns identified at age 22 years. Continuous outcomes were represented by BMI at age 23 years and BMIΔ between 22 and 23 years. Categorical outcomes were represented by excess weight at age 23 years, i.e. overweight or obesity (BMI ≥ 25) and obesity specifically (BMI ≥ 30). BMI at age 23 years was log transformed to correct for the non-normality of residuals. For ease of interpretation, beta coefficient (b) and 95 % CI have been retransformed by exponentiation. Multivariable analyses related to the first objective were adjusted for sex, living situation and level of education in young adulthood. The potential moderating effect of sex was also tested by adding interaction terms in the linear regressions. Stratified analyses by sex were reported for statistically significant interactions.
Pearson’s correlations were used to examine stability in the frequency of consumption of various food groups between different childhood periods. Linear regression analyses were used to investigate the longitudinal associations between food group consumption in each childhood period and food patterns in young adulthood (second objective). Independent variables referred to the frequency (per day) of consumption of eight food groups at a given childhood period. Outcome variables referred to scores of the four patterns identified at age 22 years. Food pattern scores were log transformed to correct for the non-normality of residuals, and estimates (b, 95 % CI) have been retransformed by exponentiation. These analyses were adjusted for sex, maternal education and household income when QLSCD participants were children. We also tested whether the associations differed by sex or by weight status in adulthood by adding interaction terms in the linear regressions. Stratified analyses were reported for statistically significant interactions. Spearman’s correlations were also used to explore associations between food patterns and frequencies of consumption of specific food items at age 13 years (since this data-collection wave in childhood included a more detailed and comprehensive list of food as shown in online Supplementary Table 2).
Complete case analyses were conducted. We used inverse probability weighting to account for attrition over the years (causing the majority of the missing data). All regression analyses were weighted based on a propensity score calculated from a model including variables (sex, maternal education, sufficient income, birth weight and whether the mother was born in Canada) as predictors of inclusion in the study. The R package ‘twang’(Reference Cefalu, Ridgeway and McCaffrey30) was used with the average treatment effect to obtain weighted study participants that resemble the initial sample of QLSCD participants. Statistical analyses were carried out using RStudio(31) with R Statistical Software(32) version 4.3.0. A level of statistical significance of 0·05 was considered. For regression analyses, we used adjusted thresholds for each outcome considering the false discovery rate associated with multiple testing(Reference Benjamini and Hochberg33).
Results
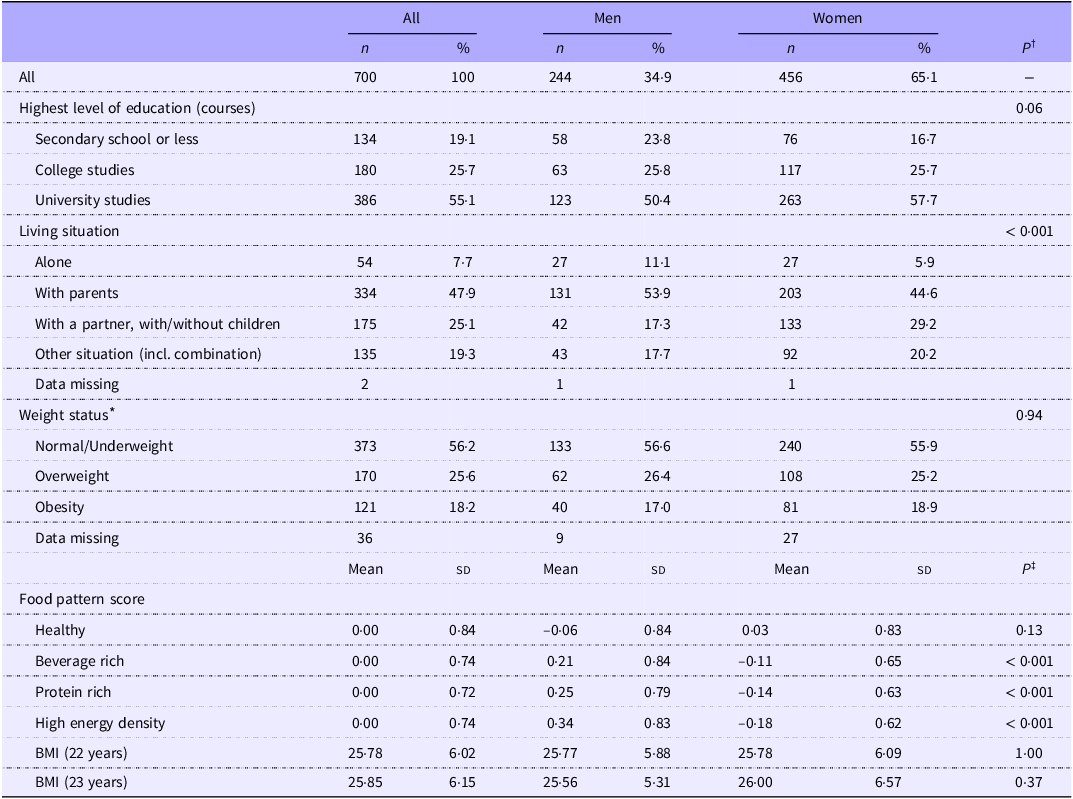
As shown in Table 1, almost two-thirds of the study sample included female participants. At age 22 years, a majority of participants had pursued post-secondary education and almost one in two was still living with a parent (proportionally more among male participants). A substantial proportion of the sample (44 % at age 23 years) had excess weight (BMI ≥ 25). There was no difference detected in BMI, nor weight status, according to the sex of participants. However, male participants had higher mean score, compared to female, for the beverage-rich, the protein-rich and the high-energy-density food patterns.
Table 1. Characteristics of young adult participants, all and by sex

* At age 23 years, i.e. one year after the dietary study among young adults. BMI was calculated as kg/m2 based on self-reported height and weight corrected(Reference Shields, Gorber and Janssen26). Weight status is based on WHO classification of BMI(25): underweight (BMI < 18·5), normal weight (BMI 18·5–24·9), overweight (BMI 25·0–29·9) and obese (BMI ≥ 30·0). Few participants were classified as underweight (< 2 % of the sample) and thus were grouped with the normal weight category.
† P value from χ2 tests.
‡ P value from one-way ANOVA.
Food patterns and weight in young adulthood
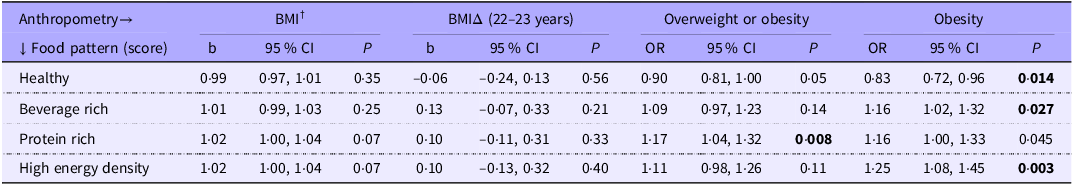
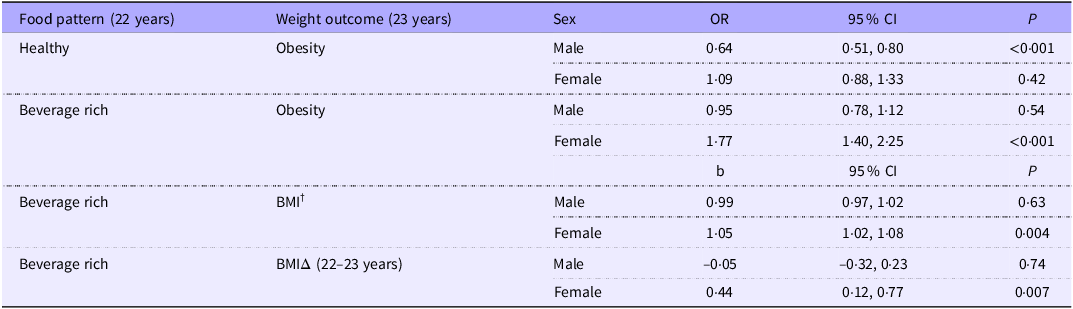
As shown in Table 2, a higher score on the healthy pattern at age 22 years was associated with a lower probability of obesity (BMI ≥ 30) a year later (OR 0·83; 95 % CI 0·72, 0·96). This association was moderated by sex. Stratified analysis revealed that this association was for male specifically (Table 3; OR 0·64; 95 % CI 0·51, 0·80 for male v. OR 1·09; 95 % CI 0·88, 1·33 for female). Conversely, participants having a higher score on the beverage-rich or the high-energy-density patterns at age 22 years were more likely to have a BMI ≥ 30 a year later (Table 2; OR 1·16; 95 % CI 1·02, 1·32 for the beverage-rich pattern; OR 1·25; 95 % CI 1·08, 1·45 for the high-energy-density pattern). The association with the beverage-rich pattern was moderated by sex. A stratified analysis showed that this association concerns females specifically (Table 3; OR 1·77; 95 % CI 1·40, 2·25 for female v. OR 0·95; 95 % CI 0·78, 1·12 for male). Lastly, a higher score on the protein-rich pattern at 22 years was associated with a higher probability of excess weight (BMI ≥ 25) at age 23 years (Table 2; OR 1·17; 95 % CI 1·04, 1·32).
Table 2. Association between food patterns at age 22 years and anthropometry at age 23 years *

b, beta coefficient; BMIΔ, BMI change, FDR, false discovery rate.
Bold: P < FDR-adjusted threshold(Reference Benjamini and Hochberg33) (0·013 for overweight or obesity; 0·038 for obesity).
* n 664 for all weight outcomes except BMIΔ (n 661); based on linear regressions testing, for BMI and BMIΔ, and on logistic regressions, for overweight or obesity. BMI based on self-reported height and weight corrected(Reference Shields, Gorber and Janssen26). Analyses adjusted for sex, living situation and level of education at the time of the dietary study in young adulthood and weighed for attrition.
† The BMI outcome at age 23 years was log transformed to correct for the non-normality of residuals. For ease of interpretation, estimates (b and 95 % CI) presented have been retransformed by exponentiation.
Table 3. Associations between food patterns at age 22 years and weight outcomes at age 23 years: analysis stratified by sex (for significant interactions only) *

b, beta coefficient; BMIΔ, BMI change; FDR, false discovery rate.
* P < FDR-adjusted threshold(Reference Benjamini and Hochberg33). Based on linear regressions testing, for BMI and BMIΔ, and on logistic regressions, for obesity. BMI based on self-reported height and weight corrected(Reference Shields, Gorber and Janssen26). Analyses adjusted for sex, living situation and level of education at the time of the dietary study in young adulthood, and weighed for attrition.
† The BMI outcome at age 23 years was log transformed to correct for the non-normality of residuals. For ease of interpretation, estimates (b and 95 % CI) have been retransformed by exponentiation.
There was no association detected between any of the food patterns and the BMI or BMIΔ outcomes. However, stratified analyses according to sex indicated that among women, the beverage-rich pattern at 22 years was positively associated with both BMI at age 23 years and BMIΔ between 22 and 23 years (Table 3). More specifically, an increase of one sd in the score for the beverage-rich pattern at age 22 years was related to a BMI 5 % higher at age 23 years (95 % CI 2 %, 8 %) and an increase in BMI over 1 year equivalent to 0·44 kg/m2 (95 % CI 0·12, 0·77).
Results of the sensitivity analysis, using uncorrected anthropometric data, remained very similar to the above findings (online Supplementary Table 3). Estimates in the main analysis were almost identical to those of the sensitivity analysis for the BMI and BMIΔ outcomes, while they appeared more conservative for categorical outcomes (particularly for BMI ≥ 25).
Food consumption in childhood and food patterns in young adulthood
Median and interquartile range for frequency of consumption of various food groups during early, middle and late childhood are presented in online Supplementary Table 4. Correlations between childhood periods are presented in online Supplementary Table 5. These results show moderate to strong correlations from early to middle childhood (e.g. Pearson’s correlation coefficient (r) of 0·66 for ‘fruit and vegetables’), moderate correlations from middle to late childhood (e.g. r of 0·50 for ‘fruit and vegetables’ and ‘milk’) and fair to moderate correlations from early to late childhood (e.g. r of 0·46 for ‘fruit and vegetables’).
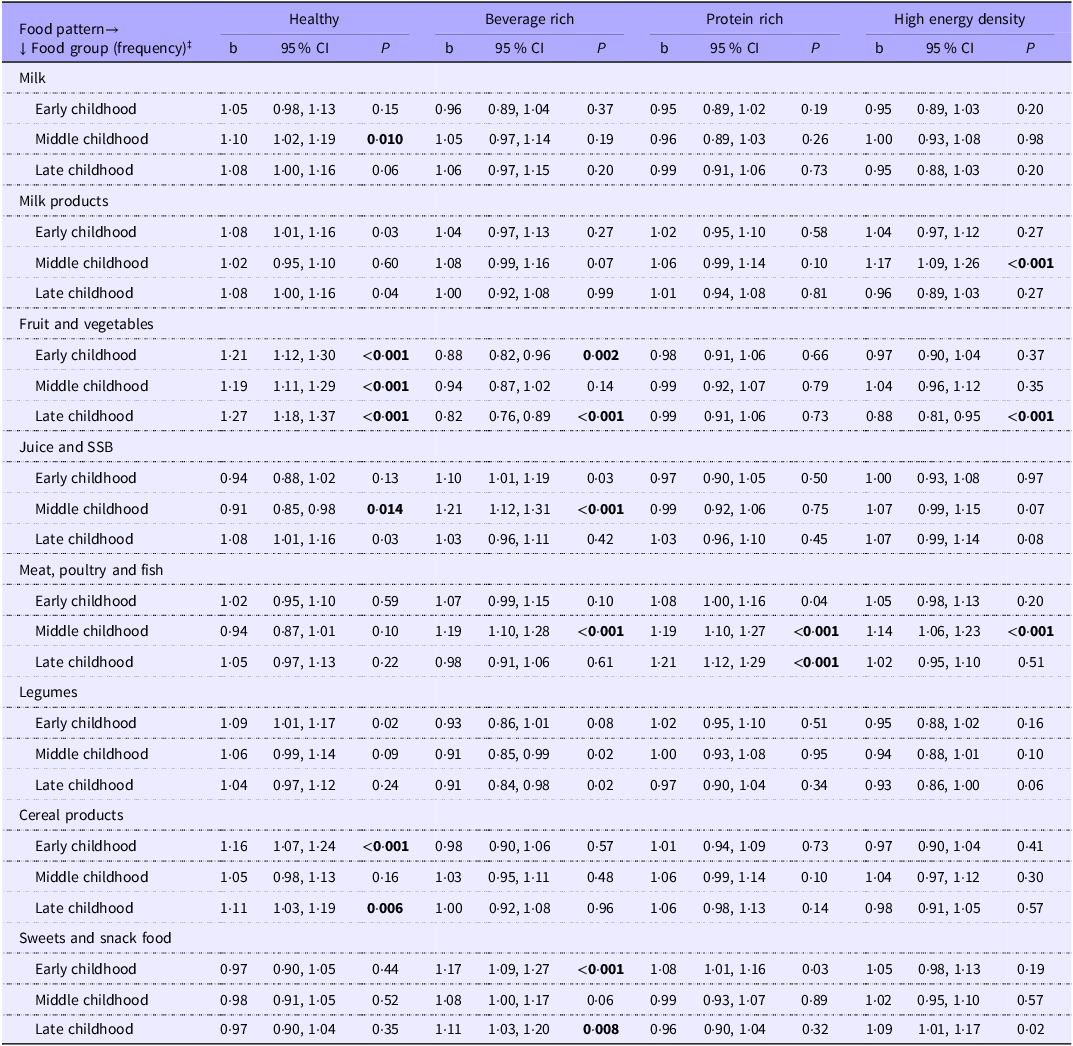
In multivariable linear regression analyses, a higher frequency of consumption of ‘fruit and vegetables’ throughout childhood (at all stages) was related to a higher score on the healthy pattern in young adulthood (Table 4). More specifically, an increase of one sd in the frequency of consumption of ‘fruit and vegetables’ in early, middle or late childhood was associated with an increase of 19–27% in the healthy pattern score in young adulthood (95% CI: 12 %, 30 % for early childhood; 11%, 29 % for middle childhood and 18%, 37 % for late childhood). A higher frequency of consumption of ‘fruit and vegetables’ in early and late childhood was also associated with a lower score on the beverage-rich pattern in young adulthood (b 0·88; 95% CI 0·82, 0·96 for early childhood; b 0·82; 95% CI 0·76, 0·89 for late childhood). Consuming ‘fruit and vegetables’ more frequently in late childhood was further associated with a lower score on the high-energy-density pattern in young adulthood (b 0·88; 95% CI 0·81, 0·95).
Table 4. Association between food group consumption at different stages in childhood † and score for food patterns identified in young adulthood *

b, beta coefficient; FDR, false discovery rate; SSB, sugar-sweetened beverages.
Bold: P < FDR-adjusted threshold(Reference Benjamini and Hochberg33) (0·015 for healthy pattern; 0·013 for beverage-rich pattern; 0·004 for protein-rich pattern and 0·006 for high-energy-density pattern).
* Based on linear regressions testing. The food pattern outcomes were log transformed to correct for the non-normality of residuals. For ease of interpretation, values presented have been retransformed by exponentiation. Analyses adjusted for sex and both maternal education and household income when QLSCD participants were children and weighed for attrition.
† Early childhood (<5 years): n 700; middle childhood (5–7 years): n 681; late childhood (10–13 years): n 636.
‡ ‘Milk products’ include cheese, yogurt and milk-based desserts; ‘fruit and vegetables’ include potatoes; ‘cereal products’ include bread, cereals and pasta and ‘sweets and snack food’ include pastry, sweets, cookies and chips. In early childhood, ‘juice and SSB’ refer to juices and fruit drinks only. In late childhood, ‘legumes’ were queried in two out of three waves.
Frequencies of consumption of ‘cereal products’, in early and late childhood, and of ‘milk’, in middle childhood, were positively associated with a healthy pattern in adulthood (b 1·16; 95 % CI 1·07, 1·24 for cereals in early childhood; b 1·11; 95 % CI 1·03, 1·19 for cereals in late childhood; b 1·10; 95 % CI 1·02, 1·19 for milk in middle childhood). Conversely, drinking ‘juice and SSB’ more frequently in middle childhood was negatively associated with the healthy pattern (b 0·91; 95 % CI 0·85, 0·98), but positively associated with the beverage-rich pattern (b 1·21; 95 % CI 1·12, 1·31), in young adulthood. Frequency of consumption of ‘sweets and snack food’ in early and late childhood was also positively associated with a higher score on the beverage-rich pattern in young adulthood (b 1·17; 95 % CI 1·09, 1·27 for early childhood; b 1·11; 95 % CI 1·03, 1·20 for late childhood). As for animal sources of protein, consuming ‘meat, poultry and fish’ more frequently in middle and late childhood was related to a higher score on the protein-rich pattern in young adulthood (b 1·19; 95 % CI 1·10, 1·27 for middle childhood; b 1·21; 95 % CI 1·12, 1·29 for late childhood). In middle childhood specifically, frequency of consumption of ‘meat, poultry and fish’ was also positively associated with higher scores on the beverage-rich (b 1·19; 95 % CI 1·10, 1·28) and the high-energy-density patterns (b 1·14; 95 % CI 1·06, 1·23). Similarly, frequency of consumption of ‘milk products’ in middle childhood was positively related to higher scores on the high-energy-density pattern in young adulthood (b 1·17; 95 % CI 1·09, 1·26).
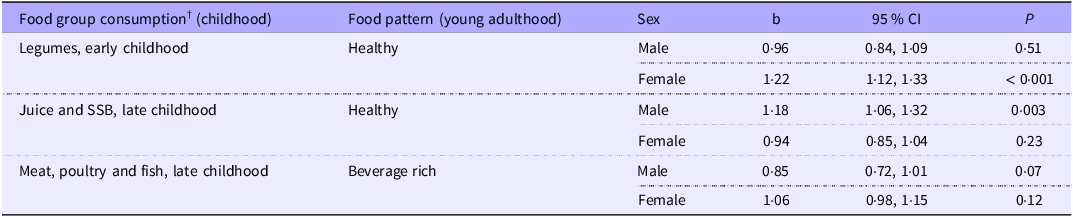
There were very few associations moderated by sex. For those associations, stratified analysis revealed, among female participants, a positive association between consumption of ‘legumes’ in early childhood and having a healthy food pattern (b 1·22; 95 % CI 1·12, 1·33) in young adulthood (Table 5). In late childhood, consumption of ‘juice and SSB’ was positively associated with the healthy pattern (b 1·18; 95 % CI 1·06, 1·32) among male participants (Table 5). We did not detect a moderating effect by weight status at age 23 years (data not shown).
Table 5. Associations between food group consumption in childhood and food patterns in young adulthood: analysis stratified by sex (for significant interactions only) *

b, beta coefficient; FDR, false discovery rate; SSB, sugar-sweetened beverages.
* P < FDR-adjusted threshold(Reference Benjamini and Hochberg33). Based on linear regressions testing. Analyses adjusted for sex and both maternal education and household income when QLSCD participants were children, and weighed for attrition. The food pattern outcomes were log transformed to correct for the non-normality of residuals. For ease of interpretation, estimates (b and 95 % CI) have been retransformed by exponentiation.
† Based on frequency questions.
It is worth nuancing some of the above results given that the pattern of association may vary for some items included in a specific food group (online Supplementary Tables 6). For example, according to information collected at age 13 years (for which more comprehensive data were available), frequent consumption of processed meat, white bread and sugary drinks was correlated with higher scores on the beverage-rich and the high-energy-density patterns in young adulthood (e.g. Spearman’s correlation coefficients (r s ) of 0·17 for processed meat in relation to the high-energy-density pattern). Conversely, frequent consumption of fish and seafood, yogurt, whole-grain bread and juice at age 13 was correlated with higher scores on the healthy food pattern in young adulthood (e.g. r s of 0·25 for whole-grain bread).
Discussion
We conducted a secondary analysis of data from a contemporary birth cohort (QLSCD) in order to examine the longitudinal associations between dietary habits (described here as food patterns) and weight status in young adulthood (first objective). As expected, dietary habits characterised by the consumption of vegetables, fruit, plant-based sources of protein and whole-grain cereal products were related (among men) to a lower risk of obesity a year later. Conversely, dietary habits characterised by a high consumption of energy-dense foods, of animal sources of proteins and, among women specifically, of high quantities of liquids (namely sugary drinks) were associated with higher weights or excess weight a year later.
The idea that a healthy diet might be protective against weight gain or excess weight, particularly obesity, has been studied extensively(Reference Seifu, Fahey and Hailemariam34). A recent umbrella review on the subject concluded that adherence to a Mediterranean-type diet, similar to our healthy food pattern, may contribute to lower the risk of obesity in adulthood(Reference Seifu, Fahey and Hailemariam34). A recent study focusing on the period of young adulthood examined more specifically the relationship between dietary patterns (derived by principal component analysis) and longitudinal changes in body weight(Reference Ushula, Mamun and Darssan7). Across a 9-year follow-up period (i.e. from age 21 to 30 years), this study of Australian young adults (n 1344) found that a diet characterised by a high consumption of meats, fried and processed foods, refined grains and high-fat dairy products (a pattern labelled as ‘Western diet’) was associated with higher gain in body weight and BMI over time. In contrast, a diet characterised by a high consumption of fruit and vegetables, cereals and grains, nuts, fish, low-fat dairy products and non-fat spreads (a pattern labelled as ‘Prudent diet’) was not significantly associated with BMI change over a 9-year period. These findings led the authors to conclude that while the ‘Western’ dietary pattern appears to favour weight gain over time, the ‘Prudent’ dietary pattern may have contributed, to some extent, to weight maintenance(Reference Ushula, Mamun and Darssan7). Overall, our findings appear to be in agreement with this general conclusion.
The present study also detected, although only for women, a positive association between consumption of sugary drinks and other liquids (i.e. beverage-rich pattern) and different weight outcomes (i.e. obesity status, BMI and BMI change over 1 year) in young adulthood. It has been suggested that high liquid consumption, namely sugary drinks, may not be compensated by lower intakes of other foods throughout the day, potentially resulting in overconsumption of energy(Reference Pan and Hu35). Among potential mechanisms, drinking liquids would not benefit from the satiety signals triggered by mastication of solid foods(Reference DiMeglio and Mattes36). Although BMI change may be modest over 1 year, kilograms are likely to accumulate over the years and contribute to excess weight (overweight or obesity) on the long term. Interestingly, a longitudinal study conducted in Finland (n 2139) reported, for women exclusively, an association between increased consumption of sweetened soft drinks from childhood to adulthood and BMI and overweight in adulthood(Reference Nissinen, Mikkilä and Männistö37). It was suggested that there may be gender differences in the consumption of sugary drinks. For example, a high or frequent consumption of sweetened soft drinks might correlate with unhealthy dietary habits to a greater extent in women compared with men(Reference Nissinen, Mikkilä and Männistö37). As our beverage-rich pattern is largely characterised by a high consumption of sugary drinks, similar conclusions may apply to our results.
As a second objective, we also examined how various food patterns relate to the food consumption of the study participants when they were children. Several associations were noted, over and above socio-economic characteristics, suggesting that food choices throughout childhood are important determinants of the quality of dietary habits in young adulthood. As expected, healthier food choices in childhood were associated with healthier food patterns in young adulthood. The reverse was also true, i.e. less healthy food choices in childhood were associated with less healthy food patterns in young adulthood.
Research on diet and weight often suggests that eating habits established in childhood would persist into adulthood. Such an assumption seems sensible although there is little scientific evidence to support it. Longitudinal studies looking at dietary habits of young adults in relation to their past diet most often focus on the transition from adolescence to adulthood(Reference Craigie, Lake and Kelly22). Very few studies have looked further back in time, particularly up to early childhood. One exception is a Finnish cohort study that began in the early 1980s and included participants aged 3–18 years at baseline(Reference Mikkilä, Räsänen and Raitakari38). Dietary data was collected using 48-hour dietary recalls and allowed examining the tracking of food, nutrients and dietary patterns over a period of 21 years (n 1037)(Reference Mikkilä, Räsänen and Raitakari38,Reference Mikkilä, Räsänen and Raitakari39) . Numerous data analyses over the years led the authors to conclude that eating habits established in childhood are likely to persist in adulthood and influence long-term health status(Reference Mikkilä, Räsänen and Raitakari40,Reference Kaikkonen, Mikkilä and Magnussen41) . A smaller Canadian longitudinal study (n 130) also examined the tracking of dietary patterns over a period of 20 years, this time among participants aged 8–15 years at baseline, in 1991(Reference Movassagh, Baxter-Jones and Kontulainen42). That study found moderate tracking for specific patterns, from middle childhood to adulthood, namely one characterising a healthy diet (with higher consumption of vegetables, fruit and wholegrain products, among others) and one reflecting consumption of high fat and high protein food sources(Reference Movassagh, Baxter-Jones and Kontulainen42). Although our study did not focus on dietary tracking, our observations, in a contemporary group of young adults who were all of the same age at baseline, corroborate these earlier findings about the potential role of diet throughout childhood in determining dietary habits in adulthood.
Importantly, a higher frequency of consumption of fruit and vegetables across all childhood periods was associated with a healthier diet in young adulthood. In certain periods, namely in late childhood, eating fruit and vegetables more frequently was also associated, in young adulthood, with a lower adherence to less favourable patterns (characterised by a high consumption of sugary drinks or foods rich in fat and Na). Altogether, these findings reinforce the value of promoting consumption of fruit and vegetables among children of all ages as a key strategy to foster healthy dietary habits in the long term. Correlation analyses between childhood periods also suggest that there is some stability in food consumption throughout childhood, particularly for fruit and vegetables, supporting the idea that children would benefit from being exposed to (and learning to like) a variety of fruit and vegetables as early in life as possible.
Strengths and limitations
The strengths of the present research include its longitudinal study design of a contemporary birth-cohort, a relatively large sample size and the quality of the long-term follow-up. We had access to dietary data collected among the same participants on multiple occasions over a period of 22 years, which is relatively uncommon. Thus, we were able to characterise certain aspects of food consumption throughout four life periods, i.e. early, middle and late childhood and young adulthood. We used food patterns as a dietary outcome to characterise the overall diet of today’s young adults, taking into consideration how foods are consumed together(Reference Newby and Tucker43).
Nevertheless, our interpretations must also take into account the following limitations. First, dietary and anthropometric data were self-reported and are thus susceptible to biases and measurement errors(Reference Shields, Gorber and Janssen26,Reference Subar, Freedman and Tooze44) . For the childhood periods, we assessed the frequency of consumption of a limited number of foods, and we did not have information on quantities consumed. There were also minor differences in the list of food items covered in certain data collection waves, although these differences were minimised in the food groups. For the period of young adulthood, more comprehensive dietary information (including quantities) was collected. Still, food frequency data obtained in childhood or adulthood were not complete enough to derive valid energy intakes and, in turn, to consider adjustments for potential misreporting. As for self-reported anthropometric data in young adulthood, we tried to minimise error by applying a correction based on a comparison between self-reported and measured anthropometric data in a national Canadian study(Reference Shields, Gorber and Janssen26). Results of a sensitivity analysis comparing the use of both corrected and uncorrected data suggested that the results of the main analysis remain conservative.
Missing data related to attrition over the years represent another limitation intrinsic to any longitudinal study design. At its inception, QLSCD included a representative sample of children born in Québec in 1998. Our study sample, relying on participants in a dietary study conducted 22 years later, included an over-representation of women and of participants born in a family with a higher socio-economic status. Nevertheless, we minimised the effect of attrition by applying a weight in the multivariable analyses, which took into account several socio-demographic characteristics responsible for differences between the study sample and the QLSCD initial sample. We are thus confident that the results remain generalisable to the studied population, at least on the basis of these characteristics. Finally, although effect sizes may be low for certain associations, altogether these results appear consistent and relevant for future research and public health interventions.
In conclusion, findings from the present study give support to the notion that food consumption throughout childhood may be an important determinant of long-term dietary habits, even up to adulthood. Young adults with healthier dietary habits were also more likely to maintain healthier weight. Preventive dietary interventions in the early years are thus crucial to foster eating environments that favour the development of healthy food preferences and the maintenance of healthy weights.
Supplementary material
For supplementary material/s referred to in this article, please visit https://doi.org/10.1017/S0007114525106065
Acknowledgements
We are grateful to the QLSCD participants and their families who took part in the various data-collection rounds over the years. The Québec Longitudinal Study of Child Development was supported by funding from departments and agencies of the Government of Québec (including the Ministère de la Santé et des Services Sociaux, Ministère de la Famille, the Ministère de l’Éducation and Ministère de l’Enseignement Supérieur, the Ministère du Travail, de l’Emploi et de la Solidarité Sociale and the Institut de la Statistique du Québec), the Lucie and André Chagnon Foundation, the Institut de Recherche Robert-Sauvé en Santé et en Sécurité du Travail and the Research Centre of the Sainte-Justine University Hospital. Michel Boivin was supported by the Canada Research Chair program.
This work was supported by the Canadian Institutes of Health Research (CIHR) (LD, grant number 165964). CIHR had no role in the design, analysis or writing of this article.
Authorship: L. D., B. B. and D. G. designed the current study. B. B. and L. D. wrote the first draft of the manuscript. D. G. was responsible for all statistical analyses. M. B., R. E. T., D. P. and L. D. contributed to the funding acquisition, methodology and data collection of the dietary study and/or previous QLSCD rounds. All authors contributed to results interpretation, made critical revisions to the text and approved the manuscript submitted for publication.
The authors declare no conflicts of interest.


 Open access