


1. Introduction
Until recent years, the most prominent and widely used indicator of human wellbeing has been Gross Domestic Product (GDP) per capita to assist governments in formulating effective policy interventions for social progress (Stiglitz et al., Reference Stiglitz, Sen and Fitoussi2009). Subsequently, climate impacts on human life are also measured mainly by economic damages and the social cost of carbon (Wagner et al., Reference Wagner, Anthoff, Cropper, Dietz, Gillingham, Groom and Stock2021). Human wellbeing is a multidimensional concept, though, with material, social, and ecological components that go beyond economic development indicated by the GDP per capita metric. This multidimensionality is increasingly recognized in the wellbeing literature, and several composite wellbeing metrics have been defined such as the Human Development Index (Anand & Sen, Reference Anand and Sen2000; UNDP, 2022), the OECD Better Life Index (Durand, Reference Durand2015), the Decent Living Standards (Rao & Min, Reference Rao and Min2018), and the Social Progress Index (Greve, Reference Greve2017). Despite an extensive list of available wellbeing metrics that capture both objective (material, objectively observed) and subjective (self-reported) aspects of human wellbeing (Barrington-Leigh & Escande, Reference Barrington-Leigh and Escande2018), climate impacts on human wellbeing are still measured by socioeconomic damages (Burke et al., Reference Burke, Hsiang and Miguel2015; Diaz & Moore, Reference Diaz and Moore2017; van der Wijst et al., Reference van der Wijst, Bosello, Dasgupta, Drouet, Emmerling, Hof and van Vuuren2023), health and mortality impacts (Bressler, Reference Bressler2021; Lenton et al., Reference Lenton, Xu, Abrams, Ghadiali, Loriani, Sakschewski and Scheffer2023), or more broadly, by the achievement of the sustainable development goals (Fuso Nerini et al., Reference Fuso Nerini, Sovacool, Hughes, Cozzi, Cosgrave, Howells and Milligan2019). A composite dynamic analysis of climate impacts on future wellbeing is still missing.
Wellbeing is unequivocally a multifaceted concept, and future dynamics of both global wellbeing and climate change depend on the co-evolution of social, economic and natural systems. For instance, ample evidence since the 1970s shows that life expectancy, the longevity basis of human wellbeing, positively relates to educational attainment and economic development (Lutz & Kebede, Reference Lutz and Kebede2018; Preston, Reference Preston1975), and growing evidence quantifies the negative impacts of climate change on life expectancy (Bressler et al., Reference Bressler, Moore, Rennert and Anthoff2021; Thiery et al., Reference Thiery, Lange, Rogelj, Schleussner, Gudmundsson, Seneviratne and Wada2021). Similarly, higher economic output cascades into higher educational attainment through higher investments in education, lower fertility rates and lower population, whereas population and educational attainment are key inputs to economic output, in return, through productivity and labor force participation (Barro & Lee, Reference Barro and Lee2015; Becker, Reference Becker2009; Lutz et al., Reference Lutz, Cuaresma and Sanderson2008). Population changes and economic growth are among the key drivers of climate change (Dong et al., Reference Dong, Hochman and Timilsina2020; Raupach et al., Reference Raupach, Marland, Ciais, Le Quéré, Canadell, Klepper and Field2007; Xia et al., Reference Xia, Wang, Liu and Pan2021), which in turn is expected to cause severe damage to economic output. This interconnectedness requires a dynamic feedback perspective to understand the future developments in wellbeing, and an endogenous modeling of climate, economy and society relationships, which has been absent so far in most models of human-Earth systems.
Here, we analyze the socioeconomic and climate impacts on future human wellbeing using Years of Good Life (YoGL) as a composite wellbeing metric and the FeliX model as a global systems model of climate, economy, environment and society interactions. We establish the importance of feedback between climate damages and GDP, as well as population change, as main drivers of wellbeing by comparing our endogenous climate, population and GDP projections with the existing projections in the Intergovernmental Panel on Climate Change's (IPCC) Sixth Assessment Report (AR6 scenario database). We further introduce and illustrate the concept of wellbeing cost of carbon (WCC) as a measure that can be used in climate policy assessments beyond economic metrics such as the social cost of carbon.
2. Methods
YoGL is specifically designed to assess the sustainability of long-term development trajectories by estimating the average remaining years of life an individual can expect to live in a ‘good’ state (Lutz et al., Reference Lutz, Striessnig, Dimitrova, Ghislandi, Lijadi, Reiter and Yildiz2021). YoGL's fundamental assumption is that individuals can experience quality of life only if they are alive, hence life expectancy constitutes the basis of YoGL. Mere survival, however, is not sufficient alone to represent wellbeing, and ‘good life’ is defined by meeting minimum standards of both objectively observable conditions of capable longevity and subjective life satisfaction. Following the capabilities approach, the objective conditions of capable longevity (Desai et al., Reference Desai, Sen and Boltvinik1992) are (i) being out of poverty, (ii) being cognitively enabled, and (iii) being physically healthy. In previous empirical applications of YoGL (Lutz et al., Reference Lutz, Striessnig, Dimitrova, Ghislandi, Lijadi, Reiter and Yildiz2021; Reiter & Spitzer, Reference Reiter and Spitzer2021; Striessnig et al., Reference Striessnig, Reiter and Dimitrova2021), the population share above critical thresholds in the three objective conditions and the subjective life satisfaction, which represents the ‘good’ fraction of life expectancy, is derived from individual characteristics measured in representative cross-sectional surveys in multiple countries. Unlike other indicators, this foundation on individual characteristics also allows for explicit differentiation by relevant dimensions such as sex and age cohort. Therefore, our choice for YoGL is motivated by its theoretical basis and empirical grounding (Lutz et al., Reference Lutz, Striessnig, Dimitrova, Ghislandi, Lijadi, Reiter and Yildiz2021), besides its clear real-life analogy and its ability to represent widely shared values for human development beyond economic growth.
The FeliX model is a globally aggregate, feedback-rich system dynamics model of climate, economy, environment, and society. It represents the main biophysical and socioeconomic mechanisms of global environmental and economic change by capturing the main feedbacks within and between economy, energy, carbon cycle, climate, biodiversity, water, population, food and land use systems (Eker et al., Reference Eker, Liu, Reiter and Kuhn2023; Rydzak et al., Reference Rydzak, Obersteiner, Kraxner, Fritz and McCallum2013). We extend the FeliX model to include YoGL of global sub-populations defined by sex and 5-year age intervals between 20 and 100.
In its original conception (Lutz et al., Reference Lutz, Striessnig, Dimitrova, Ghislandi, Lijadi, Reiter and Yildiz2021), YoGL was calculated based on the well-established Sullivan method (Sullivan, Reference Sullivan1971) in demography, which combines a regular life table approach with cross-sectional data on a specific phenomenon of interest. Equation 1 denotes the formula for calculating YoGL at time t, at age x, where  ${l_{ix}}$ stands for number of survivors at age $x$ with sex i (beginning of age interval $j$);
$j$);  ${L_{ij}}$ stands for the person-years lived in the age interval $j$; and $\,{\pi _{ij}}$ stands for the prevalence of the state of interest in that age interval; and $A$ refers to the last (open) age group in the life table (i.e., 100+). In the case of YoGL, the phenomena of interest are subjective life satisfaction, and the objectively assessed states of poverty, cognition, and health. Therefore, $\,{\pi _{ij}}$ was obtained from the cross-sectional surveys as age- and sex-specific proportions of the population that are not living in poverty, are (at least) in basic physical and cognitive health, and report positive life satisfaction.
 \begin{equation}YoGL_{ix}\left(t\right)=\frac1{l_{ix}\left(t\right)}\sum_{j=x}^A\pi_{ij}\left(t\right)\ast L_{ij}\left(t\right)\end{equation}
 While the observed values of  $\,{\pi _{ij}}\,$can be derived from individual characteristics as measured in representative cross-sectional surveys, a global macro model requires a different approach beyond individual characteristics for projecting the prevalence of a good life. Therefore, in this study, ${\pi _{ij}}$ is calculated as the multiplication of age- and sex-specific proportions of people out of poverty (pij), people meeting or exceeding basic cognitive functioning (eij), people reporting positive life satisfaction ( ${s_{ij}}$) as a constant over time, and the ratio of healthy life expectancy to life expectancy (hij), as Equation 2 shows.
 \begin{equation}\pi_{ij}\left(t\right)=p_{ij}\left(t\right)\ast e_{ij}\left(t\right)\ast h_{ij}\left(t\right)\ast s_{ij}\end{equation}
 This multiplicative formulation of the prevalence of good life implies that poverty, cognitive functioning, health and positive life satisfaction are independent, and potentially leads to underestimation of YoGL. However, alternative formulations (e.g.,  $MIN\left\{ {\,{p_{ij}}\left( t \right),\,{e_{ij}}\left( t \right),{h_{ij}}\left( t \right),{s_{ij}}} \right\}$) would instead lead to overestimation of good life years. Therefore, within the limitations of top-down modeling, we choose the multiplicative formulation to remain within a cautious realm and avoid overestimation of YoGL. Supplementary Fig. 15 presents a comparison of model-based and empirical YoGL prevalence estimates, indicating that this model formulation indeed results in rather pessimistic outcomes for the measure of good life, especially for younger populations.
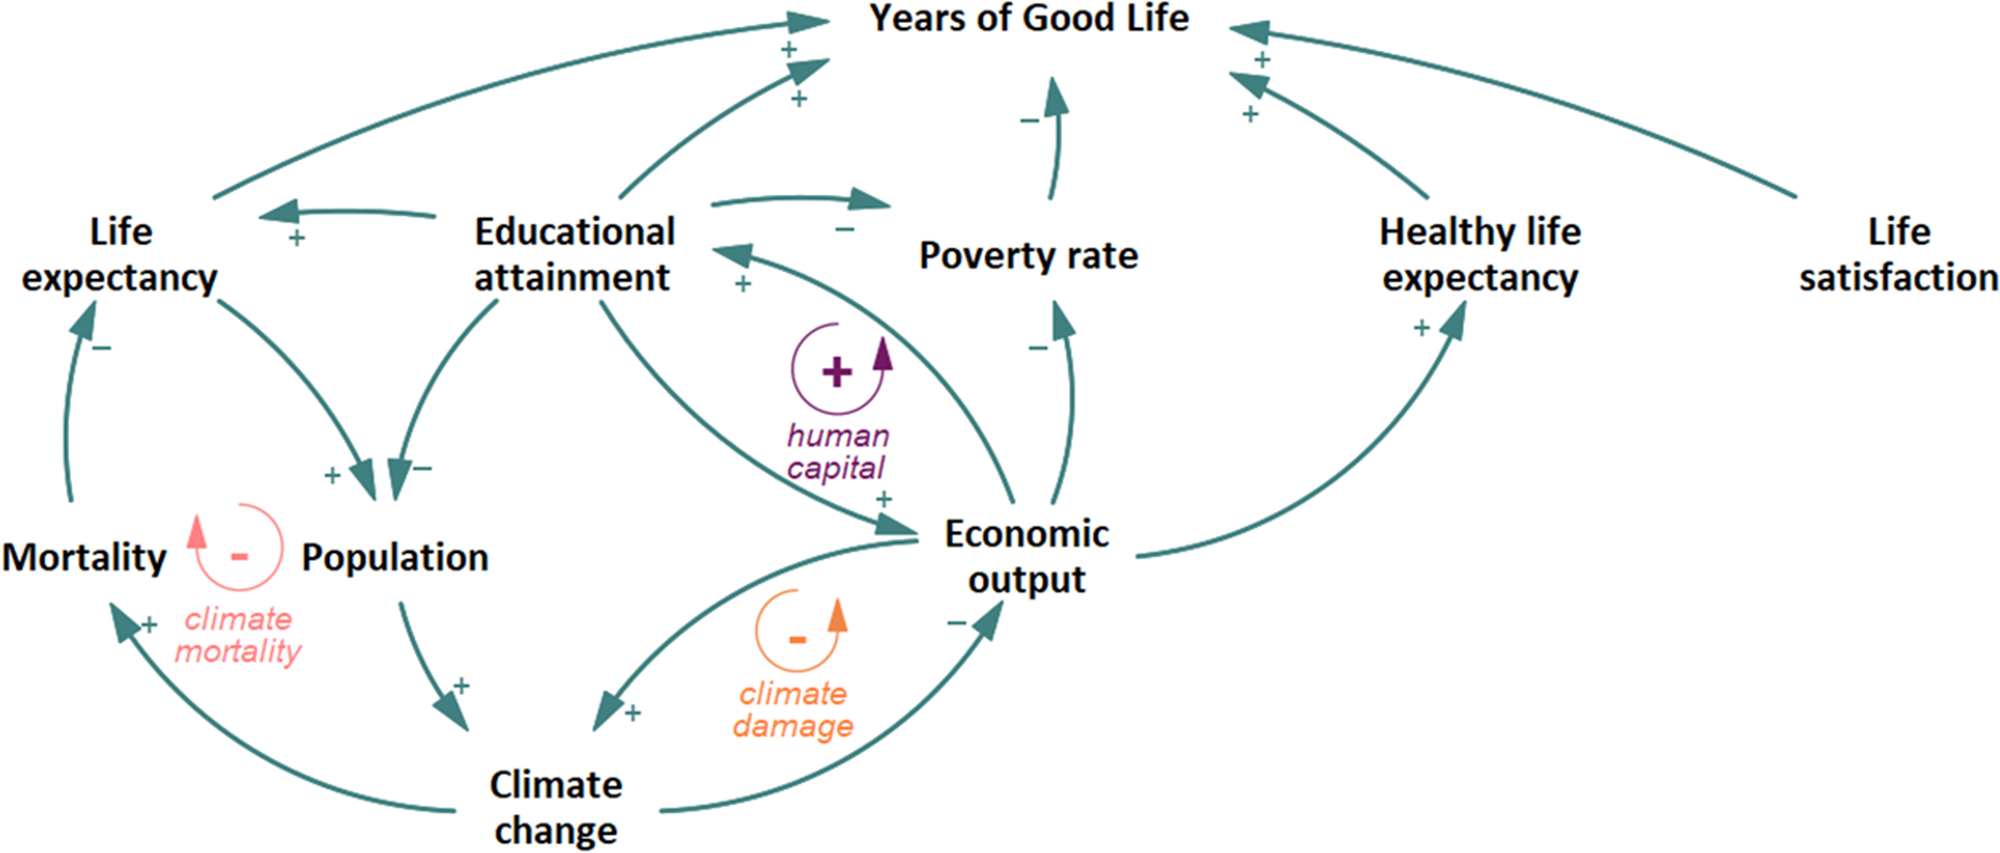
We model the three objective dimensions of capable longevity, as well as life expectancy, as endogenous variables generated by direct and indirect interconnections between different FeliX modules (Figure 1). In its original conception (Lutz et al., Reference Lutz, Striessnig, Dimitrova, Ghislandi, Lijadi, Reiter and Yildiz2021), the cognitive ability component of YoGL is measured by literacy rates, and physical health is associated with the population share having no limitations to mobility, as measured by standing up from a chair without any support. In the present population-level modeling context, we assume that the population fraction with at least primary education attainment is a proxy for literacy rates, hence the prevalence of cognitive ability, and the ratio of healthy life expectancy to life expectancy is a proxy for the prevalence of physical health. We set the prevalence of being out of poverty as the proportion of the population with income above the international extreme poverty line (i.e., $2.15 per person per day in 2017 PPP) (World Bank, 2022). Our choice on this conservative measure of poverty was to align our study with the commonly used international definition of poverty and with the original YoGL definition. As for the subjective life satisfaction dimension of YoGL, we assume it to be constant over time since the global average self-reported life satisfaction has been stable between 2011 and 2022 (Supplementary Figure 6) in almost all countries where data is collected. Still, we take age-dependent subjective life satisfaction indicators into account, since reported life satisfaction declines with age, both in male and female populations. See Supplementary Methods for further information on modeling YoGL.

Figure 1. Stylized depiction of the feedback between natural and social systems in the FeliX model that determine human wellbeing as measured by YoGL. A link with a positive (negative) sign represents a positive (negative) relationship, where a change in the cause variable leads to a change in the effect variable in the same (opposite) direction. Note that not all relationships are depicted in this figure, such as those between economic output and life expectancy.
We also introduce a new metric, WCC, analogous to the social cost of carbon, yet it extends beyond the solely economic impacts of climate, since projecting a composite wellbeing metric, such as YoGL, over time enables calculating the marginal effect of carbon emissions on wellbeing. We define WCC as the marginal loss of YoGL caused by emitting one extra ton of CO2 at any point in time, and show the resulting WCC values of marginal emissions in 2020 for different generations and sexes. Unlike optimization-based cost-benefit IAMs, the FeliX model cannot calculate the marginal impact of emissions since it is a simulation model. Therefore, we calculated WCC based on an ‘emission shock’ simulation, where 1 unit of CO2 is added in a given year to the emission trajectory in any scenario, as described in the Supplementary Methods.
We explore the implications of socioeconomic uncertainty for the evolution of wellbeing in three baseline scenarios aligned with the narratives of the Shared Socioeconomic Pathways (SSPs) (Riahi et al., Reference Riahi, van Vuuren, Kriegler, Edmonds, O'Neill, Fujimori and Tavoni2017): A reference scenario which follows the SSP2 (middle of the road) narrative for energy, land use, food, and climate policy, and endogenously projects demographic and economic outcomes by taking the climate impacts on human mortality and GDP per capita into account; an optimistic scenario which follows the SSP1 (green road) narrative with stronger climate policy and weak challenges to mitigation, and endogenous demographic and economic outcomes including the climate impacts; and a pessimistic scenario which follows the SSP3 (regional rivalry) narrative with strong challenges to mitigation and adaptation and the abovementioned endogenous feedbacks. Therefore, even though our study endogenously projects GDP, population and educational attainment, those are aligned with the SSP projections in the case of no climate damages, so that we explore well-known and consistent socioeconomic scenarios. These scenarios help explore the wellbeing impacts of different socioeconomic pathways either directly or indirectly through their climate impacts. See Supplementary Methods for details on the model development and scenario definitions.
3. Results
3.1. Future trajectories of global human wellbeing
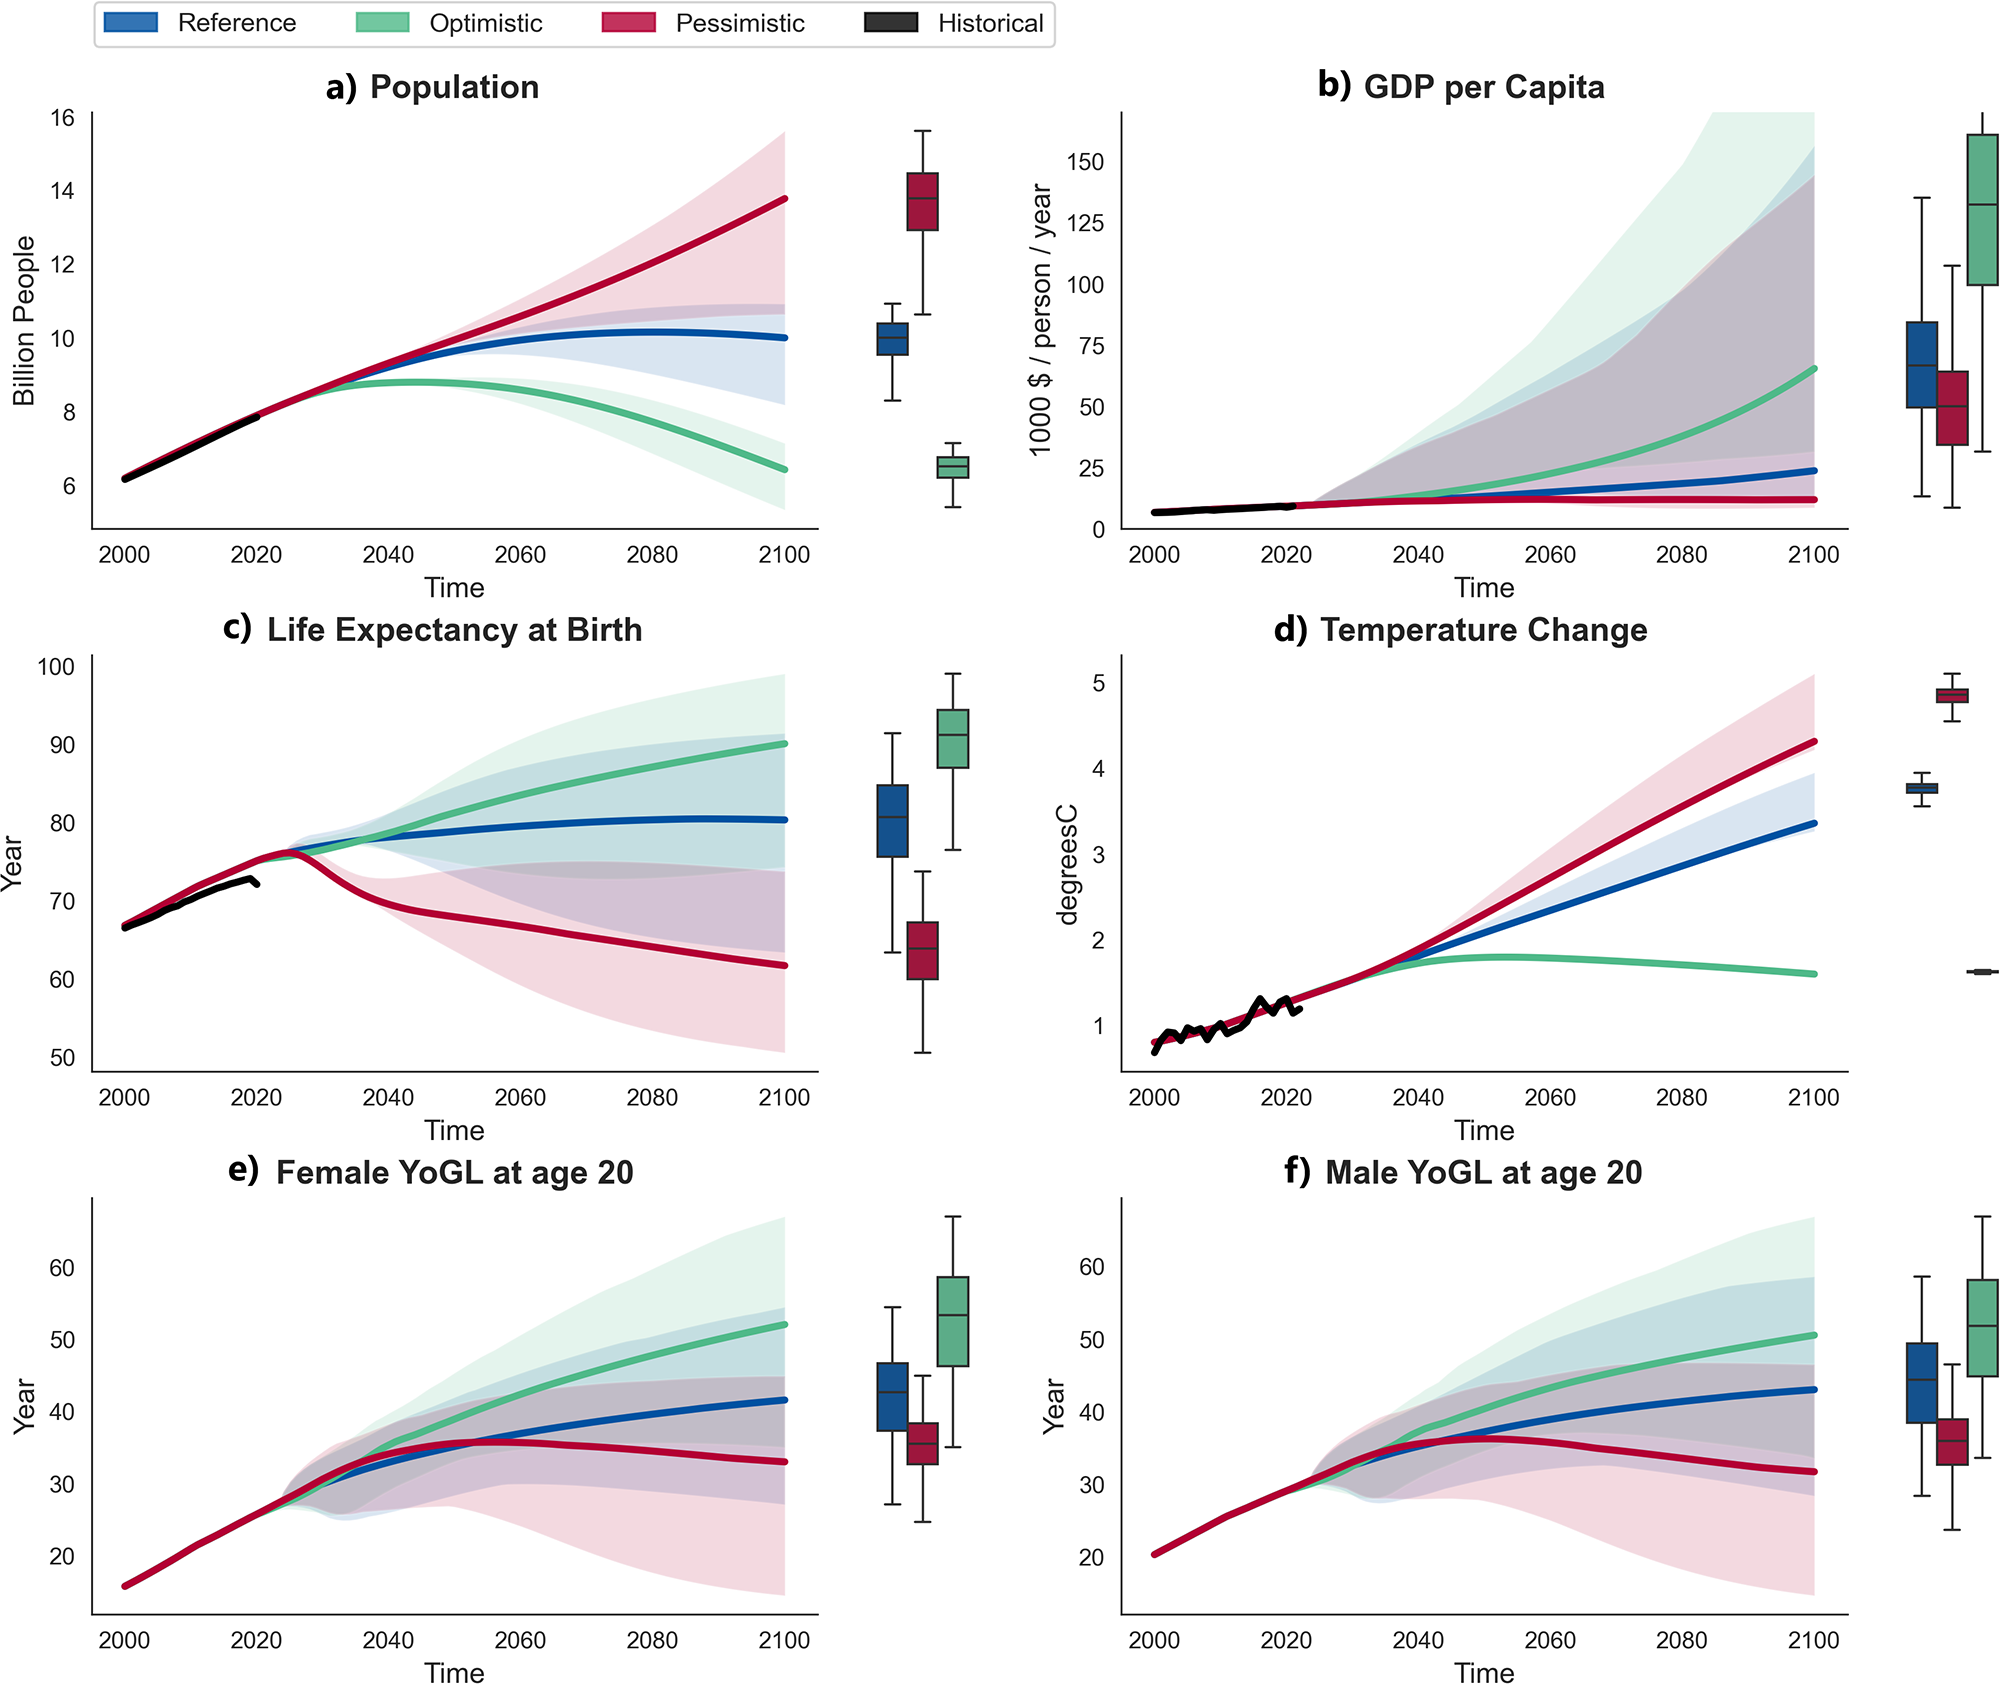
Figure 2 shows the modeled future trajectories of YoGL and its main demographic and socioeconomic drivers in the three baseline scenarios. Global population and the average life expectancy at birth are expected to increase and then stabilize around 10 billion people and 80 years, respectively, in the reference scenario. Since these two indicators are both a driver and an outcome of GHG emissions, in an optimistic scenario with favorable climate and sustainability outcomes, the population peaks around 8.8 billion in 2045, then declines due to falling fertility rates, while the average longevity of human life is extended to above 90 years by 2100. In the pessimistic scenario, the average longevity sharply declines to 61 years due to lower educational attainment rates and negative climate impacts on mortality, whereas the population reaches above 13 billion people (Figure 2a and c). Global average GDP per capita increases slightly above the current values until 2050 and remains stable thereafter, around 11,800 $(2005)/person/year in the pessimistic scenario that leads to severe climate damages on the economy; whereas the optimistic scenario with strong climate action helps avoid these damages and results in continued economic growth (Figure 2b). As both the outcome of economic production and the main driver of climate damages, global mean temperature change from preindustrial times exceeds 4°C in the pessimistic scenario by 2100 (Figure 2d). The optimistic scenario, however, keeps the global warming slightly above the 1.5°C climate target in 2100, after a mid-century overshoot reaching 1.8°C.

Figure 2. Dynamic simulation results for key drivers of wellbeing (a–d) and Years of Good Life (e, f) in the Reference, Optimistic and Pessimistic baseline scenarios. The bold colored lines show the baseline simulation results, while the shaded area around them depicts the uncertainty space generated by the parametric uncertainty in the wellbeing extension to the FeliX model (see Section 2). The box plots on the right-hand side of each plot show the density distribution of simulation results in 2100 with the 25th, 50th, and 75th 10 percentiles marked. The wide uncertainty range of GDP per capita above the baseline values is due to the uncertainty of climate damages, and our assumption to include the worst-case climate damage in the baseline scenarios. The bold black lines show the historical trajectories for the period 2000–2020, with the Population and Life Expectancy data from Wittgenstein Centre (Lutz et al., Reference Lutz, Goujon, Kc, Stonawski and Stilianakis2018), GDP data from the World Bank statistics (World Bank, 2023), and the temperature data from NASA GISTEMP v4 (GISTEMP Team, 2023; Lenssen et al., Reference Lenssen, Schmidt, Hansen, Menne, Persin, Ruedy and Zyss2019).
According to YoGL trajectories derived from the specified drivers (Supplementary Figure 2), future human wellbeing exhibits a promising trajectory throughout the remainder of the century, particularly in the optimistic scenario. The YoGL for 20-year-old females (Figure 2e) shows an increase from an average of 25.7 in 2020 to 41.5 in the reference scenario, and to 52 in the optimistic scenario by 2100. In the pessimistic scenario, YoGL keeps increasing until mid-century despite the declining life expectancy, due to the still declining poverty rates and increasing healthy life expectancy (Supplementary Figure 2). The initial wellbeing benefits observed in the pessimistic scenario, attributed to economic activity and food supply, undergo a reversal after mid-century, declining back to the current values. These findings suggest, for instance, that a female born in 2080, reaching the age of 20 in 2100, is expected to experience 10.5 more YoGL under the optimistic scenario compared to the reference, but 8.6 years less under the pessimistic scenario. Males tend to have a higher YoGL than females over time across all age groups, due to their lower poverty rates and higher educational attainment (Supplementary Figure 2), with the exception of the last decades of the century in the optimistic and pessimistic scenarios, where either educational or economic developments facilitate female wellbeing (Figure 2f and Supplementary Figure 1).
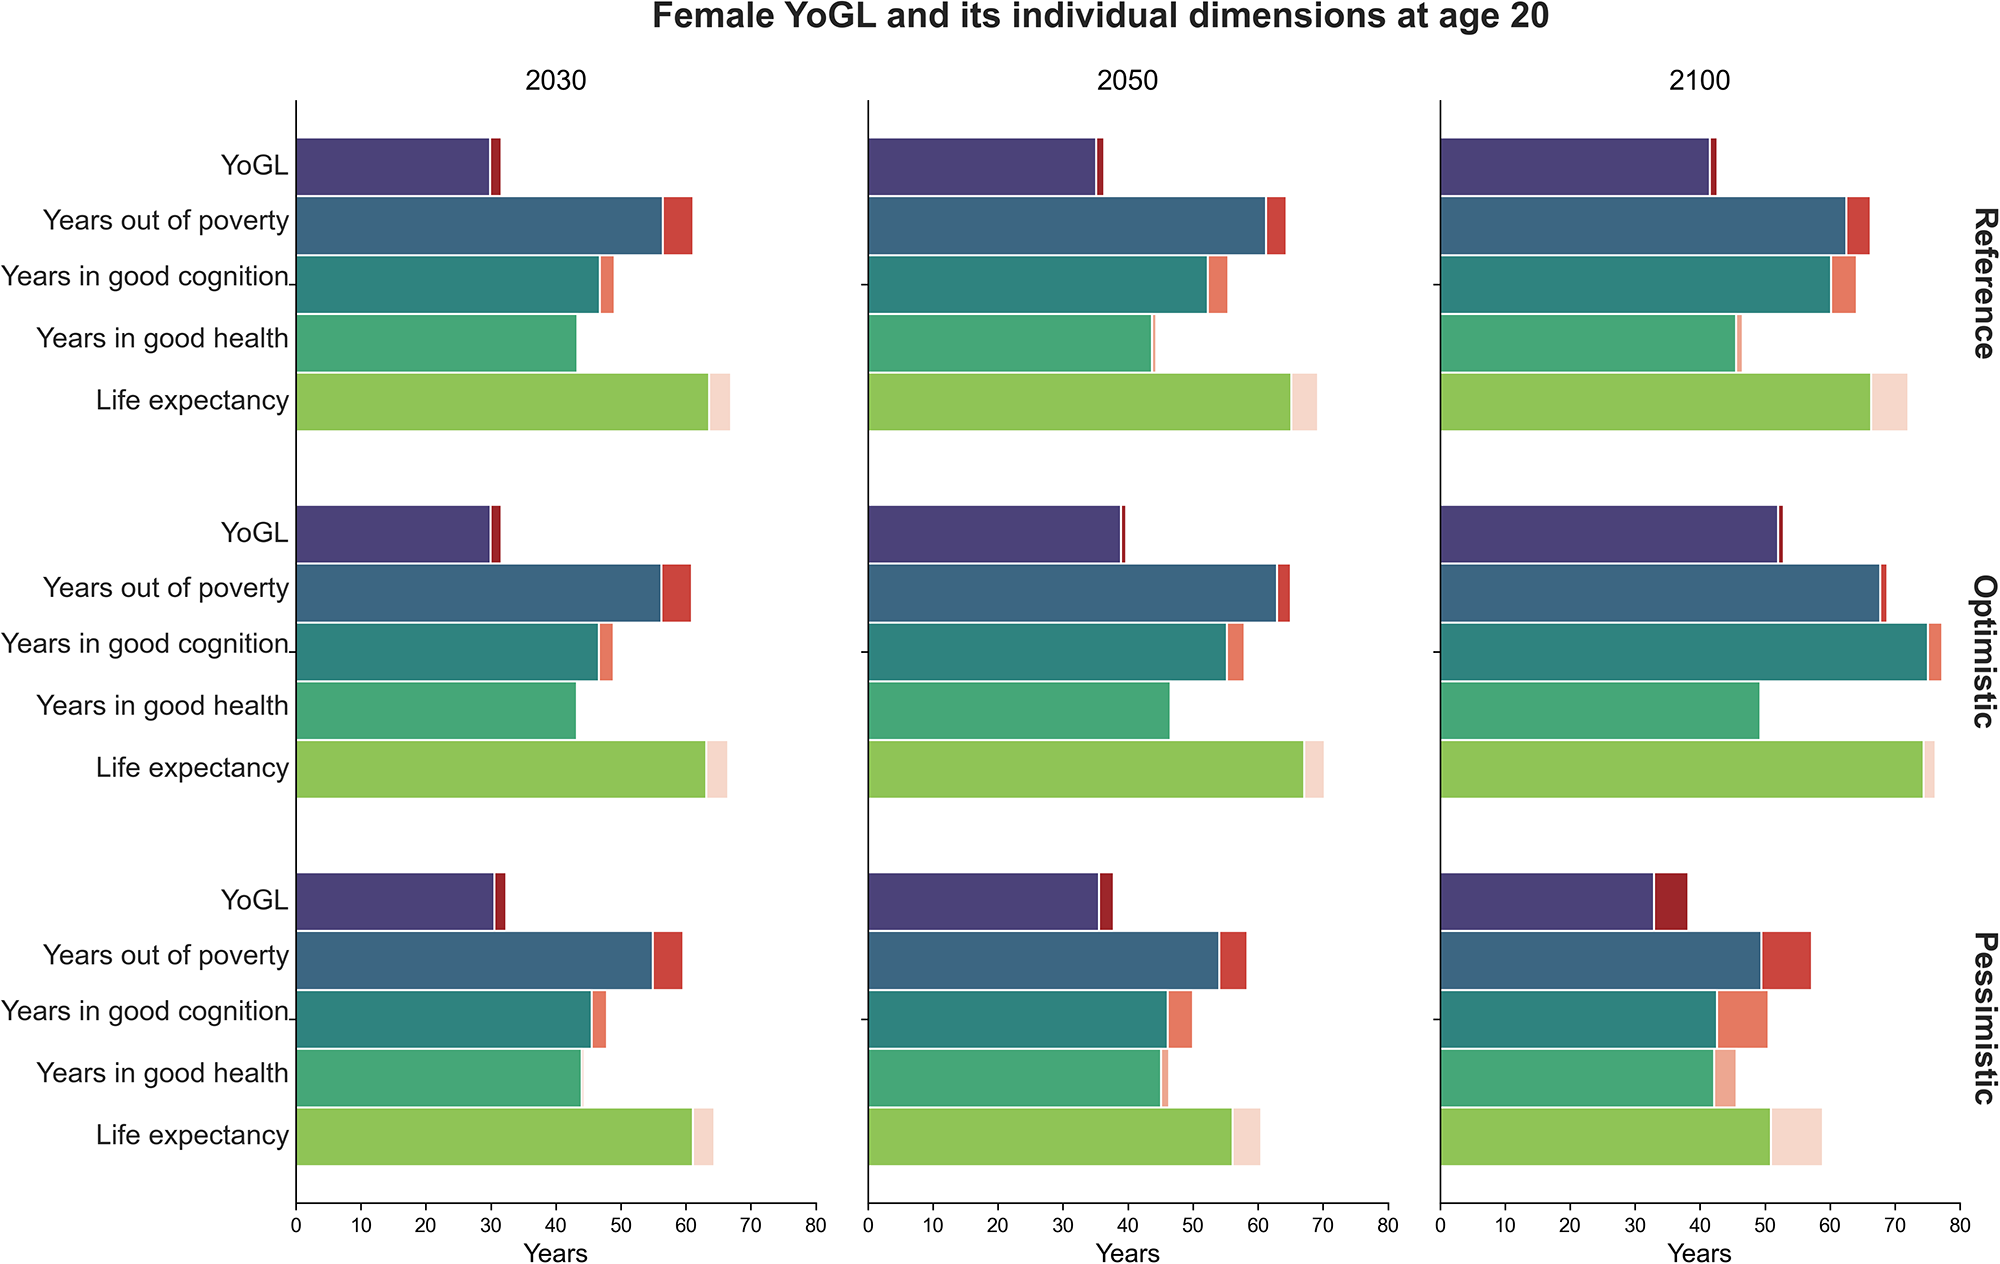
For both 20-year-old males and females, the present-day YoGL values of approximately 25 years are attributed to healthy life expectancy of 45–40 years, poverty rates of 6–15% (Supplementary Figure 2), and our formulation for the prevalence of good life (Equation 2). Figure 3 shows what YoGL would look like for 20-year-old females if it were based on only one of its components. This helps reveal which component limits the YoGL most compared to overall life expectancy. Among the three objective components of YoGL, health is the most limiting one due to the gap between healthy life expectancy and life expectancy, since the years in good health (the fourth bars in Figure 3) are smaller than years in good cognition and years out of poverty across all scenarios. With the poverty line assumption at 2.15 $/day per person, the poverty rate declines almost to zero by the mid-century, hence the years out of poverty are the least restrictive condition on ‘good life’. An exception to this role of poverty is the end of the century in the optimistic scenario, when the years with good cognition become the least restricting ones. This wellbeing-boosting role of education in the optimistic scenario is attributed to not only the predefined assumptions of the scenario, but also to the absence of adverse climate impacts on the economy that impede the growth of educational enrolment rates.

Figure 3. Years of Good Life (YoGL) of 20-year-old females, its three endogenously modeled components, and the overall life expectancy in 2030, 2050 and 2100 in three baseline scenarios. The top bar in each panel shows the Years of Good Life, and the subsequent three bars depict how YoGL would have been if the prevalence of good life was defined based exclusively on poverty, cognition and health, respectively, instead of their intersection. The bottom bar shows the total life expectancy. The Orange-colored bars show the extension to the YoGL if there were no climate impacts on the economy and mortality. Extended Data 1 contains the values underlying this figure.
Figure 3 also depicts the YoGL lost specifically due to climate damages. Even in the optimistic scenario, climate damages lead to a loss of 1.7 in expected good life of 20-year-old females as early as 2030, whereas the loss of their expected life expectancy is 3.3 years. This loss is overcome later in the century as climate action in the optimistic scenario helps avoid the damages, and YoGL conditions improve over time, and the loss of good life, as well as the loss of life expectancy, decline to 0.9 and 1.8 years, respectively. In the pessimistic scenario, however, climate impacts cause a loss of 1.8 YoGL in 2030, which increases to 5.2 years by 2100, due to the adverse impacts on all YoGL components. Climate damages imply 7.7 more years in poverty for 20–24-year-old females, 7.9 fewer years with good cognition, and 3.4 fewer years in good health by 2100.
4. Wellbeing cost of carbon
Projecting YoGL over time enables calculating the marginal effect of carbon emissions on wellbeing, analogous to the social cost of carbon (Greenstone et al., Reference Greenstone, Kopits and Wolverton2013) or the mortality cost of carbon (Bressler, Reference Bressler2021), yet replacing the economic damages or excess mortality by the loss of expected YoGL. Therefore, we calculate the WCC in 2020 for each sex and different generations as the marginal loss of YoGL due to 1 Gton of additional CO2 emitted in 2020, of which wellbeing impacts are accounted for throughout the century (see Section 2).
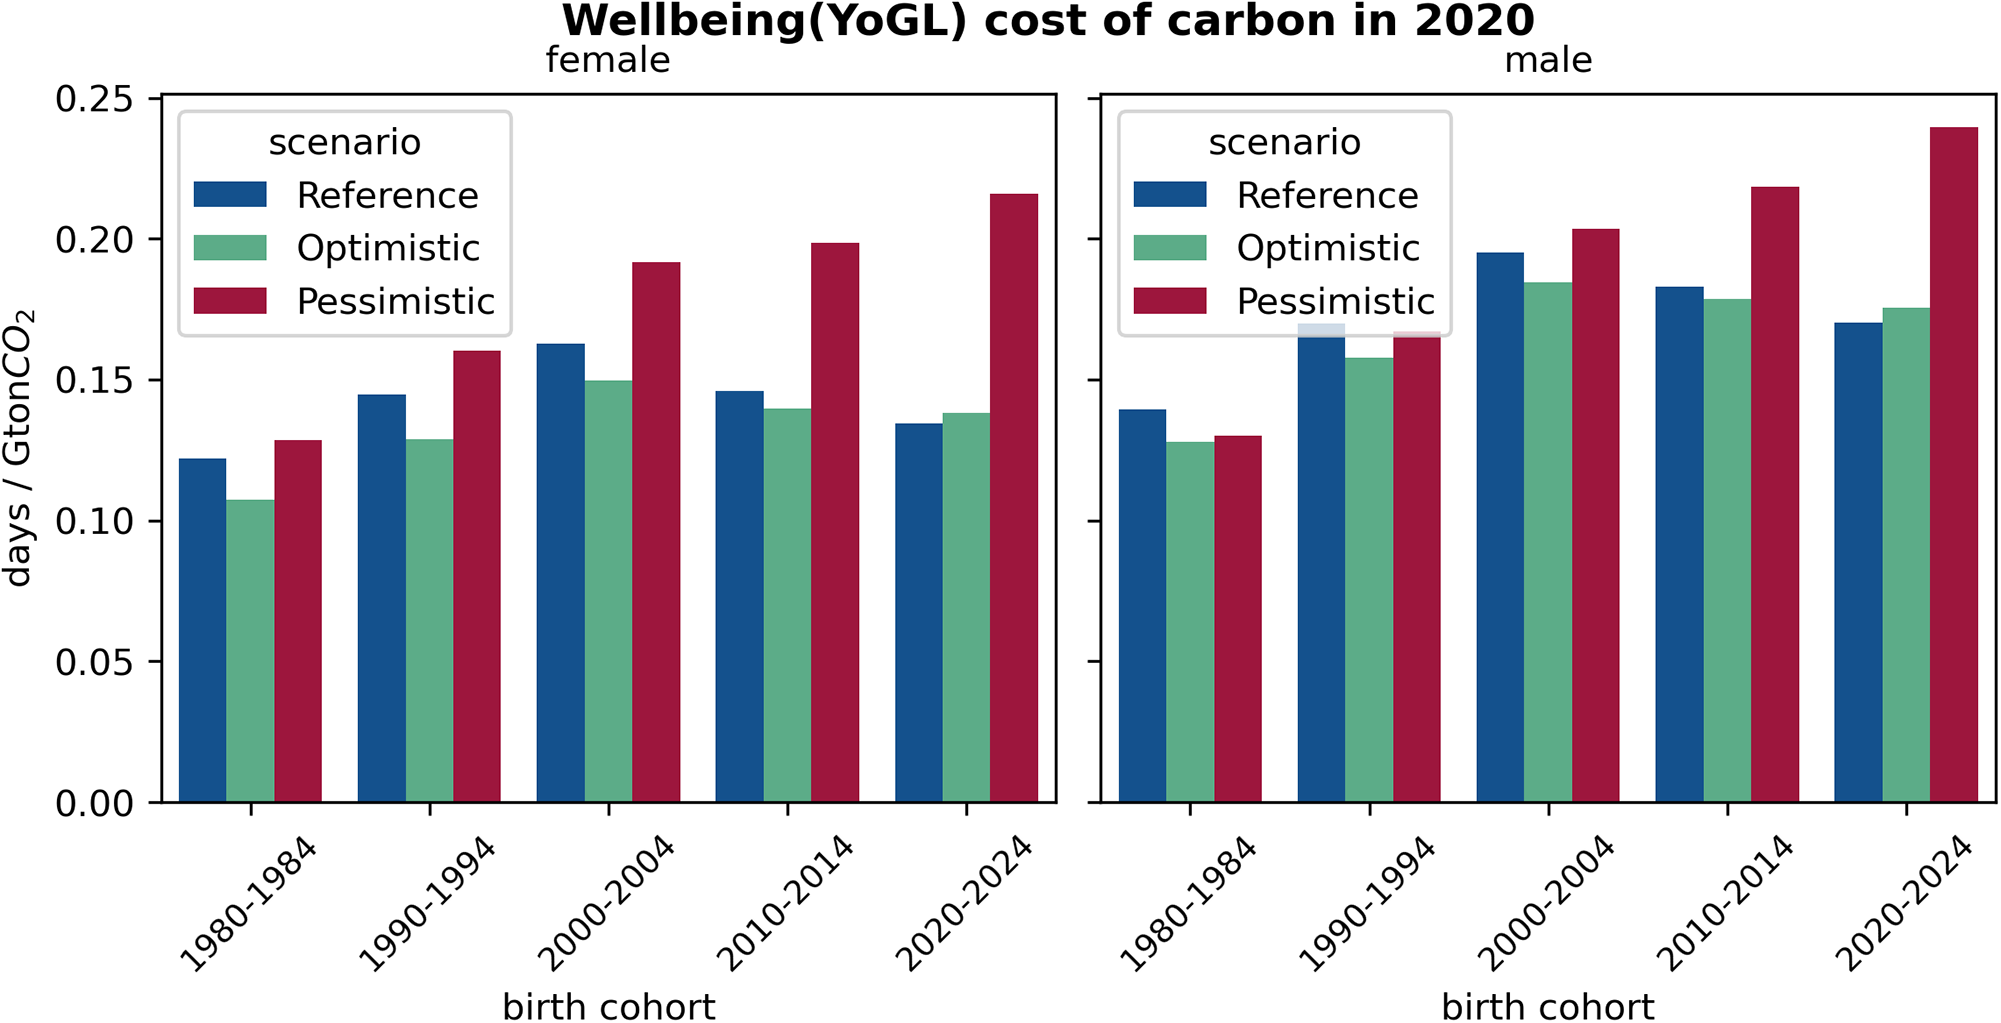
Figure 4 shows the resulting WCC values for various birth cohorts under the three baseline scenarios. In this sense, it differs from the previously shown YoGL projections in terms of the population groups it refers to and in terms of its focus on YoGL loss as a direct response to emission increases. For instance, the average WCC for females born in 2000–2004 in the reference scenario, where the socioeconomic developments and climate action follow the current trends, is 0.16 days, meaning that every Gton of CO2 emitted in 2020 costs an average loss of 0.16 days of good life to a female born in 2000–2004. This can be interpreted as an average loss of 5.6 days of good life by each female born in the early 2000s due to the 35.3 Gtons CO2 of total CO2 emissions in 2020 (Friedlingstein et al., Reference Friedlingstein, O'Sullivan, Jones, Andrew, Gregor, Hauck and Zheng2022). The pessimistic scenario with unmitigated climate change is associated with an 18.7% higher WCC on average for all cohorts as compared to the reference scenario. The WCC is unevenly distributed across cohorts to the disadvantage of the younger generations, such as the 2020–2024 female and male cohorts, who suffer a 60% and 40% higher WCC in the pessimistic case, respectively.

Figure 4. Wellbeing cost of carbon (WCC) in 2020 for the birth cohorts 1980–2020 and in three baseline scenarios. WCC is defined as the mean loss of expected YoGL of an average individual in a cohort due to the lifetime impacts of marginal emissions in a specific year, that is, 2020. Y-axis shows the values of WCC in days per GtonCO2, instead of years per tonCO2.
Intergenerational differences are stark in each scenario. While the youngest generations are most disadvantaged in terms of wellbeing in the pessimistic scenario with unmitigated climate change, people born in 2000–2004 bear the highest WCC in the reference and optimistic scenarios. This is attributed to higher adverse impacts of the marginal 2020 emissions on the health and poverty of the 2000–2004 cohort in comparison to the impacts on younger and older cohorts (Supplementary Figure 13), where younger cohorts also benefit from stronger climate change mitigation in those scenarios in the later decades. For the 2020–2024 cohort, the WCC in the optimistic scenario is slightly higher than the WCC in the reference scenario, even though the absolute YoGL values driven by healthy life expectancy, educational attainment and poverty rates are better in the optimistic scenario. This is due to the differential impact of marginal emissions, as shown by the higher health and education costs of 1 Gton of CO2 for this cohort in the optimistic scenario compared to the reference case (Supplementary Figure 13).
Across the cohorts and scenarios, males tend to experience a higher WCC than females. For instance, in the optimistic scenario, males born in 2010–2014 lose 0.18 days of good life due to marginal emissions in 2020, which is almost 28% more than the WCC for females of the same cohort. This gender difference is attributed to the worse relative health and poverty impacts of the marginal emission on males (Supplementary Figure 13). Since males have lower poverty rates than females in general (Supplementary Figure 2), the relative increase in poverty in the emission shock case is higher on average for males than for females, whereas the health and education impacts are slightly worse for females (Supplementary Figure 14).
5. Discussion
In this study, we explore future human wellbeing based on YoGL as a composite wellbeing metric composed of longevity (life expectancy), poverty rates, healthy life expectancy, educational attainment rates, and subjective life satisfaction. We explicitly consider the dynamic feedbacks between climate, economy, and society. The resulting model-based projections show that YoGL of any age group and sex is expected to increase over time under the current socioeconomic and climate trends. Our results highlight the heterogeneity of human wellbeing, with younger females having less YoGL than their male counterparts due to higher poverty and lower educational attainment rates, despite their higher healthy life expectancy and subjective life satisfaction than males.
A key finding of our study is the stark difference in wellbeing outcomes of different socioeconomic scenarios with different climate action narratives. In an optimistic scenario where the human population peaks in mid-century and then declines, human longevity extends over 90 years, economic output exceeds 65,000 USD per person, and global warming is kept below 1.8°C throughout the century, all generations and both sexes benefit from improved wellbeing. For instance, the 20-year-old females and males gain 10.4 and 7.5 extra YoGL on average by 2100 compared to the reference scenario. In a pessimistic scenario where the population keeps rising, and the global temperature rise reaches 4°C, however, humans across all generations and sexes suffer significant wellbeing losses due to strong climate impacts on economy and longevity, and their cascading effects on wider wellbeing components. For instance, the 20-year-old females and males lose 8.5 and 11.3 YoGL on average by 2100 compared to the reference scenario. This finding highlights the cruciality of strong climate action not only to achieve the climate targets but also to improve human wellbeing.
This study also introduces the WCC, which is calculated as wellbeing loss due to marginal CO2 emissions in a specific year, analogously to the popular social cost of carbon metric used in climate policy-making, which encapsulates the loss of economic output only. Aligned with the ongoing discourses that acknowledge the multidimensionality of human wellbeing beyond economic output, WCC provides a more comprehensive alternative to the social cost of carbon. WCC encapsulates the climate impacts on the average wellbeing of population subgroups, facilitates an intuitive understanding of what an individual might lose due to climate change, and showcases intergenerational and gender differences. Therefore, it provides a direct input to climate justice discussions. As our study was at the global level for different sex and age groups, future work can extend the WCC to different subpopulations, for example, for different countries or regions, to inform and enhance the justice debates.
The model underlying the wellbeing projections presented in this study is unavoidably subject to several assumptions described in Section 2 that create the uncertainty ranges depicted in Figure 2. Our baseline scenarios result in the lower end of the uncertainty range of the GDP projections, and the subsequent climate and wellbeing projections deviate from the mean values of their uncertainty ranges. This asymmetry is attributed to the damage function we used that defines the GDP-temperature relationship, which is based on global empirical estimates (Burke et al., Reference Burke, Hsiang and Miguel2015), yet the worst case of those that lead to approximately 75% of GDP loss at 5°C of warming. Our choice of this strong damage function in the baseline was motivated by the high uncertainty of damage estimates in the literature, which bears the possibility of even worse climate impacts.
Another important modeling choice is the formulation of YoGL as a multiplication of prevalence rates of each good life component (health, poverty, cognition, subjective satisfaction). This choice was motivated by the requirements of top-down modeling and reluctance to overestimate YoGL, and it resulted in pessimistic outcomes compared to empirical YoGL estimates based on individual characteristics. Therefore, it must be kept in mind that, while the relative values in different scenarios are informative, the absolute YoGL values presented in this study might be lower than they would actually be. In future studies, alternative modeling approaches that focus on smaller population subgroups or individuals can better take the dependency of YoGL components into account.
While the multiplicative YoGL formulation may underestimate the number of good life years, the poverty line employed in this study – $2.15 per person per day – is a conservative threshold that may lead to an overestimation of life years spent out of poverty. This poverty line corresponds to the global benchmark set by the World Bank at the time of the study and is consistent with the original definition of YoGL. Accordingly, our model-based analysis adheres to this standard. Nevertheless, future research could extend this analysis using alternative, higher poverty thresholds that better reflect current economic conditions, potentially differentiated by country income levels.
Human wellbeing is unequivocally a multidimensional, complex concept, yet it is often treated with metrics that fall short of capturing this complexity. For instance, the carbon intensity of wellbeing takes only ‘life expectancy’ into account (Jorgenson, Reference Jorgenson2014), while the Human Development Index (UNDP, 2022) aggregates longevity, educational attainment and economic output at the national level, results in a value that has no intuitive real-life meaning and often is not differentiated by sex and age cohort in most studies that use and report it. The wellbeing index of the Earth4All model captures the impact of broader social progress on wellbeing, yet lacks an empirical grounding (Randers & Collste, Reference Randers and Collste2023). In this study, we used YoGL as an empirically grounded and intuitive metric that encapsulates subjective and objective dimensions of human wellbeing. As a composite metric, YoGL and the associated WCC enable a thorough comparison of different public, private or civil society efforts in terms of their future impacts on wellbeing. These two metrics address a key knowledge gap identified in the latest IPCC report for a better metric to measure climate and climate action impacts on wellbeing (Creutzig et al., Reference Creutzig, Roy, Devine-Wright, Díaz-José, Geels, Grubler, Maïzi, Masanet, Mulugetta, Onyige, Perkins, Sanches-Pereira, Weber, Shukla, Slade, Al Khourdajie, van Diemen, McCollum, Pathak, Some, Vyas, Fradera, Belkacemi, Hasija, Lisboa, Luz and Malley2022). They might however hinder an explicit presentation of the trade-offs between wellbeing components, hence require communication of the results carefully especially to audiences who might prioritize one of the components. Furthermore, some wellbeing components, such as cognitive ability, might require different measurements than literacy rates or educational attainment. Defining alternative operational metrics of cognitive ability, and creating new nationally representative datasets of these metrics can support future wellbeing research.
While YoGL captures wellbeing as a multidimensional concept, GDP per capita remains a key explanatory variable for several wellbeing components in this study, including poverty rates and school enrolment. This is consistent with the broader literature, which shows that GDP per capita – as a proxy for average individual income and government spending capacity – is a significant determinant of (healthy) life expectancy, educational attainment, and poverty reduction. Still, this study does not assume a linear relationship between GDP and wellbeing drivers. Instead, as described in the detailed model documentation (Eker et al., Reference Eker, Liu, Reiter and Kuhn2023) most modeled relationships are non-linear, following a saturating pattern, where the marginal gains in wellbeing outcomes diminish at higher levels of GDP. These non-linear relationships we modeled based on global datasets are consistent with other findings, for instance those showing that economic growth beyond moderate affluence is associated with lower need satisfaction (Vogel et al., Reference Vogel, Steinberger, O'Neill, Lamb and Krishnakumar2021).
Furthermore, YoGL's original conception and its representation in this modeling study might still be expanded for a broader wellbeing definition. For instance, the global poverty line falls short of capturing material sufficiency needs. Alternative metrics, such as Decent Living Standards (Rao & Min, Reference Rao and Min2018) that explicitly account for food, energy and material needs, can be embedded in the YoGL definition to arrive at a more differentiated representation of the material aspect of human wellbeing.
Supplementary material
The supplementary material for this article can be found at https://doi.org/10.1017/sus.2025.10042.
Acknowledgements
The authors are thankful to Warren Sanderson, Alexia Fürnkranz-Prskawetz and Shonali Pachauri for valuable discussions.
Author contributions
All authors contributed to the design of the study. S.E. and Q.L. did the modeling and analysis, C.R. collected and analyzed the historical data. S.E. drafted the manuscript. All authors contributed to writing the final version of the manuscript.
Funding statement
The authors gratefully acknowledge funding from the European Research Council for the research project ‘The Demography of Sustainable Human Wellbeing’ (ERC-2016-ADG, Grant agreement ID 741,105), and from the European Union's Horizon Europe research and innovation programs under grant agreement no. 101,081,661 (WorldTrans).
Conflict of interest
The authors declare no conflict of interest.
Data and code availability
FeliX, the simulation model used in this study, is available at https://github.com/iiasa/Felix-Model, with an extended documentation at https://iiasa.github.io/felix_docs/.


 Open access