


Introduction
The ultra-high risk for psychosis (UHR) criteria have been developed to identify youth at increased risk of developing psychosis, enabling the provision of preventive treatments [Reference Nelson and McGorry1–Reference Yung, McGorry, McFarlane, Jackson, Patton and Rakkar3]. The UHR criteria focus on a combination of trait and state risk factors, with most cases exhibiting attenuated positive symptoms (e.g., unusual thought content and perceptual abnormalities) [Reference Fusar-Poli, Salazar de Pablo, Correll, Meyer-Lindenberg, Millan and Borgwardt4, Reference Yung, Yung, Pan Yuen, Mcgorry, Phillips and Kelly5].
The most important outcome in the field is the transition to psychosis [Reference Fusar-Poli, Davies, Solmi, Brondino, De Micheli and Kotlicka-Antczak6], marking the point at which an individual has developed a full threshold or frank psychosis [Reference Fusar-Poli, Salazar de Pablo, Correll, Meyer-Lindenberg, Millan and Borgwardt4]. Research on differences between UHR youth who later develop psychosis and those who do not, focusing on factors associated with transition, is crucial to informing preventive care. While several studies have examined the prognostic value of the severity of symptoms [Reference Oliver, Reilly, Boy, Petros, Davies and Borgwardt7, Reference Nelson, Yuen, Wood, Lin, Spiliotacopoulos and Bruxner8], growing international consensus emphasizes the need to refine prognostic models. To forecast psychosis onset, prediction models have been developed [Reference Fusar-Poli, Salazar de Pablo, Correll, Meyer-Lindenberg, Millan and Borgwardt4, Reference Wannan, Nelson, Addington, Allott, Anticevic and Arango9, Reference Bonnett, Hunt, Flores, Tudur Smith, Varese and Byrne10]; however, they have shown limited application in real-world clinical settings to date due to implementation gaps [Reference Salazar de Pablo, Studerus, Vaquerizo-Serrano, Irving, Catalan and Oliver11], suggesting the importance of novel, complementary approaches. An unexplored research area is whether focusing on the relationships among symptoms could differentiate youth who will develop psychosis from those who will not. Understanding symptom interconnections, beyond symptoms’ prevalence and/or severity alone, may hold a prognostic value and inform preventive strategies.
A promising approach to exploring the interconnections between symptoms is network analysis, which posits that symptoms should not be viewed as passive manifestations of a latent variable. Instead, symptoms are deemed to actively cause and reinforce each other within a complex system, driving the system toward an alternative, disordered stable state of prolonged symptom activation – what we recognize as “mental disorders” [Reference Borsboom12]. Symptom interactions can be visualized as a network, where some connections are stronger than others. Highly interconnected symptoms are considered important in sustaining and spreading psychopathology (centrality hypothesis) [Reference Robinaugh, Hoekstra, Toner and Borsboom13]. Network analysis represents a promising approach for framing diagnosis (i.e., identifying the interactions that sustain symptoms) and intervention (i.e., manipulating or modifying the interconnections between symptoms) [Reference Borsboom12]. Notably, within this approach, symptoms are understood as interconnected and interdependent, rather than isolated risk factors independently associated with transition.
Compared to more traditional approaches, network analysis may provide new perspectives on baseline differences between individuals who will transition and those who will not, potentially improving the detection of signs of a subsequent transition. For example, network analysis could clarify whether these groups differ in the pattern of associations between symptoms and how densely or strongly symptoms are connected [Reference van Borkulo, van Bork, Boschloo, Kossakowski, Tio and Schoevers14]. At a more granular level, such an exploratory approach may suggest whether certain connections or symptoms have distinct roles within networks, potentially differing between groups. Moreover, understanding how symptoms are interconnected has the potential to identify symptoms that may need clinical attention and inform future studies.
Applying network analysis for this purpose shows promise, as it has differentiated clinical populations in previous studies, such as youth with a psychosis-risk state from clinical controls [Reference Boldrini, Lo Buglio, Cerasti, Pontillo, Muzi and Salcuni15], and individuals with first-episode psychosis at baseline compared to 1-year follow-up [Reference Griffiths, Leighton, Mallikarjun, Blake, Everard and Jones16]. Previous studies using network analysis in the field [Reference Boldrini, Lo Buglio, Cerasti, Pontillo, Muzi and Salcuni15, Reference Ong, Isvoranu, Schirmbeck, McGuire, Valmaggia and Kempton17–Reference Lo Buglio, Pontillo, Cerasti, Polari, Schiano Lomoriello and Vicari21] had reasonably modest sample sizes and did not compare symptom networks between individuals who later transitioned to psychosis and those who did not. Based on this background and utilizing data from the largest cohort with long-term follow-up in the field to date, this study aims to compare the baseline network structures of baseline symptoms in UHR individuals who transitioned to psychosis and those who did not within three years.
Methods
Participants and procedure
The UHR1000+ cohort comprised UHR youth who participated in studies conducted at Orygen, Melbourne, from 1995 to 2021 (Supplementary Table S1).
Given the wide variation in follow-up, which extended until 16.7 years, we established a three-year cut-off for transition. This cut-off was informed by a large-scale systematic review of psychosis prevention services, which explicitly recommends monitoring outcomes for at least three years, based on evidence that transition risk and clinical needs may extend beyond shorter-term follow-up periods [Reference Salazar de Pablo, Estradé, Cutroni, Andlauer and Fusar-Poli22]. Accordingly, we excluded youth who did not transition with less than three years of follow-up. Furthermore, UHR youth who developed psychosis after three years were categorized as having not transitioned to psychosis within three years in the main analysis and excluded from a sensitivity analysis (see “Network estimation”).
Participants were included if: a) they presented with a UHR state at baseline, and b) later developed psychosis or they were known to have not transitioned for at least three years. Exclusion criteria were: a) cases with missing follow-up date or missing symptom data to the extent that they could not be included in any correlation, b) a current or past psychotic disorder or manic episode; c) prior exposure to antipsychotic medication, with a total continuous haloperidol-equivalent dose exceeding 15–50 mg, depending on the original study; d) substance-induced psychotic disorder; e) a known medical condition that could explain symptoms; f) a diagnosis of a severe developmental disorder; g) a documented history of developmental delay or intellectual disability (IQ < 70); and h) inadequate English language proficiency for participants recruited in Australia.
Informed consent was obtained from all participants, as the studies included in the dataset were approved by the relevant local ethics committees. The authors assert that all procedures comply with the ethical standards of the relevant national and institutional committees on human research.
Measures
UHR inclusion criteria were: trait and state risk factors (i.e., schizotypal disorder or a first-degree relative with a psychotic disorder plus functional decline or chronic low functioning), attenuated positive psychotic symptoms (APS) (i.e., attenuated positive symptoms), and brief limited intermittent psychotic symptoms (BLIPS) (i.e., short-lived psychotic episodes, remitting spontaneously within seven days). From 1999, functional decline or chronic low functioning was required for all UHR groups. From 1995 to 1996, UHR state was assessed using a combination of the Brief Psychiatric Rating Scale (BPRS) [Reference Overall and Gorham23], the Comprehensive Assessment of Symptoms and History (CASH) [Reference Andreasen, Flaum and Arndt24], and the Global Assessment of Functioning (GAF) [25]. Between 1996 and 1999, the Comprehensive Assessment of At-Risk Mental States (CAARMS) [Reference Yung, Yung, Pan Yuen, Mcgorry, Phillips and Kelly5] was used alongside the GAF. From 1999, the CAARMS, in conjunction with the Social and Occupational Functioning Assessment Scale [Reference Goldman, Skodol and Lave26] was employed.
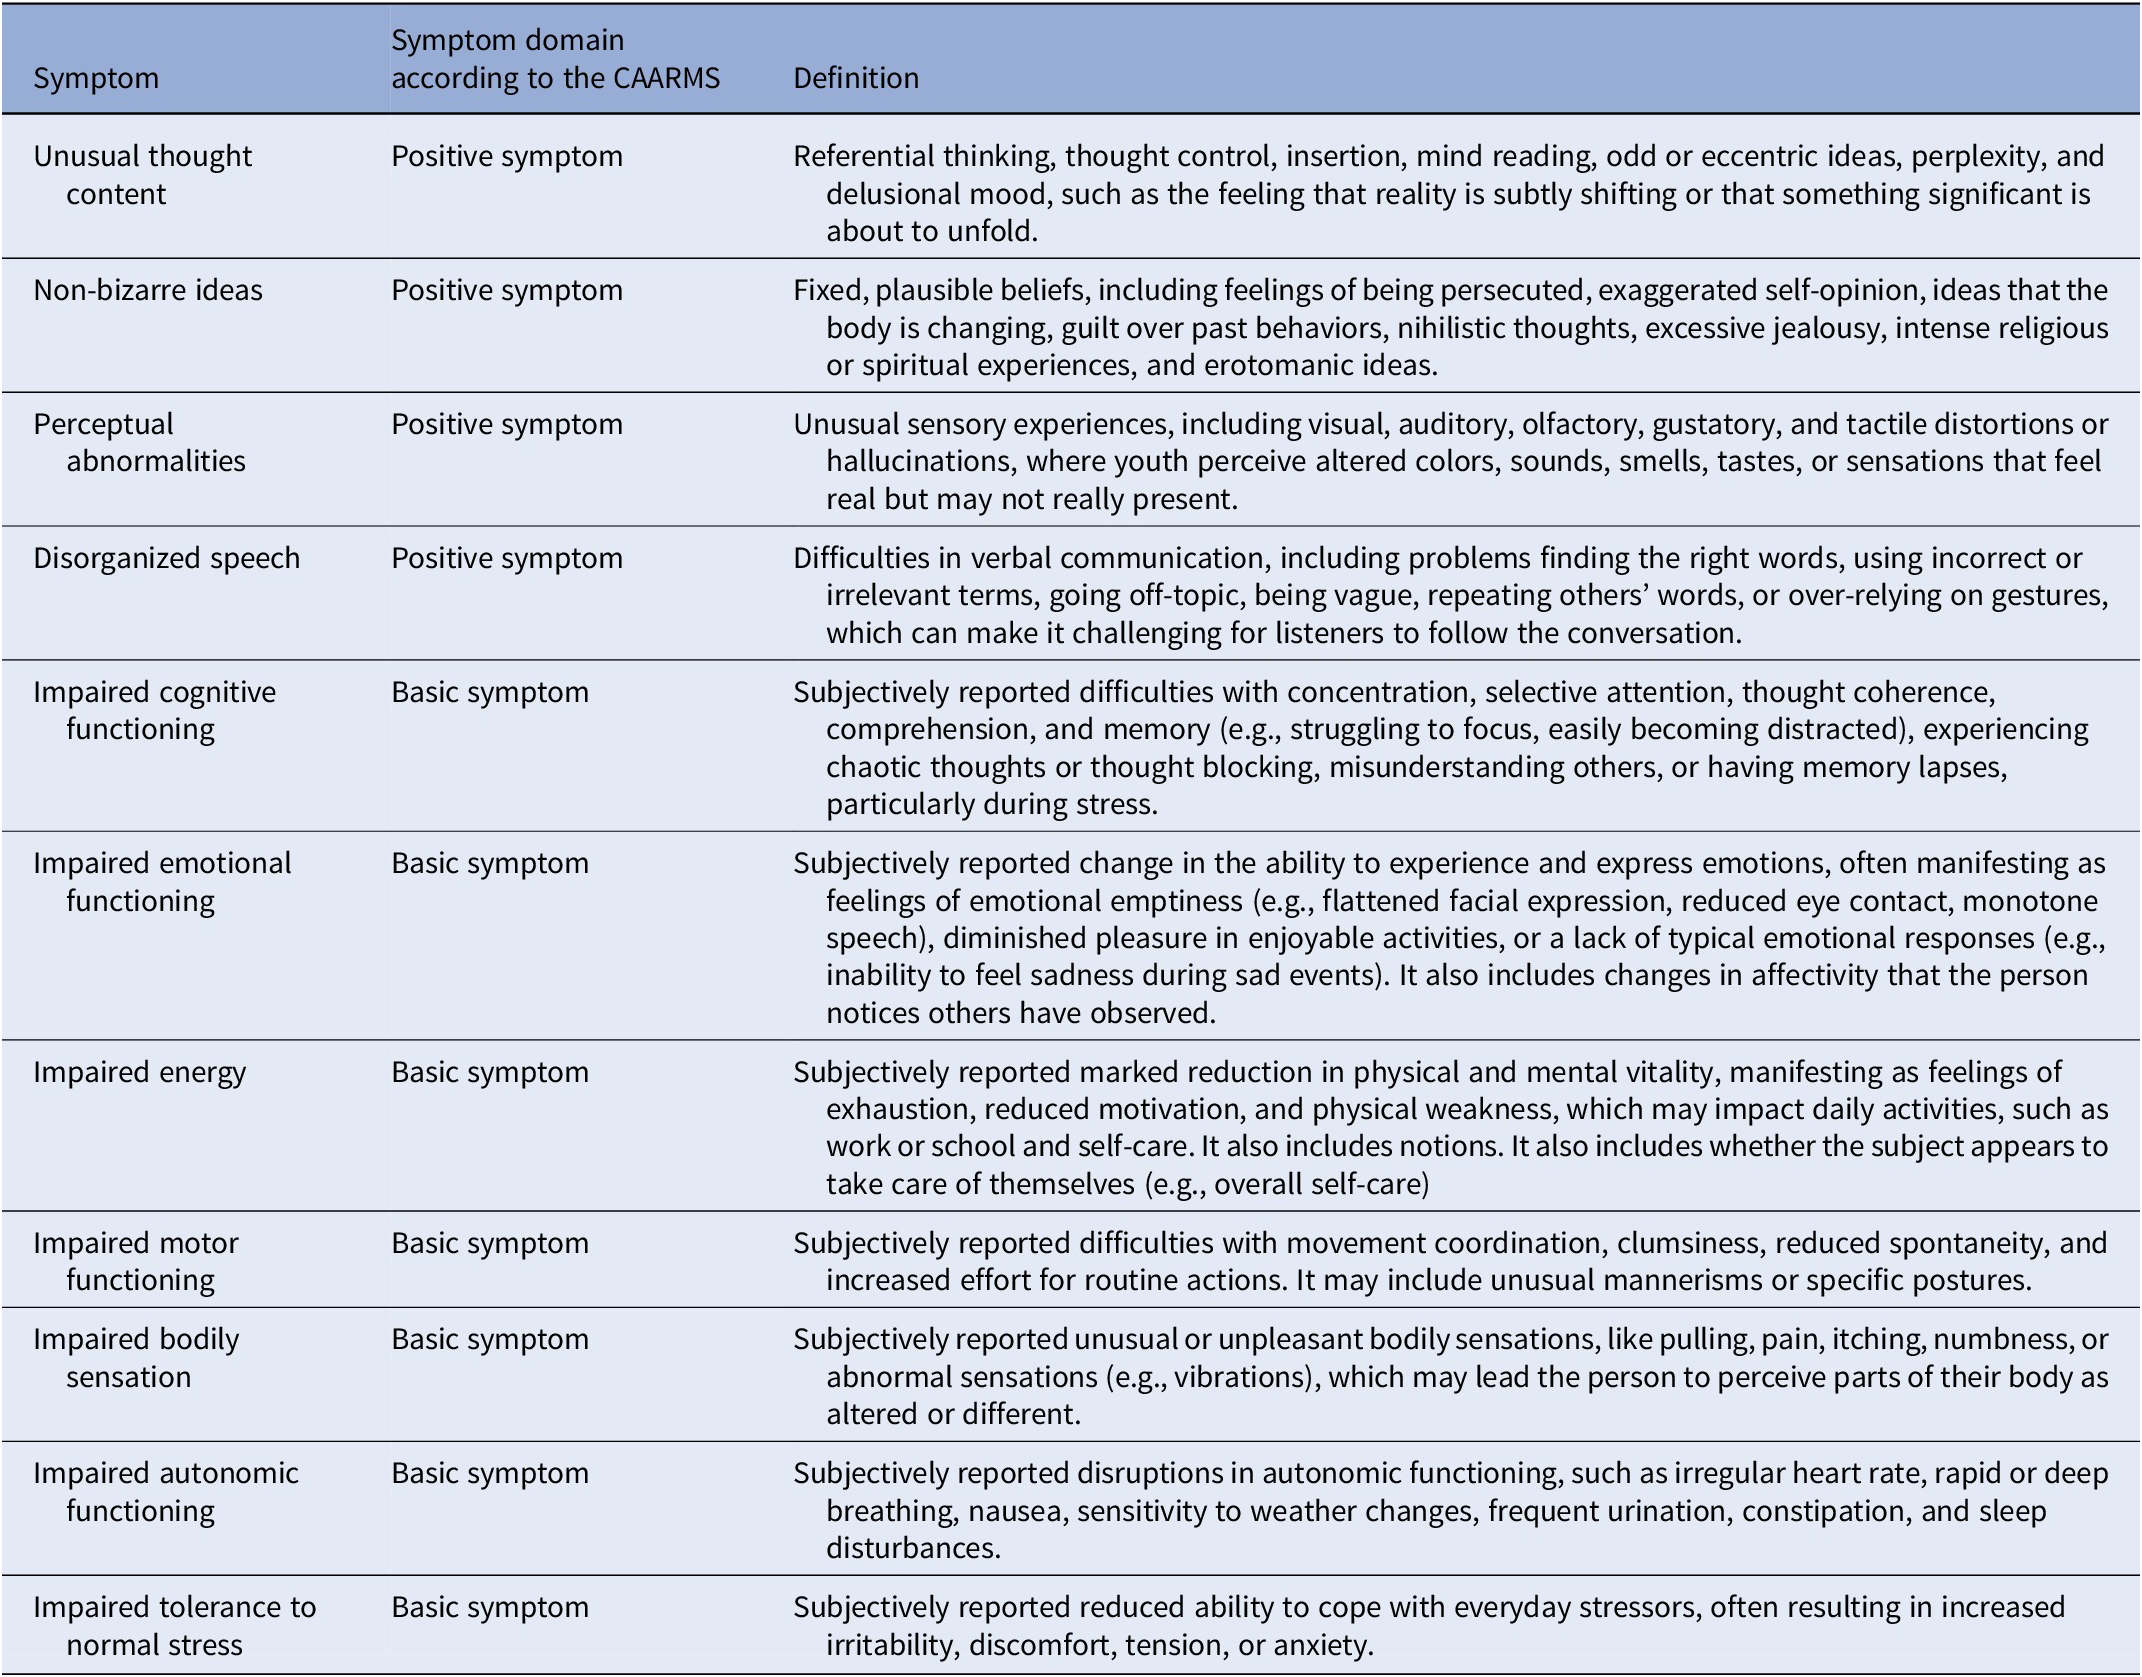
Symptoms were assessed using different CAARMS versions. Due to their clinical relevance, complementary sets of clinical manifestations, and prognostic value [Reference Yung, Yung, Pan Yuen, Mcgorry, Phillips and Kelly5, Reference Schultze-Lutter, Michel, Schmidt, Schimmelmann, Maric and Salokangas27, Reference Youn, Phillips, Amminger, Berger, Chen and de Haan28], we selected baseline severity scores of positive symptoms (e.g., unusual thought content and perceptual abnormalities) and a range of psychopathology defined as basic symptoms in the CAARMS (e.g., subtle alterations of thoughts, behaviors, bodily perceptions, and affects [Reference Schultze-Lutter and Theodoridou29]) described in Table 1. The harmonization process of the CAARMS items across different versions is described in Supplementary Table S2. The conversion procedure was derived from consensus among clinical experts in administering the CAARMS, optimizing comparability across different instrument versions. Harmonized CAARMS scores were used in previous publications [Reference Nelson, Yuen, Wood, Lin, Spiliotacopoulos and Bruxner8, Reference Hartmann, Dwyer, Cavve, Byrne, Scott and Gao30, Reference Hartmann, Dwyer, Scott, Wannan, Nguyen and Lin31].
Table 1. Description of symptoms considered in this study (edited and adapted from [Reference Yung, Yung, Pan Yuen, Mcgorry, Phillips and Kelly5, Reference Pelizza, Paterlini, Azzali, Garlassi, Scazza and Pupo56])

Regarding transition to psychosis, before 1999, it was identified using the BPRS/CASH and CAARMS. Since 1999, the CAARMS replaced the BPRS/CASH. In cases where CAARMS data were not available, public mental health records were reviewed.
Statistical analyses
Group comparison
To compare baseline characteristics of UHR youth who developed psychosis with those who did not, continuous variables were analyzed using the Mann–Whitney U test due to deviations from normal distribution. Categorical variables were examined with the chi-square test, using Monte Carlo simulation (10,000 replicates) for cases with low expected frequencies. To maintain consistency with the approach used for comparing nodes/edges between networks (see “Network estimation”), symptoms’ p-values were adjusted using the Bonferroni correction. Youth who transitioned after three years were classified as not developing psychosis within the pre-defined three-year cut-off (main analysis) and were excluded in a secondary analysis.
Network estimation
To avoid overlapping items, we used the goldbricker function of the networktools package [Reference Jones32], which identifies items that share similar relationships. The network structures were estimated using a Gaussian graphical model (GGM), which takes partial correlations as input, constructing the network by identifying pairwise statistical relationships (edges) between variables (nodes). An edge between two nodes indicates conditional dependence, with the edge weight reflecting the strength of this dependence. To estimate the network structures, the ggmModSelect algorithm, which has proven effective in consistently replicating individual edges [Reference Isvoranu and Epskamp33], was employed. The algorithm generates multiple network structures by varying the LASSO tuning parameter. Then, the selected network is re-estimated using maximum likelihood estimation, optimizing a model selection criterion. Tuning was set to 0, corresponding to the Bayesian Information Criterion (BIC). Finally, the network is refined by iteratively adding or removing edges in a stepwise manner until the BIC criterion is optimized [Reference Isvoranu and Epskamp33, Reference Blanken, Isvoranu and Epskamp34]. To account for non-normal distribution, we used Spearman correlations [Reference Isvoranu and Epskamp33]. Missing data were handled with pairwise deletion [Reference Burger, Isvoranu, Lunansky, Haslbeck, Epskamp and Hoekstra35], in line with previous research [Reference Ong, Isvoranu, Schirmbeck, McGuire, Valmaggia and Kempton17].
For the main analysis, two network structures were built: (i) youth who transitioned within three years (ii) youth who did not transition within three years (including those who transitioned after three years). All symptoms in the networks were included if they had less than 5% of missing data. We assessed the centrality metric “strength,” which is the sum of the absolute values of all connection weights connected to a given node [Reference Epskamp, Borsboom and Fried36], reflecting the relative importance of nodes within the network. To compare the edges and centrality of nodes in each network structure, the edge weight difference test and the centrality difference test were performed, respectively.
To evaluate the stability of the networks, the accuracy of edge weights and the stability of centrality indices were assessed via bootstrap (Nboots = 2500). The correlation stability coefficient (CS) was examined, which indicates the maximum proportion of the sample that can be removed while maintaining a correlation of at least 0.7 between recalculated indices and those from the full sample. CS values above .25, .50, and .70 correspond to acceptable, good, and excellent stability, respectively [Reference Epskamp, Borsboom and Fried36]. The Network Comparison Test was used to compare the two network structures (youth who transitioned versus did not transition) in network structure, global strength (i.e., level of connectivity), and node strength [Reference van Borkulo, van Bork, Boschloo, Kossakowski, Tio and Schoevers14]. In line with previous research [Reference Isvoranu, Ziermans, Schirmbeck, Borsboom, Geurts and de Haan37], we presented edge weight differences only if differences in network structure and/or global strength were significant, and applied Bonferroni correction.
To test the robustness of our findings, we conducted sensitivity analyses. First, youth who developed psychosis after three years were excluded from the analysis (in contrast to the main analysis, in which they were part of the group that did not develop psychosis within our pre-defined three-year cut-off, as they transitioned later) and performed the Network Comparison Test. Second, we incorporated items with more than 5% of missing data into the main networks, performing the Network Comparison Test. Third, as sample size can affect network structures [Reference Isvoranu and Epskamp33], a matched sub-sample of youth who did not transition, equal in size to the transitioned group, was generated. The groups were matched on age, sex assigned at birth, UHR inclusion criteria, and intervention provision (i.e., experimental versus placebo/enrollment in a cohort study), as they may influence baseline symptoms or transition [Reference Fusar-Poli, Salazar de Pablo, Correll, Meyer-Lindenberg, Millan and Borgwardt4, Reference Schimmelmann, Michel, Martz-Irngartinger, Linder and Schultze-Lutter38–Reference Armando, Klauser, Anagnostopoulos, Hebebrand, Moreno and Revet40]. Then, this newly generated network structure was compared with that of youth who transitioned (main analysis) using the Network Comparison Test. Finally, to examine the impact of using different CAARMS versions, we estimated separate networks including transitioned and non-transitioned groups assessed using CAARMS versions with different scores (i.e., non-harmonized 0–4 and 0–6 scores were incorporated in separate networks).
Significance was set at p < .05. Analyses were performed using R version 4.3.1 [41] using the bootnet [Reference Epskamp, Borsboom and Fried36], qgraph [Reference Epskamp, Cramer, Waldorp, Schmittmann and Borsboom42], and NetworkComparisonTest [Reference van Borkulo, van Bork, Boschloo, Kossakowski, Tio and Schoevers14] packages.
Results
Sample characteristics
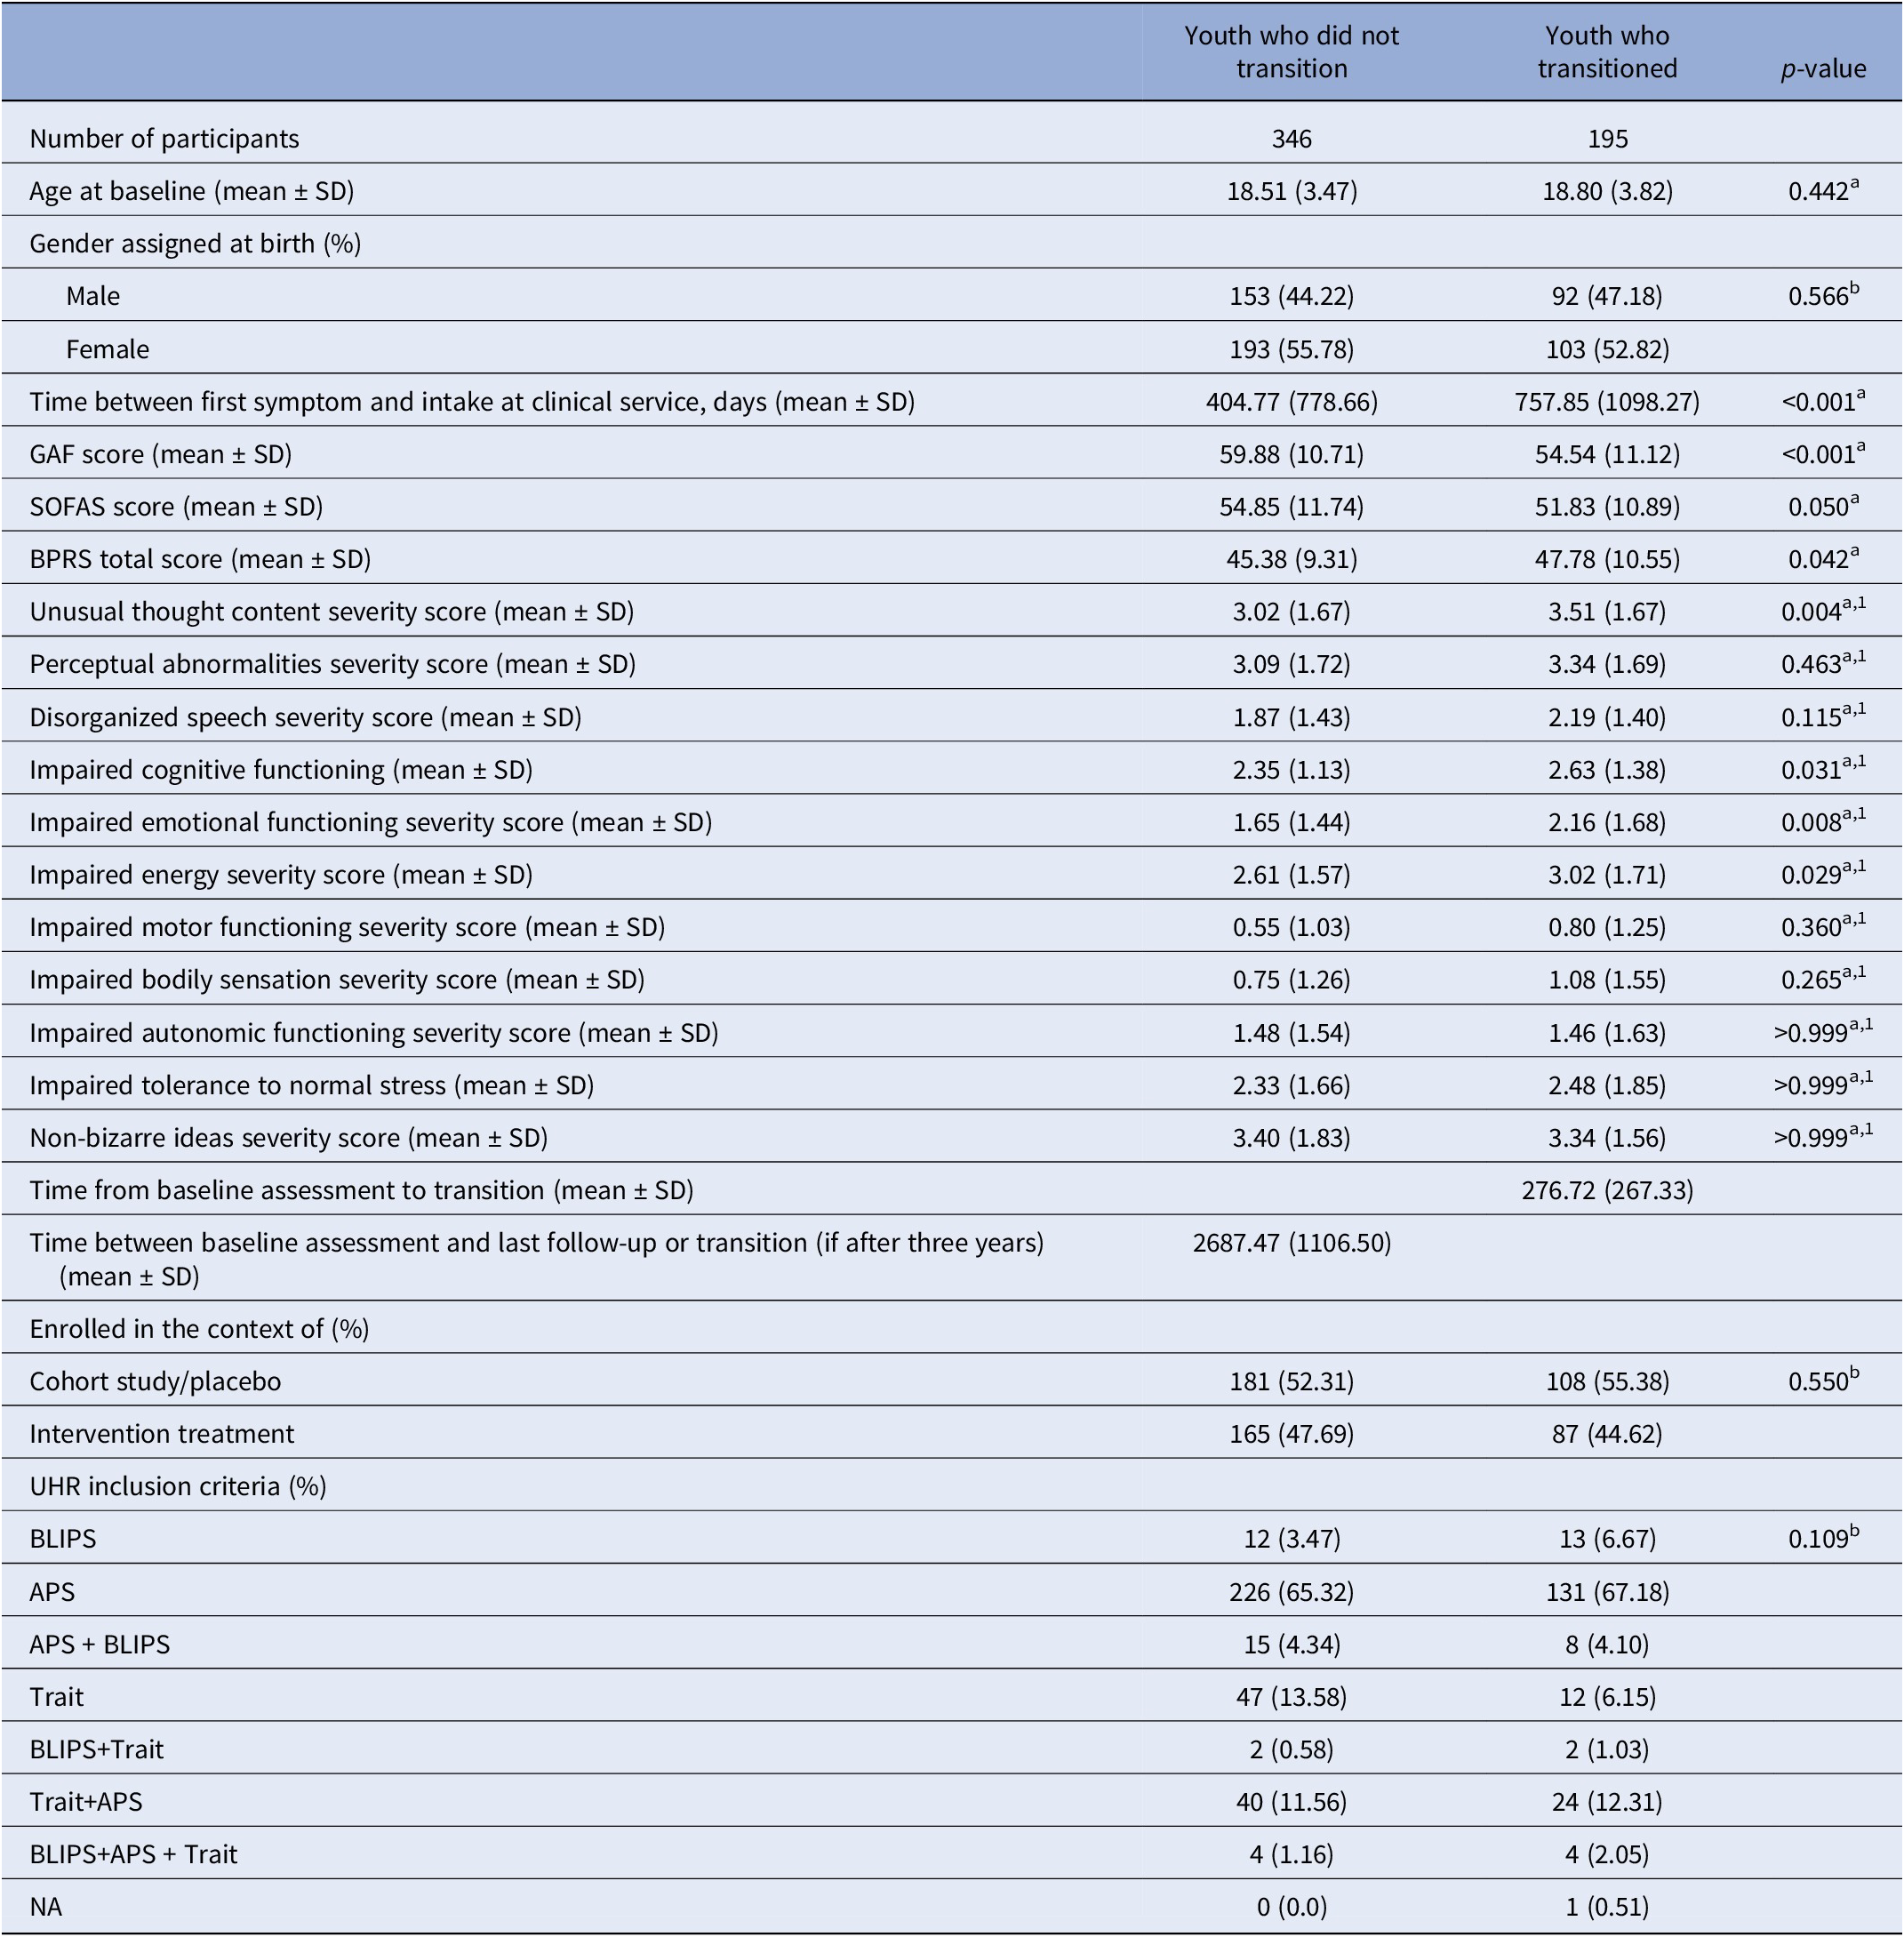
Among the 1,242 UHR youth assessed for inclusion, 698 were excluded as they did not transition, and it was not known if they remained non-psychotic for at least three years. Three youth who transitioned were also excluded: two due to missing transition date and one due to missing data that prevented inclusion in any correlation. 541 youth were included: 195 transitioned within three years and 346 did not (Table 2). The mean duration between baseline assessment and transition was 276.72 days (SD = 267.33). The groups did not differ in age, sex assigned at birth, UHR inclusion criteria, or intervention provision. The transitioned group had greater impairment in global functioning, more severe general psychopathology, and experienced a longer duration between symptom onset and intake at clinical services. In this group, unusual thought content, impaired cognitive functioning, impaired energy, and impaired emotional functioning were more severe (Bonferroni-corrected). When excluding the 21 youth who transitioned after three years from the non-transitioned group, the observed pattern of results remained consistent (Supplementary Table S3).
Table 2. Socio-demographic and clinical characteristics at baseline of UHR youth who transitioned or did not transition to psychosis within three years

Abbreviations: APS, attenuated positive psychotic symptoms; BLIPS, brief limited intermittent psychotic symptoms; BPRS, Brief Psychiatric Rating Scale; GAF, Global Assessment of Functioning; NA, Not applicable; SOFAS, Social and Occupational Functioning Assessment Scale; UHR, ultra-high risk for psychosis; a, Mann–Whitney U test; b, x 2 test/Monte Carlo; 1, after Bonferroni correction
Network analysis
The goldbricker function did not detect nodes to be excluded. Due to nearly 60% missing data for the symptom “non-bizarre ideas” (Supplementary Table S4), this variable was excluded from the main analysis.
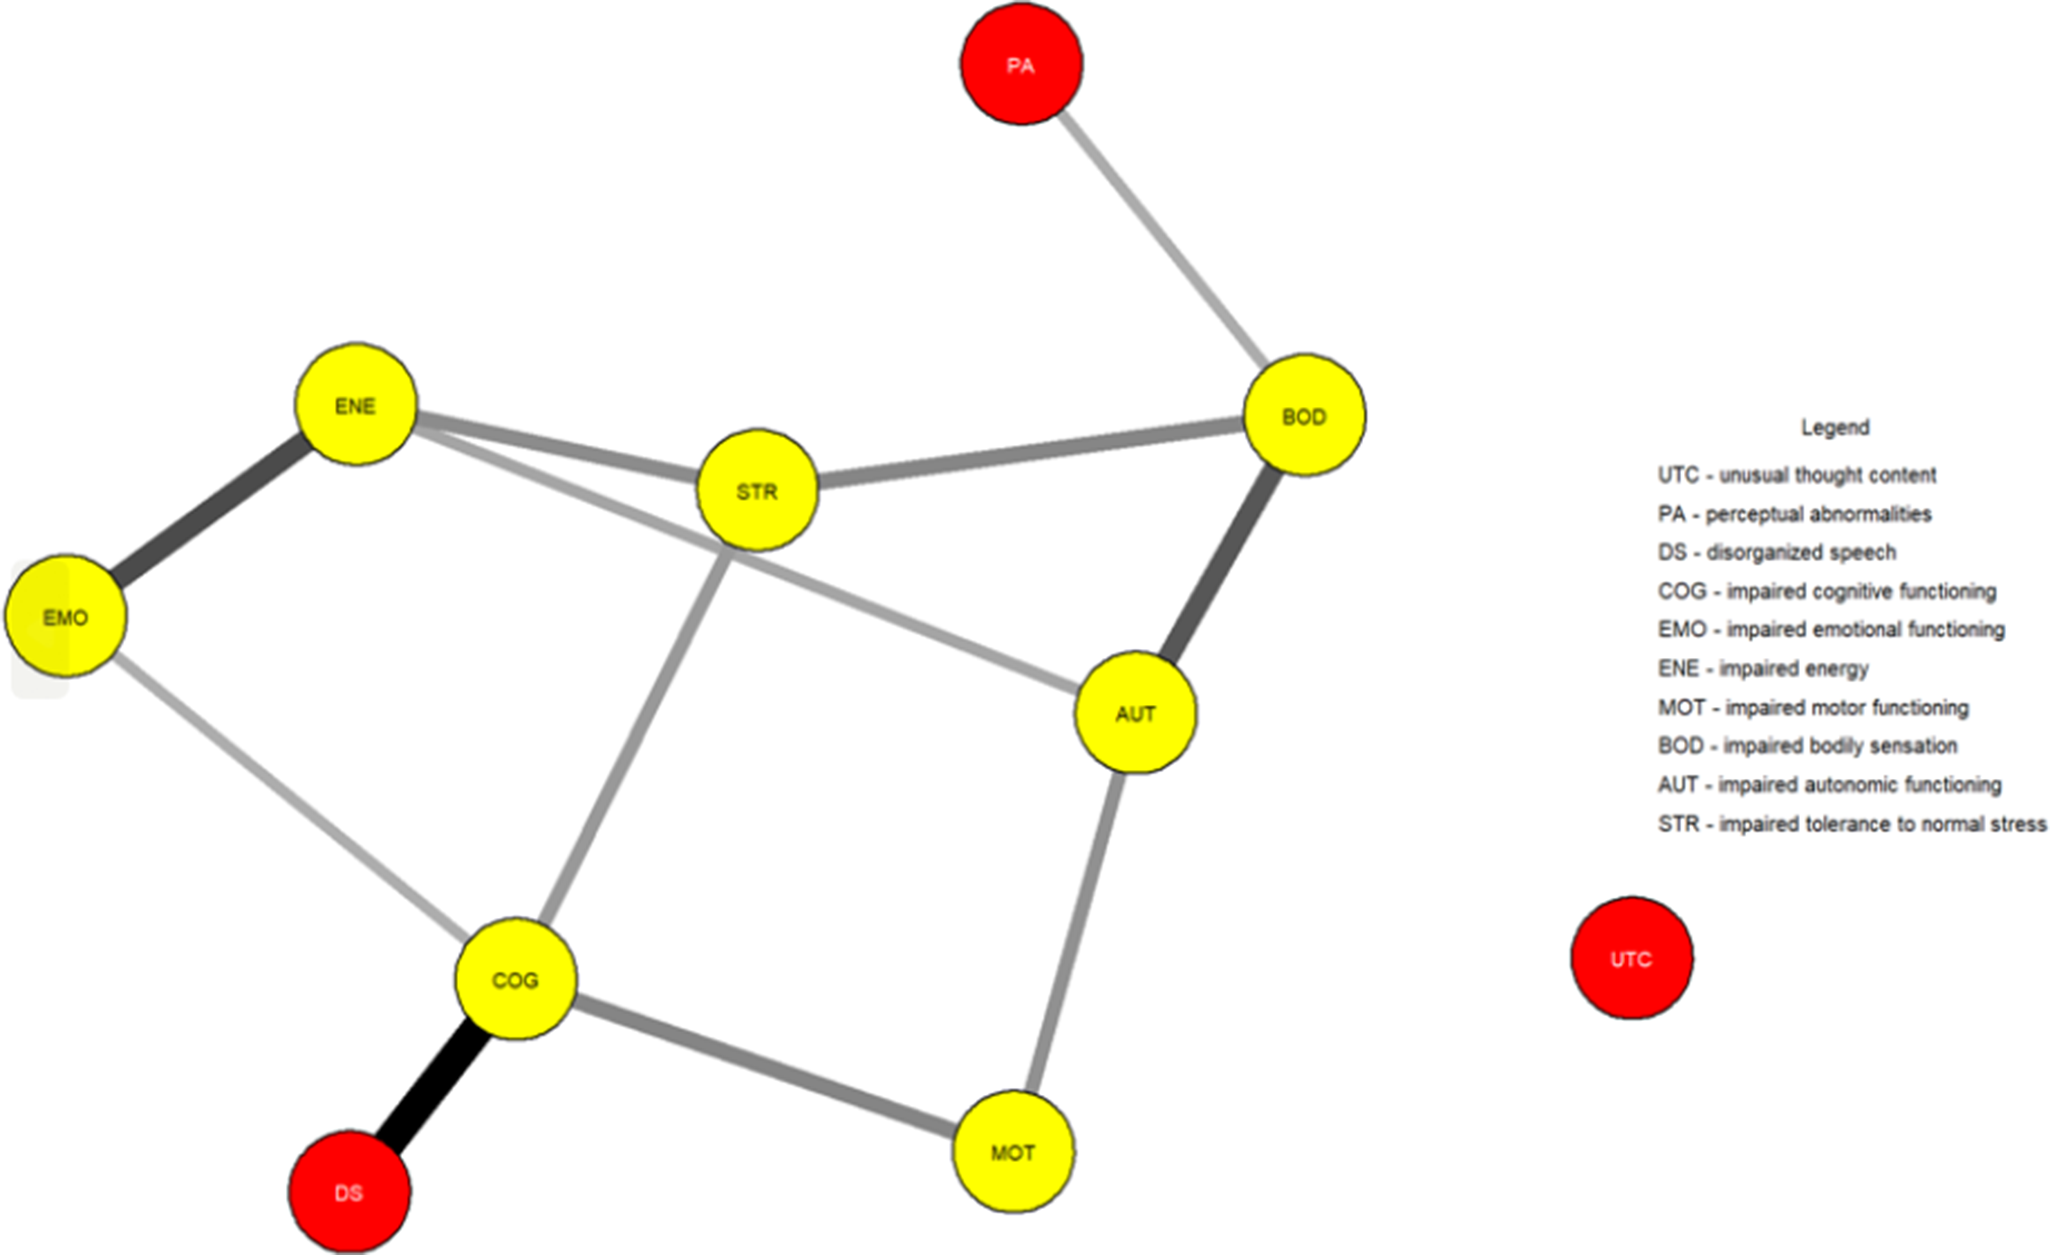
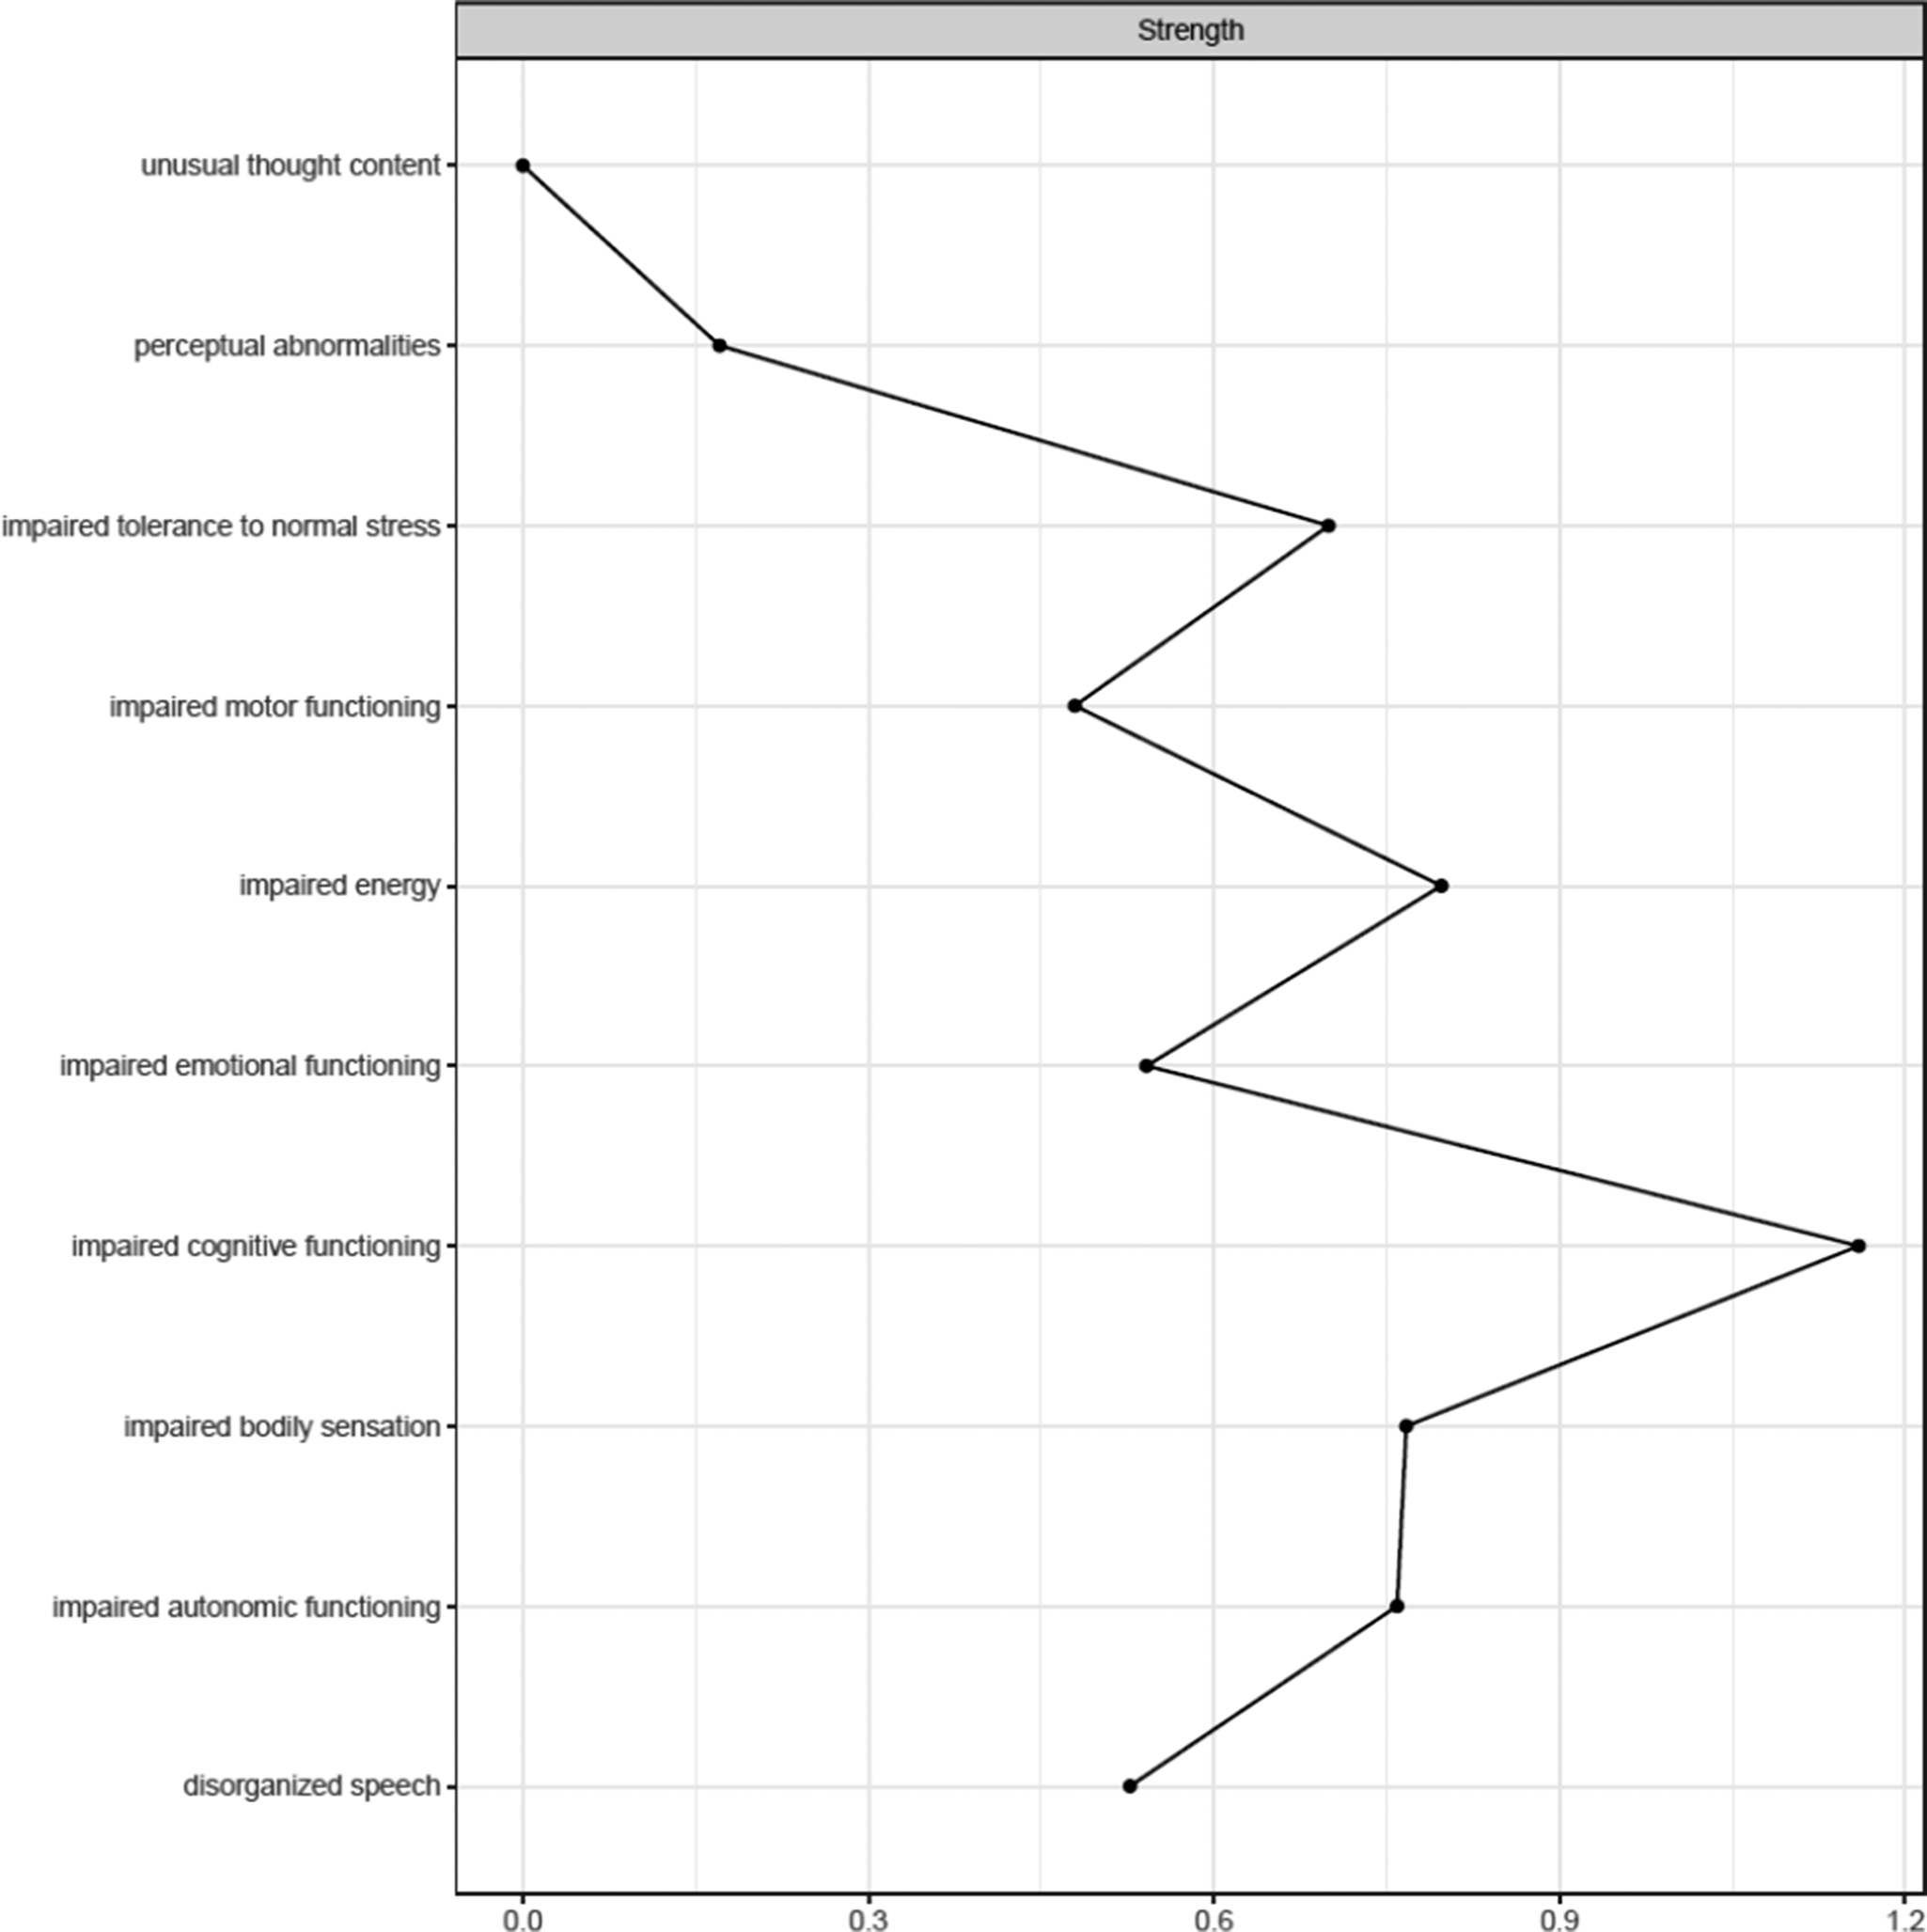
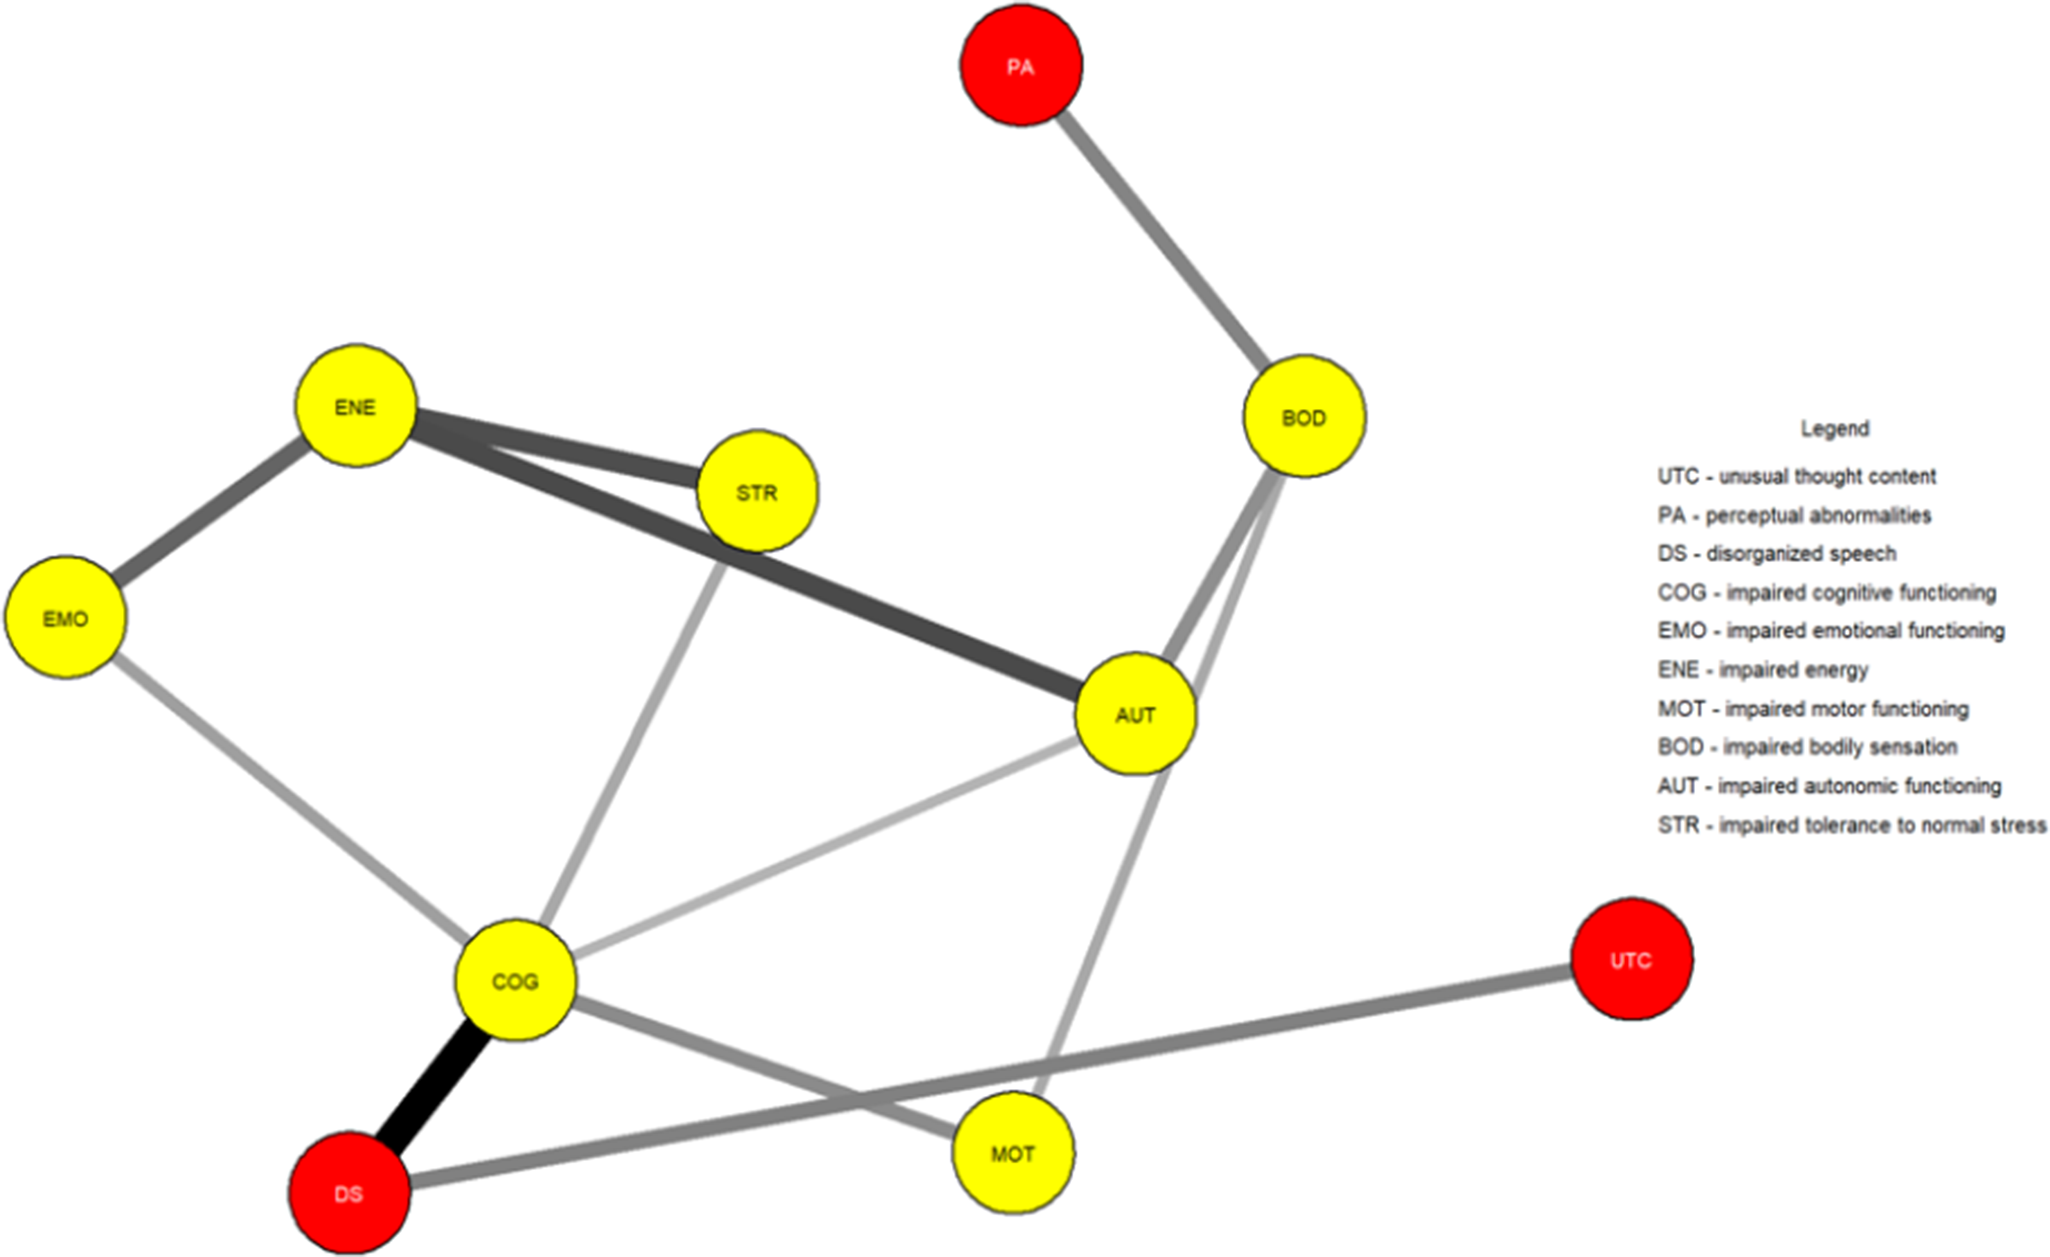
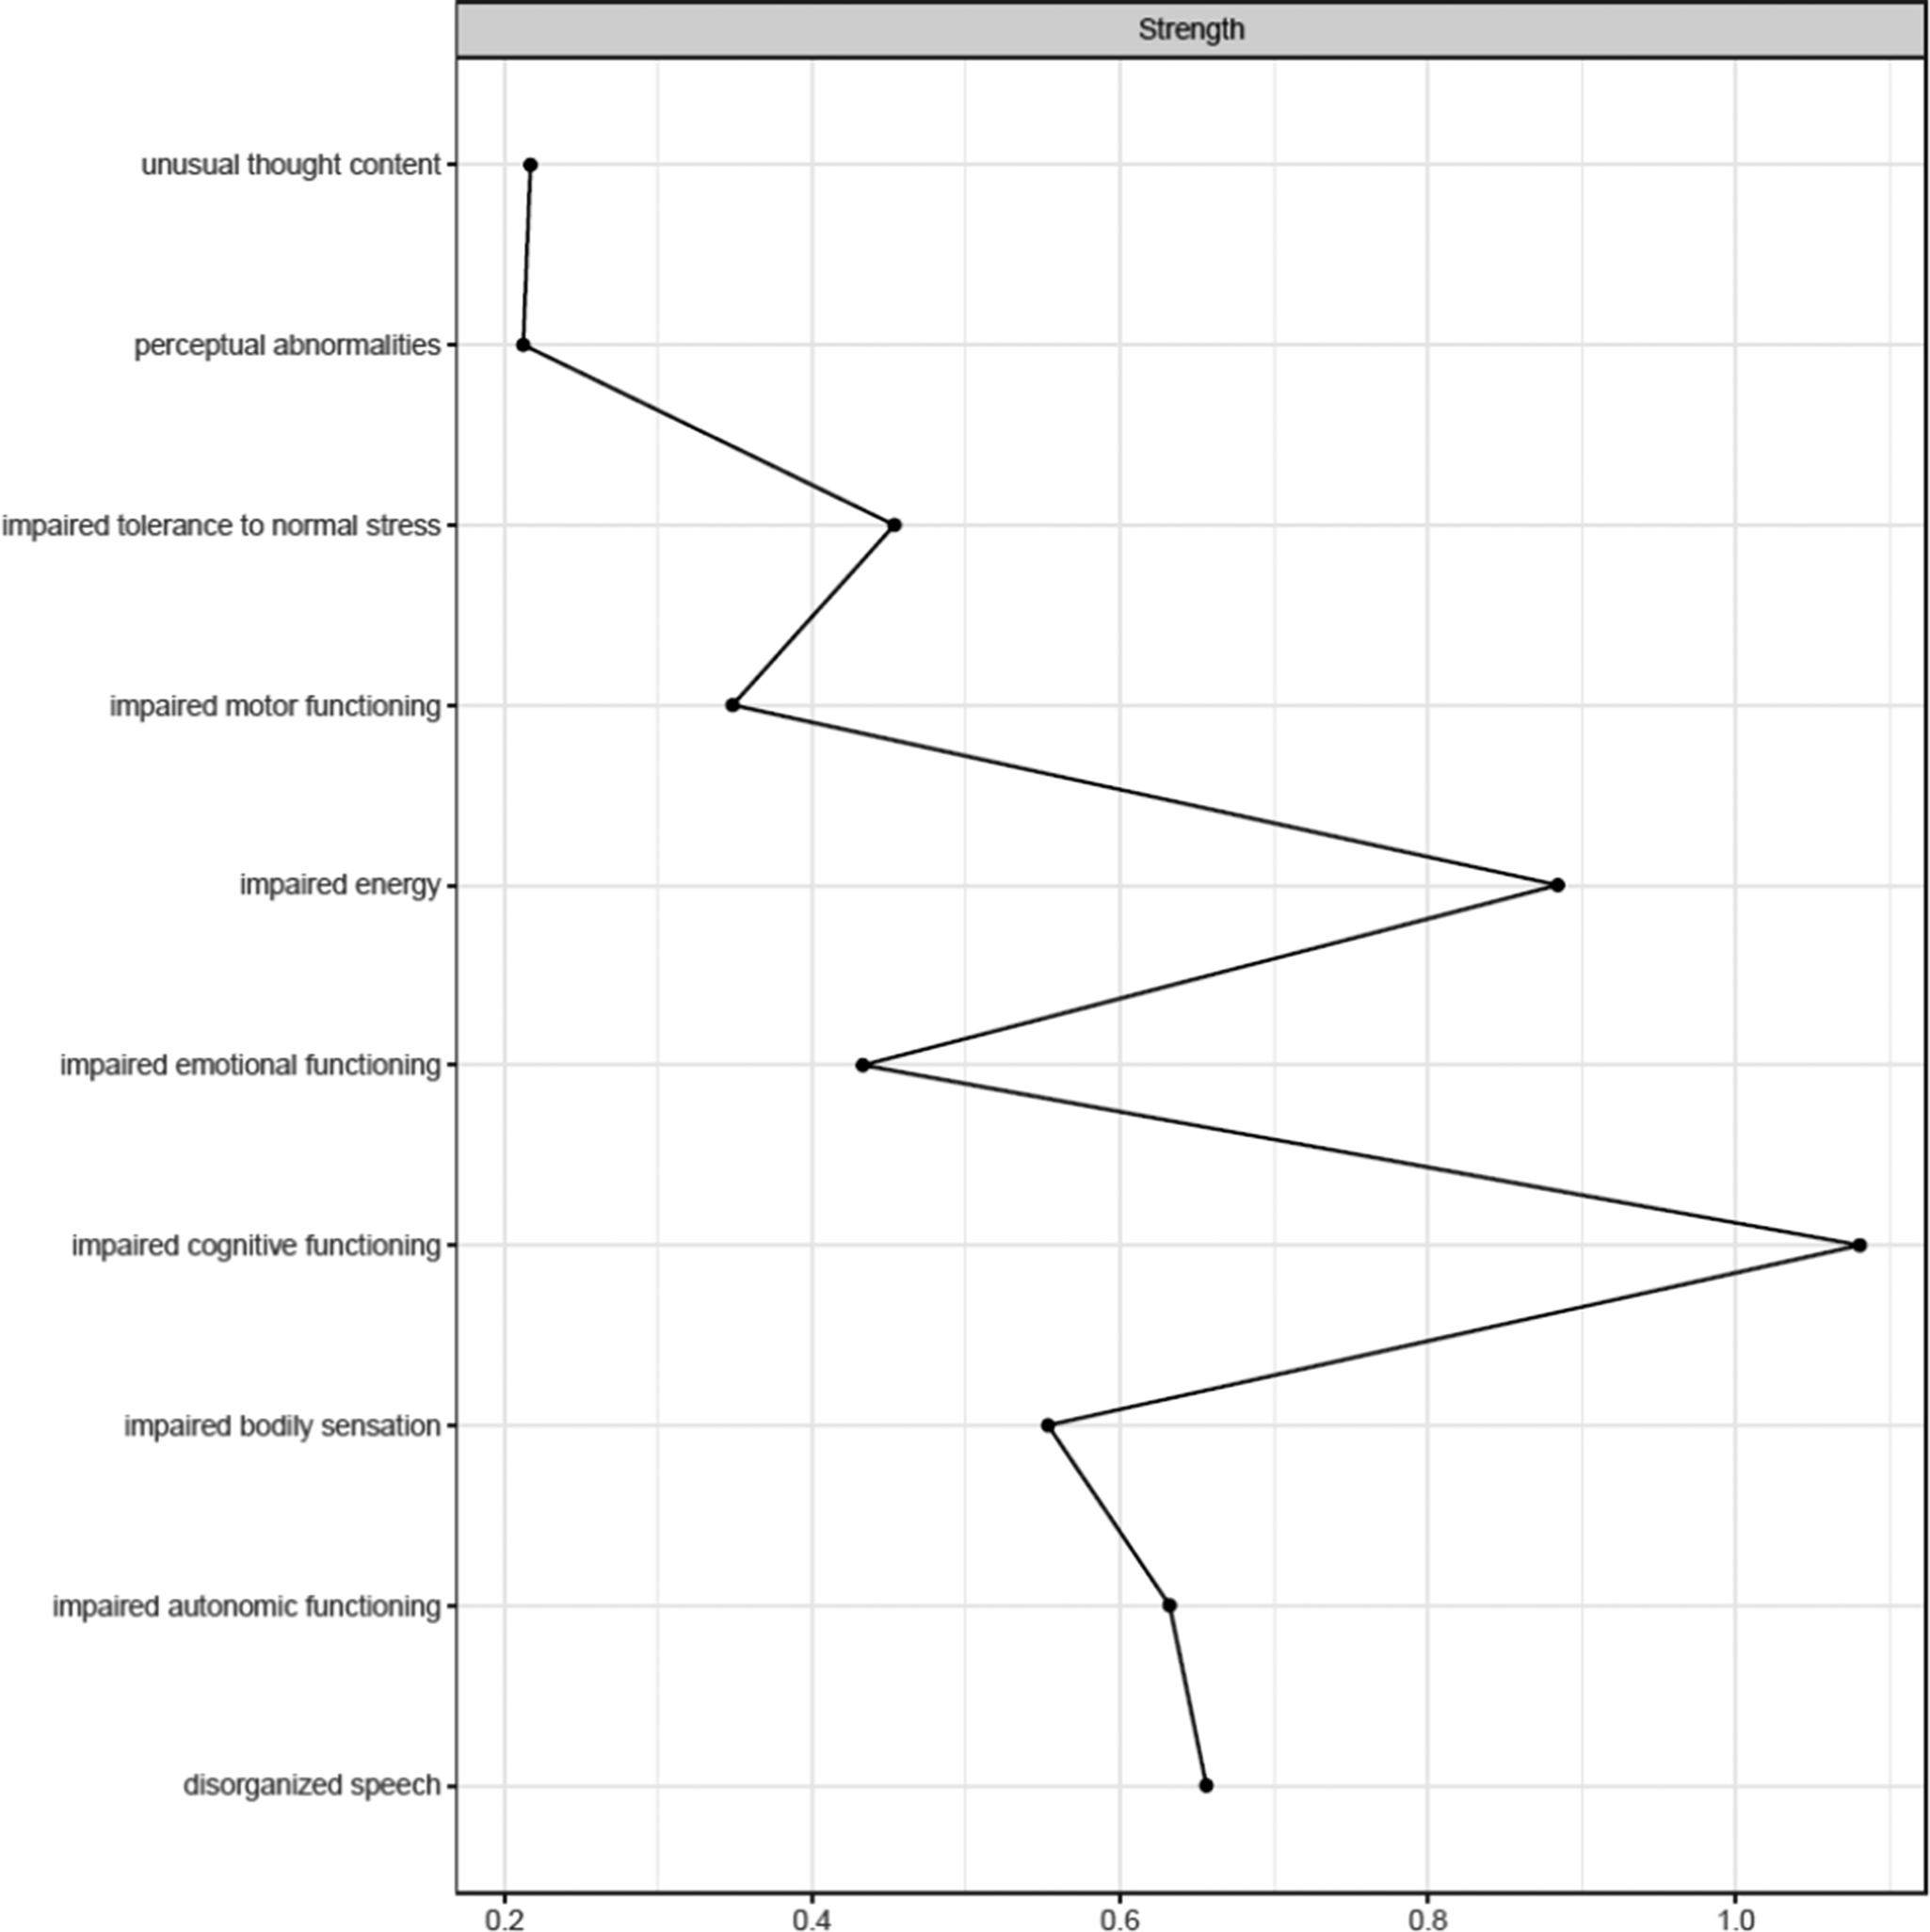
Figure 1 shows the network estimated from the youth who transitioned within three years. Unusual thought content was not connected to other symptoms, indicating that associations involving this symptom were too weak to be detected by the estimation method. Figure 2 plots the network centrality index strength. Impaired cognitive functioning, impaired energy, impaired bodily sensation, impaired autonomic functioning, and impaired tolerance to normal stress exhibited higher node strength than two positive symptoms (i.e., unusual thought content and perceptual abnormalities) (SupplementaryFigure S1). The edge between impaired cognitive functioning and disorganized speech was stronger than all other connections, except for those between impaired energy and emotional functioning, and between bodily sensation and autonomic functioning, where no difference was found (Supplementary Figure S2). The CS was 0.44 (Supplementary Figure S3). The bootstrapped 95% confidence intervals for the estimated edge weights are reported in Supplementary Figure S4.

Figure 1. Network structure of youth who transitioned to psychosis (N = 195). The associations are either positive (colored black) or negative (colored red), with thicker lines representing stronger associations. Positive symptoms are shown as red nodes, while basic symptoms are shown as yellow nodes.

Figure 2. Centrality index (strength) of youth who transitioned to psychosis (N = 195), shown as standardized z-scores.
Figure 3 shows the network estimated from youth who did not transition within three years. In these youths, in contrast to those who transitioned, unusual thought content exhibited a connection with disorganized speech. Figure 4 plots the network centrality indices. Impaired cognitive functioning and impaired energy exhibited higher node strength than two positive symptoms (i.e., perceptual abnormalities and unusual thought content) (Supplementary Figure S5). The edge between impaired cognitive functioning and disorganized speech was stronger than all the other connections in the network (Supplementary Figure S6). The CS was 0.44 (Supplementary Figure S7). The bootstrapped 95% confidence intervals for the estimated edge weights are reported in Supplementary Figure S8.

Figure 3. Network structure of youth who did not transition to psychosis (N = 346). The associations are either positive (colored black) or negative (colored red), with thicker lines representing stronger associations. Positive symptoms are shown as red nodes, while basic symptoms are shown as yellow nodes.

Figure 4. Centrality index (strength) of youth who did not transition (N = 346), shown as standardized z-scores.
In both networks, impaired cognitive functioning connected disorganized speech to impaired emotional functioning, impaired motor functioning, and impaired tolerance to normal stress. Impaired bodily sensation connected perceptual abnormalities to other symptoms.
The Network Comparison Test revealed that the two network structures did not differ in global strength (p = .53), network structure (p = .42), and node strength (p > .05 in all nodes) (Supplementary Table S5).
Sensitivity analyses confirmed the lack of significant differences in the two groups and the isolation of unusual thought content in youth who transitioned. This pattern of results was observed when excluding youth who transitioned after three years from the group of youth who did not transition within three years (Supplementary Figures S9–S12, Supplementary Table S6). Such results were unchanged when incorporating “non-bizarre ideas” in the two main networks (Supplementary Figures S13–S20, Supplementary Table S7) and when comparing youth who transitioned (main analysis) with a sub-sample of youth who did not transition matched for sample size, age, sex assigned at birth, UHR inclusion criteria, and intervention provision (Supplementary Figures S21–S24, Supplementary Table S8). Networks estimated from the transitioned and non-transitioned groups assessed using CAARMS versions with different scores were similar but unstable, not allowing us to draw conclusions regarding the impact of different CAARMS versions on symptom interconnections (Supplementary Figures S25–S32, Supplementary Tables S9–S10).
Finally, we compared excluded and included youth who did not transition (main analysis), observing baseline differences, including some symptoms’ severity and network structure. However, only differences in one edge remained significant after Bonferroni correction (Supplementary Tables S11–S12, Supplementary Figures S33–S34).
Discussion
In 541 UHR young people recruited over more than 25 years, we examined the interconnections between baseline symptoms in youth who transitioned and those who did not within three years from assessment.
Results showed that network analysis of baseline symptoms did not differentiate between youth who transitioned from those who did not. The two groups exhibited a comparable level of connectivity, symptom interconnections, and the importance of individual symptoms within networks. In contrast, differences in symptoms’ severity were observed, namely unusual thought content, impaired cognitive functioning, impaired emotional functioning, and impaired energy.
The most notable difference was unusual thought content being isolated in the transitioned group. This indicates that such a symptom was not meaningfully connected to other symptoms within the constraints of the estimation procedure. We could hypothesize that the isolation of this symptom could reflect its tapping into unusual experiences related to a disruption of the barrier between the self and the world–phenomena traditionally seen as part of the Schneiderian first-rank symptoms and distinct from other positive symptoms and clinical manifestations [Reference Moscarelli43, Reference Schneider44]. However, its strength did not differ between groups, indicating comparable importance across networks. Although unusual thought content represents one of the most robust risk factors for transition [Reference Thompson, Nelson and Yung45], potentially leading to a loss of insight and diminished contact with reality, it had little to no interaction with other symptoms across networks. Moreover, although positive symptoms define two of the three UHR subgroups and mark transition, most of them had little importance within networks, in line with prior studies [Reference Boldrini, Lo Buglio, Cerasti, Pontillo, Muzi and Salcuni15, Reference Lo Buglio, Pontillo, Cerasti, Polari, Schiano Lomoriello and Vicari21]. Symptoms like impaired cognitive functioning and impaired energy exhibited several interconnections; however, limited research has explored the prognostic value of highly interconnected symptoms, with mixed findings [Reference Bringmann, Elmer, Epskamp, Krause, Schoch and Wichers46]. Our sensitivity analyses supported the comparability of network structures and the isolation of unusual thought content in those who transitioned.
Across groups, network analysis revealed a complex interplay between speech, perceptual, cognitive, affective, and bodily symptoms. Findings suggest clinical attention for impaired cognitive functioning, as it is linked to disorganized speech to emotional, bodily, and stress-related impairments. A strong connection was between impaired cognitive functioning and disorganized speech, suggesting a shared underlying problem related to disorganized thinking. The results also suggest the potential role of impaired bodily sensation in linking perceptual abnormalities to other symptoms.
According to network comparisons, aside from the isolation of unusual thought content in the transitioned group – which requires further research before clinical translation – no symptom emerged as warranting clinical attention specifically in those who later transitioned. Research to inform more effective treatments is justified, as emphasized by an updated meta-analysis, which highlighted no sustained effects of any intervention in preventing transition compared to control conditions [Reference Minichino, Davies, Karpenko, Christodoulou, Ramalho and Nandha47]. In that study, the most promising psychosocial intervention was the integrated approach by Bechdolf et al. (i.e., cognitive-behavioral therapy, cognitive remediation, skills training, and psychoeducation) [Reference Bechdolf, Wagner, Ruhrmann, Harrigan, Putzfeld and Pukrop48], which might target multiple symptoms in our networks (e.g., impaired cognitive functioning and impaired tolerance to normal stress, also managing thought and perceptual alterations); however, it was trialed in individuals only with basic symptoms (without subthreshold psychotic symptoms). Our results suggest clinical attention on positive symptoms alongside a range of psychopathology, as symptoms like impaired cognitive functioning and impaired tolerance to normal stress connected multiple clinical manifestations.
Cross-sectional networks may fail to capture the complex, dynamic change process that marks the transition from one state of the system of symptoms (e.g., UHR) to another (e.g., psychosis), in which such a system reaches a critical, tipping point and remains trapped in a novel equilibrium [Reference Borsboom12, Reference Scheffer, Bockting, Borsboom, Cools, Delecroix and Hartmann49]. To refine prognostic precision, studies using network approaches to analyze panel or time series data hold promise; for a framework, see [Reference Epskamp50]. These models estimate how symptoms influence one another over time by capturing lagged, directional interactions – potentially enhancing prognostic accuracy [Reference Schumacher, Klein, Hautzinger, Härter, Schramm and Kriston51, Reference Ebrahimi, Borsboom, Hoekstra, Epskamp, Ostinelli and Bastiaansen52]. Notably, this complies with ongoing international research programs that perform repeated assessments in UHR youth [Reference Wannan, Nelson, Addington, Allott, Anticevic and Arango9]. Such research could explore how positive symptoms reinforce each other and/or are sustained by other symptoms over time, potentially contributing to the progression toward psychosis.
Limitations
Several limitations of the current study should be acknowledged. First, the three-year follow-up needs to be fully incorporated into preventive care. However, monitoring outcomes over this period complies with large-scale evidence synthesis studies on psychosis prevention services and transition [Reference Salazar de Pablo, Estradé, Cutroni, Andlauer and Fusar-Poli22, Reference De Pablo, Radua, Pereira, Bonoldi, Arienti and Besana53]. Second, although the CAARMS includes items related to basic symptoms, it mainly focuses on UHR identification, differing from tools assessing basic symptoms risk inclusion criteria [Reference Schultze-Lutter, Addington, Ruhrmann and Klosterkötter54, Reference Schultze-Lutter, Marshall and Koch55]. However, by harmonizing different CAARMS versions, we could adopt a homogeneous approach across heterogeneous studies. Third, excluded and included youth who did not transition exhibited baseline differences. However, only one connection remained significant after the Bonferroni correction. Finally, different CAARMS versions and tools (e.g., BPRS, GAF, CASH) were used to assess symptoms and UHR status. A comprehensive CAARMS symptoms harmonization was guided by clinical anchor descriptions to preserve the meaning of severity ratings and was developed through expert consensus, increasing statistical power. We performed sensitivity analyses to investigate the impact of using different CAARMS versions, resulting in unstable networks.
Conclusion
The networks of youth who transitioned and who did not transition were similar, indicating similar baseline symptom relationships. Across groups, unusual thought content, despite being traditionally associated with transition, had little to no interactions with other symptoms. Clinical manifestations that may need attention include impaired cognitive functioning and impaired bodily sensation. Future research using time series data may support progress toward individualized care.
Supplementary material
The supplementary material for this article can be found at http://doi.org/10.1192/j.eurpsy.2025.10141.
Data availability statement
Data are available upon request from the corresponding author.
Acknowledgements
CMJW was supported by an NHMRC Investigator Grant (2034232). AL is funded by a NHMRC Investigator Grant (#2010063). BN was supported by an NHMRC Investigator Grant (2026484). TB received funding from the Italian Ministry of University and Research under the call Progetti di Rilevante Interesse Nazionale (PRIN) 2022 (project number 20224SX547). ARY was supported by an NHMRC Investigator Grant (2026339). PDM was supported by Senior Principal Research Fellowship (Grant No. 1060996) from the NHMRC.
Author contribution
Conceptualization: BN, GLB; Methodology: GLB, BN, SH, TB, DD, CMJW, JN, IS, VL, ATa; Formal analysis: GLB; Writing – original draft: GLB; Writing – review & editing: SH, TB, GLB, BN, AP, SL, SRC, IS, PDM, HPY, JN, CMJW, SJW, AL, VL, ATh, ATa, JAH, ARY; Resources: BN, PDM, ARY, HPY, SRC, SJW, AL, SL, ATh, JAH, AP; Supervision: BN, SH, VL.
Financial support
This research was funded in part by the Prediction of Early Mental Disorder and Preventive Treatment (PRE- EMPT) - National Health and Medical Research Council (NHMRC) Centre of Research Excellence (Grant No. 1198304).
Competing interests
PDM reported grants from the National Institute of Mental Health during the conduct of the study; in addition, Dr McGorry had a patent for AU 2015203289 issued, a patent for US 9884034 issued, a patent for US15/844444 issued, and a patent for CA 2773031 issued; and he has received past unrestricted grant funding from Janssen-Cilag, AstraZeneca, Eli Lilly, Novartis, and Pfizer, and honoraria for consultancy and teaching from Janssen-Cilag, Eli Lilly, Pfizer, AstraZeneca, Roche, Bristol Meyers Squibb, and Lundbeck. He has received grant funding from the Colonial Foundation, the National Health and Medical Research Council of Australia, Australian Research Council, NARSAD, the Stanley Foundation, NIH, the Wellcome Trust, and the Australian and Victorian governments. SRC received speaker/consultation fees from Janssen-Cilag, Lundbeck, Otsuka, and Servier and research funding from Janssen-Cilag, Lundbeck, Otsuka, and Gilead. Other authors do not have anything to disclose.


 Open access
Comments
No Comments have been published for this article.