


Introduction
Elections represent key moments for modern politics. Even for regimes that cannot be considered full democracies, holding elections has the potential to confer legitimacy and moderate dissent (Howard & Roessler Reference Howard and Roessler2006). In this regard, it is crucial that especially those who supported the losing side of the election are willing to comply with the election outcomes. It is far easier to comply with the election results when the elections are fought in a free and fair way (Dahl Reference Dahl1989), which is usually the case under established democracies (Esaiasson Reference Esaiasson2011). In practice, though, even within established democracies, the electoral system may unfairly bias parties’ seat distribution resulting in an election outcome that does not reflect voters’ preferences (Horowitz Reference Horowitz2003: 115). The conversion of votes into seats changes across electoral systems with electoral rules having significant consequences on the final distribution of power among parties (Sartori Reference Sartori1976). When judging how ‘fair’ voting rules are, a fundamental criterion used by both scholars and politicians is their ability or inability to produce proportional results – that is, the extent to which the seat distribution accurately reflects vote shares (Lijphart Reference Lijphart1999). In this regard, list‐system proportional representation (PR) and the single transferable vote (STV) usually lead to a seat share distribution that more closely resembles the vote share distribution than majoritarian electoral rules (Gallagher Reference Gallagher and Caramani2011).
Despite the progressive understanding of how people react to election outcomes in terms of who has lost and who has won the election (e.g., Anderson et al. Reference Anderson, Blais, Bowler, Donovan and Listhaug2005), far less emphasis has been placed on understanding how people respond to the conversion of party votes into parliamentary seats. How do citizens react to electoral outcomes? Do they judge the outcome solely on the basis of how well (or poorly) their party performed or do they also care about how proportional the outcome is? And is the consideration of how fair or unfair the vote/seat conversion is confined to losers – that is, are winners perfectly satisfied with a system that is unfair but advantages their preferred party? These are the questions we address in this study.
To examine whether voting rules matter for both groups of large and small parties’ voters, we rely on a randomised survey experiment. Commonly, disproportionality advantages larger parties and disadvantages smaller ones. In such an instance, the key to showing that citizens care about proportionality beyond party performance is to compare counterfactual scenarios in which alternative explanations can be ruled out: How would citizens have judged voting rules had the election outcome not being favourable, or had a different vote‐to‐seat conversion being used – all else equal? In our randomised voting experiment, the election outcome and the proportionality of the conversion of votes into seats are directly manipulated. This explicitly allows us to measure both between‐groups and within‐group differences simultaneously – that is, to determine whether supporters of large and small parties are more or less satisfied under proportional rules than under disproportional rules, by examining how individuals react to different counterfactual scenarios.
We embedded the experiment within a representative survey of citizens in four countries – Austria, England, Ireland and Sweden – which differ substantially in terms of electoral rules. Such variation, spanning proportional‐style democracies with list or STV systems and majoritarian‐style democracies with first‐past‐the‐post, is important to generalise our results beyond a specific electoral setting and determine whether there is a status quo bias leading people to prefer electoral rules that do not deviate from what they are used to.
We find that while the performance of the supported party exercises a substantive effect on support for the voting rule, disproportionality decreases support for the voting rules for both large and small parties’ voters. These results square well with the argument that while voters are rational, motivated reasoners that take into account how their own party has performed in terms of votes or seats, the fairness of the electoral rules matters for voter support beyond party performance. There is little cross‐country variation with results remarkably similar in the four cases we examine, which suggests little status quo bias.
Our voting experiment makes at least three important contributions to the existing literature. First, the study evaluates voter rationality in the context of election outcomes. The argument is that rational, motivated voters should base their support for voting rules exclusively on election results and the extent to which the voting rules give an advantage to their own party. The evidence shows that voters’ inclination to make sensible judgments about the fairness of voting rules is not circumscribed, but applies regardless of party performance. Second, the study contributes to the extensive literature on citizen support for democratic regimes (Anderson & Guillory Reference Anderson and Guillory1997; Aarts & Thomassen Reference Aarts and Thomassen2008; Farrell & McAllister Reference Farrell and McAllister2006) by manipulating and isolating, for the first time with an experimental design, the effect that factors associated with the outcome of elections have on citizen support for the voting rules. Third, the experiment contributes to the extensive literature on institutional design (Norris Reference Norris2004), going beyond the study of diffuse satisfaction with the way democracy works in the country by specifically examining voter support for the voting rules. Altogether we find that electoral rules that make resource allocation fairer have a positive effect on citizens’ satisfaction with those rules. Beyond academia, our survey experiment aims at making two contributions. First, given that dissatisfaction with the election outcomes has a negative spill‐over effect on the perceived legitimacy of democratic systems (Easton Reference Easton1965; Powell Reference Powell2000), it is important to investigate, as we do, the causal mechanisms that link electoral rules to voter support. Second, electoral reforms are discussed today in several countries, including Canada, France, the United Kingdom and Italy. Bowler and Donovan (Reference Bowler and Donovan2007) find that proposals for major reforms receive considerable public support. Our study speaks to this debate by showing that proportionality matters and increases voter support for the rules by which election outcomes are determined. Albeit our experimental setting does not take into account government formation and hence the trade‐off between representativeness and accountability, reformers themselves should gain much from the study's findings and in knowing what works when new electoral institutions are designed.
Theoretical framework: Shares or fair shares?
It is well‐known that a favourable outcome that aligns with an individual's preferences makes that individual more supportive of the institution or authority that has led to that outcome (Anderson et al. Reference Anderson, Blais, Bowler, Donovan and Listhaug2005). This is not only because the favourable outcome may bring material benefits to that individual, but also because it leads to an emotional ‘euphoria’ (Holmberg Reference Holmberg and Norris1999).Footnote 1 No one likes to lose.
But this is not the full story. People are also concerned with both procedural justice (Tyler Reference Tyler2006), which refers to the fairness of the methods, mechanisms and processes used to determine outcomes (Lind & Tyler Reference Lind and Tyler1988) as well as with the fairness of the outcomes themselves (Miller Reference Miller2001). Although fairness has been operationalised in different ways (see Magalhães & Aguiar‐Conraria (Reference Magalhães and Aguiar‐Conraria2019) for a recent review), attitudes towards institutions and authorities are positively affected by fairness in decision making (Miller Reference Miller2001). People value representative procedures and systems that treat people fairly and equitably (Baird & Gangl Reference Baird and Gangl2006; Gangl Reference Gangl2003; Tyler Reference Tyler1994) and they value procedural fairness in policy making in a variety of contexts (e.g., Hibbing & Theiss‐Morse Reference Hibbing and Theiss‐Morse1995, Reference Hibbing and Theiss‐Morse2002; Rohrschneider Reference Rohrschneider2005).
Given the importance that the acceptance of election outcomes holds for a well‐functioning democracy (Sabl Reference Sabl2005), several studies have focused on the extent to which fairness in the electoral process reduces the ‘winner–loser’ gap in political support. In other words, is the difference in political support between those who won the election and those who lost somewhat reduced by fairness? The literature finds that this is indeed the case for procedural fairness. Existing findings demonstrate that public perceptions of procedural fairness are important for political support and democratic legitimacy (Magalhães Reference Magalhães2014; Linde Reference Linde2012; Linde & Erlingsson Reference Linde and Erlingsson2013; Peffley & Rohrschneider Reference Peffley, Rohrschneider and Thomassen2014) but also that the ‘satisfaction with democracy’ gap between election winners and losers becomes smaller the more the electoral process in the country is considered to be fair and the more the legal and judicial systems in the country are seen to work fairly (Esaiasson Reference Esaiasson2011; Dahlberg & Linde Reference Dahlberg and Linde2016). To put it simply, the way the elections are conducted can mitigate the negative effects of detrimental outcomes.
One aspect strongly related to the immediate outcome of the election that has been largely overlooked by the existing literature is the conversion of votes into seats – namely the extent to which each party is awarded its ‘fair’ share of representation (Gallagher Reference Gallagher and Caramani2011). The reality of the Election Day can render a positive outcome with the party that one supports receiving many votes or a rather negative outcome with the supported party receiving few votes. The reality of the Election Day can also render a fair outcome with the supported party receiving a number of seats more or less proportional to the votes received or a rather unfair outcome with the supported party receiving a number of seats considerably higher or lower than ‘deserved’ given the vote distribution.Footnote 2 The questions are: Does the type of conversion – more versus less proportional – matter? Do winners and losers react similarly to a possible ‘unfair’ distribution of seats? Are people willing to support an unfair system simply because their party is advantaged? Are voters of advantaged parties simply ‘delighted voters’ that disregard how votes have been converted into seats or do they still value fairer rules? How about losers? In 2015, the United Kingdom Independence Party (UKIP) received 12.6 per cent of the votes and only one seat. This sparked a huge discussion in the media about the fairness of the election rules used to elect Members of Parliament and led to the resignation of the then‐UKIP party leader, Nigel Farage, who had failed to win his district seat. Were UKIP voters simply ‘sore losers’ blaming the system for their loss or would have they reacted differently if they had not been ‘cheated by first‐past‐the‐post’ (Stamp Reference Stamp2015)?
The evidence from existing studies on the effect of proportionality is mixed: some find a positive effect of proportionality on satisfaction with democracy (e.g., Karp & Banducci Reference Karp and Banducci2008; Lijphart Reference Lijphart2012), while some report a null effect (e.g., Aarts & Thomassen Reference Aarts and Thomassen2008; Peffley & Rohrschneider Reference Peffley, Rohrschneider and Thomassen2014). These contradictory findings are in part due to the different dependent variables existing studies employ: satisfaction with democracy, political efficacy, turnout, perceived representation, fairness of the elections and so on. These broader variables, such as satisfaction with democracy (Linde & Ekman Reference Linde and Ekman2003), are likely to be affected by many other institutional features of the democratic system that are beyond the electoral realm, such as the vertical and horizontal division of powers, freedom of the press and courts, and freedom of speech and demonstration. Another problem in the existing literature is the reliance on cross‐sectional, observational data. This reliance makes it difficult to isolate the effect that proportionality has on voter support compared to other variables like party identification (Birch Reference Birch2008) or voters’ winning status (Anderson & Guillory Reference Anderson and Guillory1997; Curini et al. Reference Curini, Jou and Memoli2012). In fact, some scholars claim that the effect of electoral rules on voters is overestimated by not accounting for a series of relevant contextual and individual‐level factors (Aarts & Thomassen Reference Aarts and Thomassen2008; Donovan & Karp Reference Donovan and Karp2017).
In this article, we are interested in the link between electoral systems and people's evaluation of regime procedures, but we aim to go beyond the general evaluation of the functioning of democracy and examine specifically people's evaluation of electoral rules. To this end, we designed a survey experiment that allows us to examine how individuals react to different counterfactual scenarios. But before describing the experiment and the results, we discuss our expectations.
How and why proportionality matters
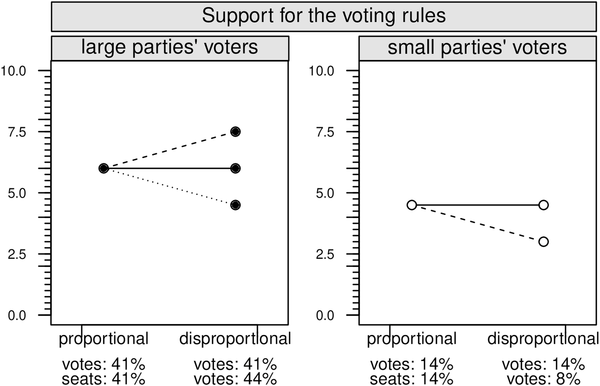
Figure 1 details the reasoning strategies that two hypothetical individuals could pursue to make sense of the election result. These reasoning strategies will determine how much support these individuals will show for the voting rules. In the figure, the solid dots indicate the voter of a large party and the hollow dots represent the voter of a small party. The vote share that the large and small parties receive in the proportional and disproportional scenarios is kept constant, what changes is the seat share distribution. Specifically, disproportionality, as common, advantages the larger parties and disadvantages smaller parties (e.g., Sanders et al. Reference Sanders, Clarke, Stewart, Whiteley and Thomassen2014). An example of vote and seat share distribution is provided at the bottom of each panel in Figure 1.

Figure 1. How large and small party voters can react to election outcomes.
The point of departure is that voters of large parties will on average be more ‘satisfied’ than voters of smaller parties – that is, between‐group differences are undeniable. The logic behind this baseline expectation is rather straightforward: the better the performance of the supported party, the more likely it is that its voters will feel that their party has won the election and the material and/or emotional ‘payoff’ associated with the experience of victory will translate into higher voter satisfaction for the system in general and specifically for electoral outcomes and the rules leading to that outcome (e.g., Stiers et al. Reference Stiers, Daoust and Blais2018; Plescia Reference Plescia2019).Footnote 3
Moving on to within‐group differences, based on the existing literature, two main expectations can be put forward on how a voter of a large party and a voter of a small party can react to the different election outcomes. A first expectation, compatible with a rational choice perspective (Downs Reference Downs1957; Riker Reference Riker1995), is that voters are rational in the sense that they are voting in order to seek some instrumental goals. The assumption made by rational choice modellers is that people choose consistently and that they do so to maximise their utility, anticipating the consequences. If so, voters’ support for the voting rules will first and foremost derive from how well their own party performed.Footnote 4 Such an expectation is compatible with a motivated reasoning perspective. Specifically, existing research shows that voters may operate as motivated reasoners, attempting to disregard or evaluate negatively information that interferes with pre‐existing partisan preferences (Lodge & Taber Reference Lodge, Taber, Lupia, McCubbins and Popkin2000; Taber & Lodge Reference Taber and Lodge2006; Redlawsk Reference Redlawsk2002). In line with this perspective, a bad performance of an individual's party reduces support because it is cognitively dissonant with an individual's pre‐existing party preference (see Kunda Reference Kunda1990). This first expectation leads to two possible scenarios.
In the first scenario voters are assumed to take into account only one piece of information – that is, either the vote share or the seat share of the supported party. It is well established that most voters have an inclination to simplify their political thinking (Zaller Reference Zaller1992; Delli Carpini & Keeter Reference Delli Carpini and Keeter1996) and tend to use simple decision rules to obviate the need for detailed information and arduous processing (e.g., Sniderman et al. Reference Sniderman, Brody and Tetlock1991). So, it is possible that voters will not scrutinise the entire information and will simply focus on party performance either in terms of vote or seat shares. If voters focus on just one piece of information without performing a comparison of votes versus seats, we should see no within‐group differences. In other words, for both groups of parties’ voters we shall observe the straight solid line displayed in Figure 1.
In a second scenario instead, it is assumed that voters take into account both types of information simultaneously – that is, both the vote and the seat party shares. In this scenario too, the underlying judgement of voters is still rather simple: Both groups of voters will straightforwardly care about their own party performance although in this case they will consider both vote and seat shares. In keeping with a rational choice motivated reasoning explanation, and since disproportionality advantages the larger parties and disadvantages smaller parties, in this second scenario we shall see that disproportionality increases support for the voting rules for large parties’ voters while it decreases support for small parties’ voters since under proportionality small parties’ voters receive a higher proportion of seats for the same amount of votes. In other words, we shall see the long‐dash line displayed in Figure 1 for both parties’ voters.
In an alternative scenario the rationality assumption is somewhat relaxed by considering the possibility that fairness of the electoral rules matters for voter support. Now, although some proportional rules can also create disproportional results,Footnote 5 all in all proportional rules are obviously ‘fairer’ to parties compared to majoritarian rules (Banducci & Karp Reference Banducci and Karp1999). In this regard, Lijphart's (Reference Lijphart1999: 275) seminal argument is that proportional regimes are ‘kinder, gentler’ institutions than majoritarian regimes since the difference between the distribution of votes and that of seats is lower compared to first‐past‐the‐post.Footnote 6 If voters care about fairness, disproportionality should reduce voters’ support for the voting rules regardless of the outcome because ‘immediate outcomes are less important than the intangible harm associated with unfair treatment’ (Magalhães & Aguiar‐Conraria Reference Magalhães and Aguiar‐Conraria2019: 168). In Figure 1, this corresponds to the dotted line for large parties’ voters and the long‐dashed line for small parties’ voters – that is, support for both groups of voters is lower under disproportional rules.
It is not necessarily the case that large and small parties’ voters will equally appreciate fairness. For most people an undesirable outcome is an unwelcome surprise that produces confusion and greater information processing (Brockner & Wiesenfeld Reference Brockner and Wiesenfeld1996). As explained by Gonzalez and Tyler (Reference Gonzalez, Tyler, Törnblom and Vermunt2007), the desire to further delve into the available information leads to a more thorough consideration of the otherwise under‐utilised information regarding fairness. This means that proportionality should matter especially for small parties’ voters. On the contrary, large parties’ voters, as ‘delighted voters’, have no cognitive need to check how the system has converted the votes into seats as they experience no discomfort with election results. After all, large parties’ voters will feel ‘thrilled’ and ‘relieved’ by the election outcome (Huddy et al. Reference Huddy, Mason and Aarøe2015). As such, they are not expected to feel disappointment when faced with disproportional outcomes. We should expect no change in support between the proportional and disproportional outcomes for large parties’ voters.
To sum up, we see four different scenarios with respect to how voters react to disproportionality. First, there may be no effect – that is, there is no within‐group difference (two straight solid lines in Figure 1). This is compatible with the expectation that voters are first and foremost rational, motivated reasoners and focus entirely on how their own party has performed in terms of either votes or seats, without paying any attention to the conversion of votes into seats. Second, disproportionality may increase satisfaction for large parties’ voters but decreases satisfaction for small parties’ voters (two long‐dash lines in Figure 1). This is compatible with the expectation that voters are rational, motivated reasoners but that they take both votes and seats into account. Third, disproportionality may make supporters of both large and small parties less satisfied because they both care about fairness, which corresponds to the dotted line for large parties’ voters and the long‐dashed line for small parties’ voters in Figure 1. Fourth, disproportionality may reduce satisfaction among small party supporters but have no impact among large party supporters, and this corresponds to the straight solid line for large parties’ voters and the long‐dashed line for small parties’ voters.
In what follows, we describe and report the results from a randomised experiment run in four countries that explicitly allows us to focus on within‐group differences – that is, on the counterfactual situation in which large (small) party voters are sometime unfairly (dis‐)advantaged by the system and sometime not. Showing how individuals react to different counterfactual scenarios will get at the very core of democratic theory to study the link between election result, voting rules and voter reaction.
Research design
The survey experiments were conducted in four different settings: Austria, England, Ireland and Sweden. Collectively, the four experimental studies offer two key advantages for testing our main arguments. First, subjects were randomly exposed to either high or low party performance and high or low proportionality. Due to random assignment, the experiments directly get at the counterfactual scenario that existing observational studies cannot: How do voters respond to the election results when the party performance and the proportionality of the system suddenly change to one that is (un)favourable to their party, all else being equal? Second, the experimental studies were conducted in four countries, three of which use a proportional system (Austria, Ireland and Sweden) and the other (England) majoritarian rules. Besides the difference in terms of proportionality of the voting system, compared to Austria and Sweden, England and Ireland are usually characterised by a lower number of parties on the ballot paper. These features afford us an opportunity to test whether our results hold across systems and to check whether there is a status quo bias leading people to prefer election procedures that do not deviate from what they are used to.
Stimulus material
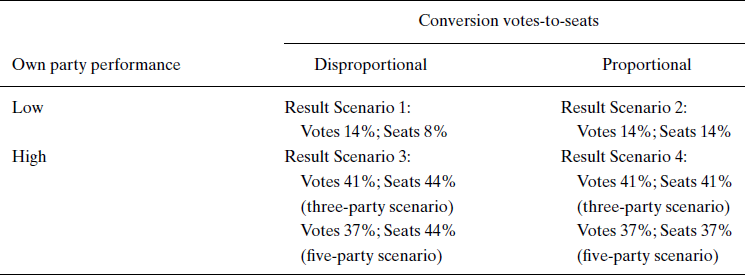
In designing the stimulus material, two things were important. The first is to mimic the election setting where people are first asked to vote with a certain number of parties (in our case, simplified to be either three or five)Footnote 7 and a certain set of rules (in our case, simplified to be either a single party vote or ranking system)Footnote 8 and then people are confronted with an election result in terms of vote and seat distributions. This makes our voting experiment closer to a real election than most survey experiments. Second, it was important to design the material to vary vote share and seat distribution while holding everything else constant. To achieve this, subjects were randomly assigned to a situation in which their party receives either a high or a low percentage of votes (see Table 1). Here we manipulate the vote share of the respondent's chosen party (either 14 or 41 per cent in the three‐party scenario or 14 or 37 per cent in the five‐party scenario). The other manipulation concerns the proportionality of the conversion of votes into seats – that is, full proportionality versus some degree of disproportionality whereby the large parties are advantaged at the expense of small parties, as shown in Table 1.
Table 1 Result scenarios in the voting experiment

Parties in the experiment are fictional. The only information that allows voters to distinguish between parties is their ideological position on the government services spending scale commonly used in national election studies and equally salient in all countries under investigation. More specifically, voters are asked to choose between either three or five parties, and these options are simply named ‘left’, (‘centre‐left’), ‘centre’, (‘centre‐right’) and ‘right’ with the two ends of the scale labelled ‘higher taxes and hence more social spending’ and ‘lower taxes and hence less social spending’, respectively. Examples of our vignettes are presented in Online Appendix A.
The use of fictional political choice comes with the clear advantage of being able to manipulate counterfactual scenarios in which parties receive different shares of votes and seats without going against the country‐specific electoral reality. Internal validity is also enhanced by isolating participants from all pre‐existing differences in terms of party attachment and so on that are likely to shape participants’ evaluations.Footnote 9 This is also why fictional settings of this kind are common in voting experiments. We address the issue of external validity of our results by embedding the experiment within national representative surveys and by running it in four countries, which differ substantially in terms of electoral rules, as previously discussed.
Data collection and models
In Austria, the survey experiment was conducted by Statistik Austria within the Plattform für Umfragen, Methoden und empirische Analysen (PUMA 2018) project as part of an online survey from a probability sample drawn on the basis of the central register of all Austrian residents (AAPOR response rate of 38.5 per cent). In England, the survey experiment was conducted by YouGov as part of the Political Omnibus Study survey (response rate for YouGov usually varies between 25 and 30 per cent). For this study, only respondents with their main residence in England were interviewed.Footnote 10 In Ireland, the survey experiment was conducted by Irelandthinks.ie within an online panel. In Sweden, the survey experiment was conducted by the Laboratory of Opinion Research (LORE) at the University of Gothenburg as part of the online Swedish National Election Study survey (Martinsson et al. Reference Martinsson, Andreasson and Markstedt2018) (AAPOR response rate of 57 per cent). The samples included in this study are largely in line with the overall population in each country, with only minor discrepancies mainly concerning age. Additional information on data collection is provided in Online Appendix C.
Our dependent variable is support for the voting rules. Respondents are asked: ‘On a scale of 0–10, where 0 means “not at all satisfied” and 10 means “very satisfied”, how satisfied are you with these voting rules that you have just used for elections in [COUNTRY of STUDY]?’Footnote 11 Note that this was part of a short battery of three questions asking respondents, right after they were shown the outcome of the election, how satisfied they were with the election result (in bold in the questionnaire), the way the votes are converted into seats and, finally, with the voting rules as a whole. We take people's satisfaction with these rules being used for elections in their country as a good indicator of their overall support for them.
In all models shown below, besides adding standard socioeconomic variables such as gender, age, education and left‐right ideological positioning that have been used in previous studies (e.g., Anderson & Guillory Reference Anderson and Guillory1997; Donovan & Karp Reference Donovan and Karp2017), we control for the number of parties and the voting rules used in the experiment as well as respondents’ satisfaction with democracy. Adding the latter variable, measured before the survey experiment to avoid any contamination effect, allows us to control for the fact that some people are generally more positive or more negative towards the functioning of elections in their country.
Our empirical findings are based on ordinary least square (OLS) regressions with country fixed effects. Except for Sweden, where the participants participated in two elections only,Footnote 12 each respondent participated in three voting experiments, and to obtain accurate variance estimates, we cluster the standard errors by the respondent because observed choice outcomes are not independent across the scenarios.
Finally, we add dummy variables for each election round to control for possible ‘learning’ effects at subsequent waves of the experiment. Our results are basically unchanged if we run the models without these control variables. A full descriptive overview of all variables is available in Online Appendix D.
Empirical findings
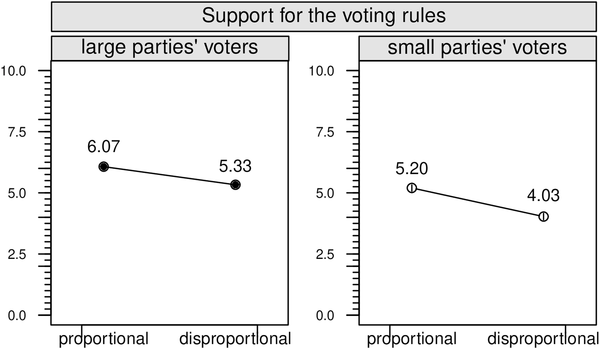
Figure 2 shows the estimated average response conditional on treatment assignment in our voting experiment. We have two main treatments – namely whether party performance is low or high and whether the conversion of votes into seats is proportional or disproportional. The dependent variable is support for the voting rules.

Figure 2. Election outcome and voter support for the voting rules.
Notes: Based on models presented in Online Appendix E. Vertical lines give the 95 per cent confidence intervals.
When it comes to the first treatment, albeit not very large, between‐group differences are significant: high party performance increases support with the voting rules and this is true in both the proportional and disproportional scenarios. Figure 2, however, also shows significant within‐group differences – namely disproportionality decreases support with the voting rules so that both groups of voters are significantly less satisfied under disproportional rules. The results indicate that our respondents take into account both vote and seat shares when making judgments about the election outcome; in fact, there is no straight line in Figure 2. The results are illuminating especially for large parties’ voters: even if the conversion of votes into seats advantages large parties in the disproportional scenario, disproportionality still exerts a negative effect on support for this group of voters. The negative effect of disproportionality for small parties’ voters is compatible with both a rational, motivated explanation but also with fairness considerations. In fact, under disproportional outcomes not only do small parties do worst electorally but they are additionally ‘unfairly’ disadvantaged by the disproportional rules.Footnote 13
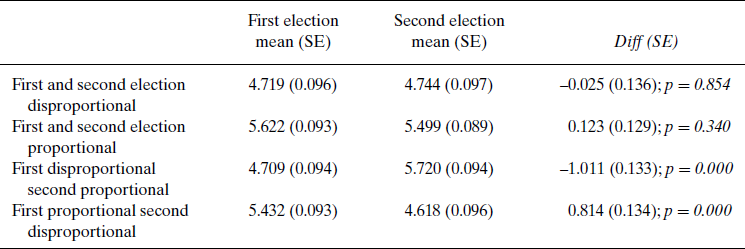
Not only within‐groups differences, but also within‐subject differences are significant. Table 2 shows that while there is no significant difference in support for voting rules if a respondent is in the same condition in both elections (either proportional or disproportional), support declines (increases) if a respondent moves from proportional (disproportional) to disproportional (proportional) voting rules.Footnote 14
Table 2 Within‐subject differences in support for the voting rules

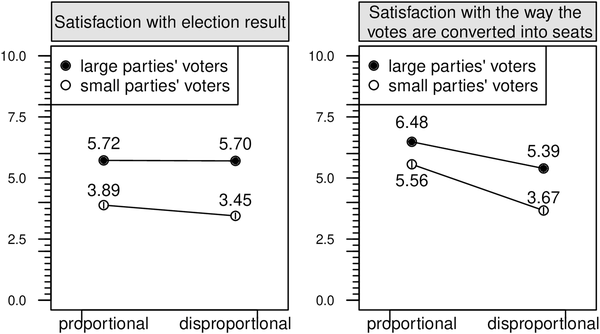
To delve further into the findings, we examine the effect disproportionality has on satisfaction with the ‘election result’ and satisfaction with the way the ‘votes are converted into seats’. Using again the 0–10 scale, this time respondents were asked “how satisfied are you with the election result” and “how satisfied are you with the way the votes are converted into seats?”, respectively. With the former we can examine respondents’ assessments of the outcome of the election per se in terms of either vote or seat shares while with the latter variable we focus specifically on the conversion of votes into seats. Both variables are positively correlated with support for the voting rules, but the correlation is higher between support and satisfaction with the conversion of votes into seats (Pearson P = 0.81) than between support and satisfaction with the electoral outcome (Pearson P = 0.60). The intuition is that if disproportionality negatively affects satisfaction with the voting rules because it is unfair, it should primarily reduce satisfaction with the conversion of votes into seats, and not satisfaction with the election outcome.
Figure 3 displays the results for these additional models. Starting with satisfaction with the election result (most left panel in Figure 3), there is no difference in satisfaction for large parties’ voters in being in a disproportional or proportional scenario. Small parties’ voters instead are indeed less satisfied in the disproportional scenario but the difference is extremely small. There is almost no effect of disproportionality on satisfaction with the election result. Overall, one can say that in terms of satisfaction with the election result what counts is party performance (between‐groups differences), not how votes are translated into seats (within‐group differences). We see straight lines in the left panel of Figure 3 for both groups.

Figure 3. Election outcomes and voter satisfaction.
Notes: Based on models presented in Online Appendix E. Vertical lines give the 95 per cent confidence intervals.
In terms of satisfaction with the conversion of votes into seats, even if large parties are ‘unfairly’ advantaged by the disproportional system in terms of seats, voters of these parties still prefer the fairer (more proportional) conversion. We also find that the difference between being a small party supporter in a disproportional versus proportional system is negative and significant – that is, small parties’ supporters do not appreciate the disproportional conversion of votes into seats. These additional results clarify that disproportionality negatively affects satisfaction with the voting rules because it is unfair. And this is true also for large parties’ voters. Actually, even though large parties’ voters are advantaged by the disproportional rules they still prefer proportional rules. Overall this suggests that disproportional rules make voters less satisfied: large parties’ voters especially are not simply ‘delighted voters’ that disregard how votes have been converted into seats. They want a fair system and they do not like a disproportional system, even when disproportionality advantages their party.Footnote 15
This is a rather strong effect even if our treatment is weak. The Gallagher index in our ‘disproportional’ treatment is 9.2 in the five‐party scenario and 5.2 in the three‐party one. This is less disproportional than the typical outcome in a majoritarian system,Footnote 16 but somewhat similar to a typical outcome in a PR election with small districts.Footnote 17 This suggests that people care about the ‘fairness’ of the voting system – that is, most people support the view that a party with let us say 20 per cent of the vote should have about 20 per cent of the seats. This is in line with the finding by Loewen et al. (Reference Loewen, Rubenson and Spirling2012) that fairness was the most powerful argument in the referendum on electoral reform held in the province of Ontario in 2007.
There are several reasons why we find an impact of disproportionality in our experiment and no observable effect in (some) cross‐sectional studies. The first is that we use a more specific dependent variable – support for the voting rule – while existing studies are usually about overall satisfaction with democracy. As previously discussed, the latter is likely to be affected by many other institutional features of the democratic system that are beyond the electoral realm. Another reason might be that, while in real‐world elections party identification, the type of government (single‐party versus multi‐party) and the vagaries of government composition after the election may counterbalance the effect of proportionality, in our survey experiment voters are stripped of these additional complications.
Given that there is no incentive in our survey experiment (e.g., receiving money depending on results), it is possible that at least some respondents might have adopted a ‘politically correct’ attitude and expressed dissatisfaction towards unfair allocations. While the fact that the vignettes were fully randomised means that the average differences uncovered in this study should be independent from the pattern of scenarios respondents were exposed to, we checked for differences across elections. In other words, since our respondents took part in at least two elections, if there is an ‘experimenter demand effect’ (Zizzo Reference Zizzo2010) this is expected to increase from one election to the next because respondents become increasingly aware of the study design over elections. To test for this, we performed two additional analyses. First, we checked whether the results would change were we to use only the first election in each country, and we found that this is not the case. Second, we checked within‐subject differences. If respondents conform their behaviour to the perceived desire of the researcher, large parties’ supporters in particular – being those unfairly advantaged by disproportionality – should show increasingly higher levels of dissatisfaction with disproportionality from one election to the next. Again, this is not the case. Taken together, these additional tests presented in full in Online Appendix G indicate that it is unlikely that the survey design drives our substantive conclusions.
Status quo bias?
The conspicuous variation in terms of style of democracy and electoral rules in our four countries enables us to examine the effect of the status quo on respondents’ preferences. As shown in several domains of decision making (see Anderson (Reference Anderson2003) for a review), including voting behaviour (e.g., Alvarez & Charles Reference Alvarez and Charles1994), individuals tend to be risk‐averse and prefer the option that represents the status quo compared to a relatively uncertain option. If there is status quo bias, people should prefer election procedures that do not deviate from what they are used to. Therefore, respondents in Austria and Sweden should react more negatively to disproportionality than respondents in Ireland, and especially England, who are used to disproportional results. Austrians and Swedes will react more negatively to the unfair outcomes because it deviates from the ‘fair’ votes‐to‐seats distribution they are used to.
Though conclusions about system‐specific findings should be taken with a grain of salt, given that there are only four countries in our study, we test whether support for proportionality declines as the median Gallagher index increases – that is, as the system used in national elections gets more disproportional. We calculate the median Gallagher index for all elections held since 2000 in our respective countries (Austria = 2.97; England = 15.02; Ireland = 6.10; Sweden = 2.04) and interact this index with the manipulations in our experiment. The interaction is negative and significant in that the negative effect of disproportionality gets stronger the more disproportional the system is (see the Online Appendix for full results). This suggests that proportionality is ‘noted’ even more in a country not used to proportional rules, a result that does not square well with a status quo bias argument. In sum, we find little status quo bias, at least in the four countries included in our survey.
Conclusion
Nobel Laureate Kenneth Arrow with his impossibility theorem proved that the ‘best’ voting method does not exist. Each electoral system has biases and no electoral system can at the same time lead to a result that perfectly reflects voters’ preferences while guarantying stability and accountability (Horowitz Reference Horowitz2003). There is, however, one aspect of electoral systems that is very visible to the public and as such often debated in times of proposed electoral reforms – namely proportionality in the conversion of votes into seats (Norris Reference Norris2004). Serious debates about electoral reforms concern countries as diverse as Austria, Canada, England, France, Israel, Italy, New Zealand and Germany.
In this article, we examined whether proportionality is appreciated by voters and under what conditions. Specifically, building on the existing literature, we asked whether citizens judge electoral outcomes exclusively on the basis of how well (or poorly) their party performed or whether they also care about how proportional the outcome is.
To study the effect of proportionality beyond and above party performance, we designed a survey experiment that allows us to focus on both between‐ and within‐groups of large and small parties’ supporters and hence get to the counterfactual situation in which party performance is experimentally manipulated alongside proportionality to ascertain their independent effects on voter support for the voting rules.
Our findings provide strong support for the idea that citizens do care about how votes are converted into seats. Specifically, while we find support for rational, motivated reasoning in that voters do take into account how their own party has performed in terms of votes or seats, disproportionality decreases support for the voting rules for both large and small parties’ voters. The use of additional dependent variables that focus specifically on satisfaction with the election result and the conversion of votes into seats shows that disproportionality negatively affects satisfaction with the voting rules for small parties’ voters because it is unfair.
We acknowledge the fact that certain real‐world features that characterise non‐fictional elections like partisanship might moderate the findings uncovered in this study. It might be easier for partisans of a large party that is advantaged by the conversion of votes into seats in a majoritarian system to reason that disproportionality does not matter much, and so the logical follow‐up to this study would be to test whether voters’ reactions to different scenarios are different when these scenarios refer to ‘real’ parties about which some respondents may have strong feelings. Still the fact that our results are robust in four very different countries suggests that the effects uncovered in this study are consistent. We strongly encourage future studies to examine cross‐country variation using a larger sample of countries than the one included here to test systematically the status quo bias argument.
There are further aspects of electoral systems that deserve attention but have not been examined in this article. To start with, proportionality affects both the number and the ideological dispersion of the competing parties (Matakos et al. Reference Matakos, Troumpounis and Xefteris2016; Curini & Hino Reference Curini and Hino2012), aspects that voters might value beyond the two features we have investigated in this study – namely party performance and the fairness of the conversion of votes into seats. This means that the net value of proportionality might be different to the partial one identified by our experiment and future studies should incorporate these aspects when assessing the effects of electoral rules on voters. Regarding the election outcome, future research should explore the question of government formation and how it affects support for the voting rules. It could be that voters prefer proportional outcomes but that they also prefer single‐party majority governments that are clearly accountable for their decisions (Persson & Tabellini Reference Persson and Tabellini2003). Optimising the trade‐off between representativeness and accountability is often a pressing concern for election engineering (Carey & Hix Reference Carey and Hix2011). This trade‐off could be the reason why existing cross‐sectional studies do not find voter satisfaction to be higher under PR – that is, the positive effect of proportionality in the seat/vote conversion could be counterbalanced by the negative impact associated with the formation of coalition governments. It thus becomes important to study how the varieties of government formation interact with the electoral formula in moderating the positive effect of proportionality found in this study.
Recent research by Becher and Menéndez Gonzalez (Reference Becher and Menéndez González2019) shows the existence of another trade‐off, between responsiveness and the quality of politicians. PR may increase policy congruence between legislators and the electorate, but reduce legislative effort. Again, the challenge for future research is to explicitly include such trade‐offs.
All in all, we believe that our findings contribute to a better understanding of what people like and dislike in how votes are counted and transformed into legislative seats. We have shown that in each of the four countries covered by this study, people do want a fair electoral formula. They support what Lijphart (Reference Lijphart1999) called a ‘kinder, gentler’ rule.
Acknowledgements
The authors would like to thank Nico Büttner, Johann Gründl and Patricia Oberluggauer for their valuable help with the Austrian questionnaire. We are also grateful to Damien Bol, Vincent Arel‐Bundock and Ruth Dassonneville for their precious feedback. We greatly benefitted from comments by participants at the Elections, Public Opinion and Parties (EPOP) conference, Royal Holloway, University of London, September 2018, and at the PUMA‐Abschlusssymposium, University of Vienna, October 2018.
Online Appendix
Additional supporting information may be found in the Online Appendix section at the end of the article:
Appendix A: Example of vignettes
Appendix B: Differences between respondents included in the different scenarios (summary statistics)
Appendix C: Data collection
Appendix D: Descriptive overview of all variables (mean and standard deviation)
Appendix E: Full models for Figure 2
Appendix F: Figure 2 by country
Appendix G: Testing for ‘experimenter demand effect’
Appendix H: Full models using only the first two elections in all four countries
Appendix I: Question wording in country‐specific language
Appendix J: Interaction with Gallagher index
Replication Files


 Open access