1 Introduction
Bull (Reference Bull1994, 115) asserts that “in any democratic system, questions play an important role in political communication.” This is evident from the prevalence of question-and-answer (Q&A) sessions in political settings, including election debates, press conferences, and town hall meetings. Formal institutional practices, such as congressional hearings and parliamentary questions, also provide venues for such dialogs. These are generally considered vital for the effective accountability of the executive branch.
The primary objective of Q&As is to elicit informative answers from those questioned, though participants may have other motives. The latter may undermine the quality of replies, such as when political messaging takes precedence over substantive dialogs. In this context, assessing the quality of answers is imperative, as it reflects the efficacy of the political institutions espousing the Q&A format.
However, measuring the quality of answers in political Q&As is hard. A key difficulty lies in defining and operationalizing answer quality, a complex and multifaceted concept. For example, Bull and Mayer (Reference Bull and Mayer1993) identified 30 tactics to elude questions in political interviews. Moreover, manually labeling large datasets with thousands of exchanges or more is prohibitively expensive and susceptible to human error, which poses challenges to human labeling and estimation through supervised learning.
In light of these challenges, we propose a novel approach for measuring the quality of answers in political Q&As. We assess the quality of an answer based on how easily and accurately it can be recognized among a set of candidate answers based on the text of the question. This measure reflects the reply’s relevance and depth of engagement with the question. We estimate it in a self-supervised way by training a language model on the corpus of observed questions and answers without additional human-labeled data. This is made possible by the strong parallel between our operationalization of answer quality and semantic search, a core task in natural language processing (NLP) that consists of retrieving from a database the information most relevant to a query (Bast, Buchhold, and Haussmann Reference Bast, Buchhold and Haussmann2016). Rather than using these question-answering systems to identify the most pertinent answer from a set of candidates, we propose repurposing them to assess the quality of observed answers.
We showcase our methodology using the Question Period (QP) in the Canadian House of Commons as a case study. The House of Commons is the Parliament of Canada’s lower chamber, where the Prime Minister and federal Cabinet ministers sit. QP takes place for 45 minutes every day the House is in session, drawing considerable attention from the media and public. During QP, members of Parliament (MPs), primarily those from opposition parties, can seek information from the government. It is one of the rare moments in Parliament when the opposition sets the agenda.
We analyze the 58,343 exchanges that occurred during QP from 2006 to 2021. Our analysis reveals that while some answers are only loosely related to questions, suggesting some evasion or obfuscation, most are at least moderately relevant, surpassing what we expect from random replies. Upon measuring answer quality, we investigate its correlates, focusing on its relationship with power dynamics in the House of Commons. We observe a significant correlation between the quality of answers and the party affiliation of the MP asking questions, with questions from government backbenchers, MPs from third parties (as opposed to the official opposition), and those from parties ideologically closer to the government tending to receive more relevant answers.
Our work engages with a theoretical debate on the nature of QP, reflecting the tension between the deliberative and strategic approaches in comparative theories of parliamentary debates (Bächtiger Reference Bächtiger2014; Whyte Reference Whyte2018). While QP’s official purpose is to allow MPs to seek the information necessary for effectively fulfilling their oversight responsibilities, some argue that it tends to devolve into a performative exercise, during which questions and answers are used for political messaging rather than for holding the government accountable. Our study assesses the extent to which and under what circumstances QP fulfills its intended function of enabling effective government oversight.
This paper is structured as follows. First, we situate our research within the existing literature. Next, we describe the origins and functions of QP. Building on this, we operationalize answer quality and outline the data and methodology used to implement our proposed methodology. Then, we formulate and test hypotheses regarding the relationship between our measure of answer quality and relevant variables. Lastly, we discuss our methodology’s broader applicability.
2 Related Literature
This paper is related to three bodies of academic literature, one substantive and two methodological.
Substantively, this study contributes to the literature on parliamentary questions, particularly QP. We build on recent research investigating the use of avoidance tactics by government ministers (Rasiah Reference Rasiah2010; Bull and Strawson Reference Bull and Strawson2019; Kukec Reference Kukec2022) and evasion tactics in political interviews (Bull and Mayer Reference Bull and Mayer1993; Bull Reference Bull1994, Reference Bull1998, Reference Bull2000, Reference Bull and Breakwell2004; Bull and Strawson Reference Bull and Strawson2019; Waddle and Bull Reference Waddle and Bull2020). We extend this line of inquiry to the Canadian context, where the quality of answers in QP has received limited attention, except for Whyte (Reference Whyte2018)’s work. Unlike previous studies that relied primarily on human annotation and basic NLP, we employ advanced computational methods.
Methodologically, we contribute to the literature integrating tools from NLP into political science by harnessing semantic search to address substantive questions. Our model builds on sentence embeddings from a variant of Bidirectional Encoder Representations from Transformers (BERT), known as “Sentence-BERT” (Reimers and Gurevych Reference Reimers and Gurevych2019). Political methodologists have widely adopted BERT and its variants (e.g., Bestvater and Monroe Reference Bestvater and Monroe2023; Wang Reference Wang2023; Widmann and Wich Reference Widmann and Wich2023; Laurer et al. Reference Laurer, van Atteveldt, Casas and Welbers2024). Unlike standard word embeddings, which provide context-agnostic representations, Sentence-BERT embeddings capture the meaning of tokens within their specific context. They have consistently performed well in semantic search. Although generative models are beginning to outperform BERT in general-purpose text embedding tasks, BERT remains a cornerstone of NLP due to its reliability and ease of deployment.
Finally, this paper engages with the literature on predictive accuracy as a substantive measure of interest in political science, an idea originating from research on political polarization (Peterson and Spirling Reference Peterson and Spirling2018; Goet Reference Goet2019). We build on the concept of using predictive accuracy as a substantive metric by proposing to measure the relevance of answers by the accuracy with which they can be recognized given the question’s text.
3 Institutional Context
QP takes place for 45 minutes each day the House of Commons is in session (Bosc and Gagnon Reference Bosc and Gagnon2017, Chapter 11). Each question and answer is limited to 35 seconds, resulting in a rapid and lively exchange. This session begins with the Speaker inviting the Leader of the Opposition to ask a series of questions, typically directed at the Prime Minister. Subsequent questions follow a predetermined order reflecting the parties’ representation in the House. Although government backbenchers and independent MPs occasionally participate, most questions come from members of officially recognized opposition parties. Party whips coordinate their caucus’s participation and submit a suggested speaking order to the Speaker’s office. The government chooses which minister or parliamentary secretary will respond to each question.
QP functions as both an accountability and oversight mechanism and a political communication platform. QP’s official purpose is for MPs to seek information from the government, setting it apart from other parliamentary debates and any sequence of loosely related speeches. Its origins lie in the principle of responsible government (Bosc and Gagnon Reference Bosc and Gagnon2017, Chapter 2). Under this constitutional convention, the government must retain the confidence of a majority of its members to stay in power. Concretely, this means that some “confidence motions” must be adopted; otherwise, the government must resign or request the Parliament’s dissolution. Regular opportunities for dialog between the government and the opposition also contribute to upholding responsible government, providing MPs with the information necessary to exercise their prerogatives effectively. QP is arguably the most prominent of these mechanisms and one of the rare moments in Parliament when opposition parties set the agenda.
QP is also a political communication platform, allowing participants to reach a wider audience. Given the intense media and public attention it garners, QP offers politicians a valuable opportunity to boost their public profile, cast their opponents in a negative light, and rally public support. In practice, opposition MPs use QP not only to gather the data and information necessary for effective oversight but also to convey key messages and “score political points” by challenging the government, providing commentary, and proposing alternative policies, for example. Similarly, the government uses this time not only to respond to the opposition’s questions but also to counter criticisms, defend its policies, and promote its achievements.
QP’s role as a political communication platform is not inherently incompatible with its function as an accountability and oversight mechanism. For example, the fear of public embarrassment can drive government ministers to engage seriously with questions (Kernaghan Reference Kernaghan1979). This is particularly consequential for a majority government since the opposition cannot threaten its survival. QP’s public nature can also undermine its effectiveness as an accountability and oversight mechanism. For example, it might prompt the government to avoid providing direct answers when they may strengthen the opposition’s position or reveal embarrassing truths. As opposition parties and the government focus on scoring political points, the quality of their dialog may suffer, causing QP to become a mere performative exercise. Finally, government backbenchers often ask questions not to gather information but to cast a favorable light on the government’s achievements.
In sum, QP is both an accountability and oversight mechanism and a political communication platform. These roles interact in complex ways, complicating any effort to conceptualize the quality of answers in QP. Ministers are unlikely to provide unadorned answers, frequently using them to convey political messages, while opposition MPs may ask questions for purposes other than seeking information. Yet, we must be able to look past these political tactics to assess whether answers are meaningful and contribute to holding the government accountable, as this is an explicit desideratum of responsible government.
4 Operationalizing Answer Quality
As described above, the formal purpose of QP is to enable MPs to seek information from the government. We wish to assess whether and to what extent answers fulfill this function. To this end, answers must be directly relevant to the questions and engage substantially with the issues raised (Maricut-Akbik Reference Maricut-Akbik2021). Accordingly, we propose measuring the quality of answers based on the depth of their engagement with and their relevance to questions. Under this framework, more relevant answers reflect a more effective QP.
Drawing a parallel with semantic search, we gauge an answer’s relevance based on how easily and accurately it can be recognized from a set of candidates randomly drawn from the corpus of observed answers based on the question’s text. This approach builds on the premise that relevant answers are more easily linked to questions than irrelevant ones, as they are uniquely tailored to questions, making them stand out as the most likely choice. In contrast, less relevant answers are more difficult to connect, with the least pertinent being so vague or generic that they could apply to many questions, making other answers appear just as, if not more, probable.
A strong connection exists between our measure of answer quality and semantic similarity, a core concept in NLP based on the “distributional hypothesis,” which asserts that words and sentences occurring in similar contexts tend to have similar meanings (Jurafsky and Martin Reference Jurafsky and Martin2024, 101). Under this hypothesis, the relevance of a word or sentence to a given context can be measured by its likelihood of occurring in it. These similarity relationships are typically learned through “fill in the blank” tasks, in which models predict the word or sentence appearing in a given context.
This approach addresses challenges inherent in operationalizing answer quality. For instance, we adopt a pragmatic perspective on relevance, focusing on the functional relationship between questions and answers rather than on a fixed and necessarily incomplete list of characteristics. We can computationally implement our conception of answer quality without human-labeled data, fostering efficiency. Lastly, following Bull (Reference Bull1994), we conceptualize answers as existing on a continuum.
Admittedly, our criterion considers a single dimension of answer quality. It alone does not guarantee a satisfactory answer. For example, a reply that rephrases the question without adding new information may satisfy it. However, we can confidently classify any response that fails to meet this minimal standard as low quality. In this case, speakers effectively talk past each other. Accordingly, our approach allows us to detect deliberate efforts to deflect attention and obscure the essence of the discussion.Footnote 1 Overall, while this criterion is a necessary condition for high-quality answers, it is not sufficient and, consequently, may overestimate answer quality. A more comprehensive assessment of answer quality might also consider factual accuracy, civility, clarity, conciseness, and comprehensiveness.
Also, confounding variables, such as the nature of the questions, can affect our assessment of answer quality. All else equal, an easily distinguishable answer is more relevant than one that is difficult to link to the question. However, not all questions are equally straightforward to answer and engage with. For instance, a lengthy preamble covering multiple topics precedes many poorly framed questions (Martin Reference Martin2011). These questions offer multiple rebuttal angles and make it harder for responders to engage comprehensively with the question. In this context, our criterion requires a high-quality answer to address as many of the topics raised in the preamble as possible, which is a reasonable expectation.
Nevertheless, the relationship between the nature of the questions and our measure of answer quality is only indirect. Therefore, we cannot regard the latter as equally reflecting any notion of question quality. While some questions are inherently more challenging, well-crafted questions do not guarantee high-quality answers. More fundamentally, the quality of questions should not be judged solely by the answers they elicit. No standard for assessing question quality parallels ours, based on desirable traits consistent with the QP’s stated purpose. Ultimately, this hypothetical relationship between the nature of questions and our measure of answer quality does not prevent meaningful comparisons of answer quality across variables, provided that the nature of questions is consistent.
In conclusion, we reiterate that eliciting and supplying insightful answers is only one of the many goals pursued by QP participants. Tensions can arise between these objectives, potentially undermining the relevance of answers. In this context, the incentives of both the government and opposition parties shape the quality of answers. Nonetheless, it remains an essential feature to consider, as it reflects the quality of the dialog and QP’s efficacy as a mechanism for accountability and oversight.
5 Methodology
5.1 Network Architecture
We implement our approach for measuring answer quality in a self-supervised manner. In particular, we train an artificial neural network to identify which answer from a random set of candidates corresponds to each question based on their respective texts. This model is trained on the corpus of observed questions and answers without additional human-labeled data. It belongs to the general class of semantic search models, which analyze the meaning of a query and seek to return the most relevant value from a database.
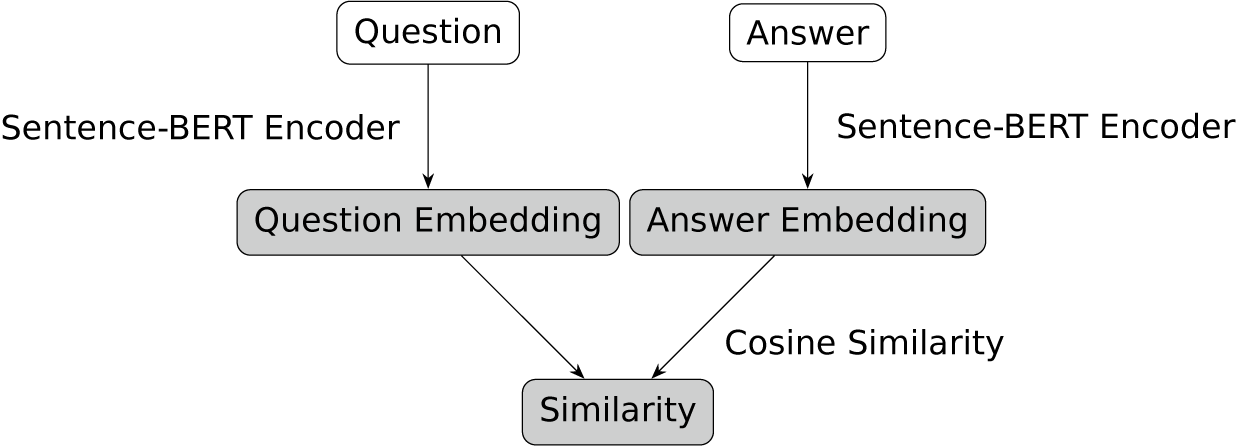
The network has three primary layers: (i) an input layer that receives a question–answer pair, (ii) two identical encoders that independently process each input to produce dense numerical representations called embeddings, and (iii) the computation of a similarity metric between the embeddings. This architecture, known as a biencoder, is represented in Figure 1.

Figure 1 Biencoder architecture.
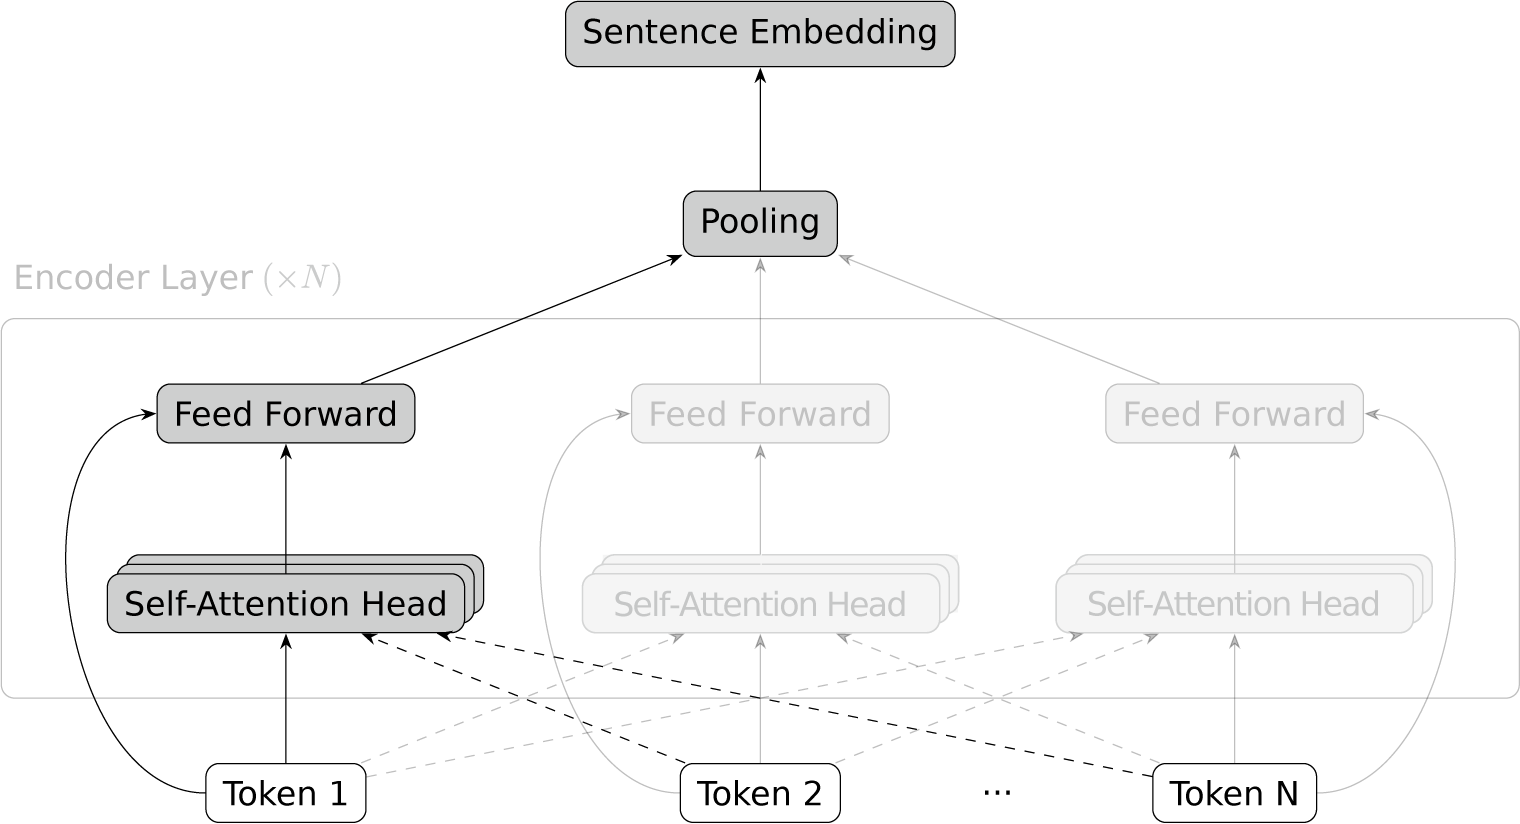
Question and answer embeddings are generated with Sentence-BERT encoders (Devlin et al. Reference Devlin, Chang, Lee and Toutanova2019; Reimers and Gurevych Reference Reimers and Gurevych2019). Their architecture is illustrated in Figure 2, with the branch for Token 1 highlighted and the others faded. An encoder takes sentences or short paragraphs, represented as ordered sequences of tokens corresponding to words or word segments, as input. It maps each token to its value’s embedding and concatenates it to positional embeddings that encode its relative location in the sequence. These embeddings go through many successive layers consisting of a multi-head self-attention mechanism and a feed-forward component. A self-attention head considers the current token’s embedding and those of the surrounding tokens and outputs a weighted sum of these embeddings based on learnable weights. Within each layer, multiple heads operate in parallel. This mechanism’s output is combined with the original token embedding and passed through a fully connected layer. Ultimately, the encoder outputs a numerical vector for each input token, which we average to get sentence embeddings.

Figure 2 Sentence-BERT encoder architecture.
We use the cosine similarity to measure the resemblance between question and answer embeddings. Upon training the model, it becomes our measure of the quality of an answer relative to the question. For reference, the cosine similarity is a measure of the angle between two numerical vectors $\boldsymbol{x}$
and
$\boldsymbol{x}$
and $\boldsymbol{y} \in \mathbb {R}^{n}$
:
$\boldsymbol{y} \in \mathbb {R}^{n}$
:
 $$\begin{align*}\cos\left(\boldsymbol{x}, \boldsymbol{y}\right) = \frac{\boldsymbol{x} \cdot \boldsymbol{y}}{\left \lVert \boldsymbol{x} \right \rVert \left \lVert \boldsymbol{y} \right \rVert}. \end{align*}$$
By construction, the value of the cosine similarity is between $-$
1 and 1, with two parallel vectors having a cosine similarity of 1, two orthogonal vectors a cosine similarity of 0, and two opposing vectors a cosine similarity of
$-$
1 and 1, with two parallel vectors having a cosine similarity of 1, two orthogonal vectors a cosine similarity of 0, and two opposing vectors a cosine similarity of $-$
1.
$-$
1.
5.2 Training Objective
We adopt the Multiple Negatives Ranking Loss as our training objective (Henderson et al. Reference Henderson, Al-Rfou, Strope, Sung, Lukacs, Guo, Kumar, Miklos and Kurzweil2017). Given a batch of size K, questions are represented by the embeddings $\boldsymbol{X} = \left (\boldsymbol{x}_{1}, ..., \boldsymbol{x}_{K}\right )$
and the corresponding answers by the embeddings
$\boldsymbol{X} = \left (\boldsymbol{x}_{1}, ..., \boldsymbol{x}_{K}\right )$
and the corresponding answers by the embeddings $\boldsymbol{Y} = \left (\boldsymbol{y}_{1}, ..., \boldsymbol{y}_{K}\right )$
. The objective is to minimize the mean negative log probability of observing the correct answer from all candidate answers in the batch. This is mathematically equivalent to maximizing the likelihood of observing the correct answer but improves numerical stability during optimization.
$\boldsymbol{Y} = \left (\boldsymbol{y}_{1}, ..., \boldsymbol{y}_{K}\right )$
. The objective is to minimize the mean negative log probability of observing the correct answer from all candidate answers in the batch. This is mathematically equivalent to maximizing the likelihood of observing the correct answer but improves numerical stability during optimization.
We model the probability of observing an answer as a logistic regression, where the input features are the cosine similarities between the question’s embedding and those of the candidate answers. In particular, the probability of observing the correct answer equals:
 $$\begin{align*}P\left(\boldsymbol{y}_{i} \mid \boldsymbol{x}_{i}\right) = \frac{\exp\left(\alpha \cos\left(\boldsymbol{x}_{i}, \boldsymbol{y}_{i}; \boldsymbol{\theta}\right)\right)}{\sum_{j = 1}^{K} \exp\left(\alpha \cos\left(\boldsymbol{x}_{i}, \boldsymbol{y}_{j}; \boldsymbol{\theta}\right)\right)}, \end{align*}$$
where $\alpha $
is a fixed scaling parameter and
$\alpha $
is a fixed scaling parameter and $\boldsymbol{\theta }$
are the Sentence-BERT encoder’s parameters.
$\boldsymbol{\theta }$
are the Sentence-BERT encoder’s parameters.
Overall, our training objective is to find the parameters $\boldsymbol{\theta }$
that minimize the following loss function:
$\boldsymbol{\theta }$
that minimize the following loss function:
 $$ \begin{align*} \mathcal{J}\left(\boldsymbol{X}, \boldsymbol{Y}; \boldsymbol{\theta}\right) & = -\frac{1}{K} \sum_{i = 1}^{K} \log\left(P\left(\boldsymbol{y}_{i} \mid \boldsymbol{x}_{i}\right)\right) \\ & = -\frac{1}{K} \sum_{i = 1}^{K} \log\left(\frac{\exp\left(\alpha \cos\left(\boldsymbol{x}_{i}, \boldsymbol{y}_{i}; \boldsymbol{\theta}\right)\right)}{\sum_{j = 1}^{K} \exp\left(\alpha \cos\left(\boldsymbol{x}_{i}, \boldsymbol{y}_{j}; \boldsymbol{\theta}\right)\right)}\right) \\ & = -\frac{1}{K} \sum_{i = 1}^{K} \left[\alpha \cos\left(\boldsymbol{x}_{i}, \boldsymbol{y}_{i}; \boldsymbol{\theta}\right) - \log\left(\sum_{j = 1}^{K} \exp\left(\alpha \cos\left(\boldsymbol{x}_{i}, \boldsymbol{y}_{j}; \boldsymbol{\theta}\right)\right)\right)\right]. \end{align*} $$
This loss function pushes the model to assign a higher cosine similarity with the question to the correct answer and a lower similarity to incorrect answers.
Our training objective treats questions and answers asymmetrically, using questions as anchors. We could use answers as anchors instead, training the model to recognize the question that each answer addresses. This approach differs from traditional semantic search, where answers seldom need to be linked to questions, and generates estimates of how deeply each answer engages with the question enough that we can identify the latter from the former. Still, this approach produces cosine similarity estimates similar to ours, with a 0.959 correlation coefficient (see Supplementary Material).
5.3 Transfer Learning
Consistent with best practices in NLP, we train our model with transfer learning (Ruder et al. Reference Ruder, Peters, Swayamdipta and Wolf2019; Laurer et al. Reference Laurer, van Atteveldt, Casas and Welbers2024). Rather than starting the training process from scratch, we begin with estimates from a model trained for general tasks on a large corpus different from ours that we subsequently “fine-tune” to our specific needs. Specifically, we use the multi-qa-mpnet-base-cos-v1 model from the sentence-transformers library, trained for two tasks: (i) prediction of randomly masked words in short sentences and paragraphs from a large corpus of general text, and (ii) semantic search on a dataset of 215 million question–answer pairs from various online forums. Among the question-answering models available in the sentence-transformers library, this model achieves the highest performance in semantic search over six benchmark datasets. We fine-tune the model on five percent of the exchanges, sampled uniformly at random from the corpus without stratification, reserving one percent as a validation set to optimize training hyperparameters. We use the remaining 94% for inference.
Fine-tuning consists of further updating the pre-trained model’s parameters to improve its performance on our specific corpus and task.Footnote 2 This is desirable because politicians are unlikely to answer questions in QP the same way users of online forums would. Nevertheless, the pre-trained model encodes general language patterns and a general understanding of semantic search and question answering. This foundational knowledge can accelerate the learning of domain-adapted embeddings at minimum cost, with studies showing that fully custom models typically offer no systematic improvements over fine-tuned models (e.g., Arslan et al. Reference Arslan, Allix, Veiber, Lothritz, Bissyandé, Klein and Goujon2021). Fine-tuning is also advantageous as we reserve most of our corpus for inference, leaving us with insufficient data to train a model from scratch. Finally, using a pre-trained model is an implicit form of regularization, reducing overfitting and improving generalizability.
Alternatively, we could use embeddings from the pre-trained model without any fine-tuning. This approach poses a risk: the model might ascribe a poor quality to some answers, not due to their inherent irrelevance but because it is unaccustomed to how politicians reply in political Q&As. In contrast, our goal is to assess how effectively a model familiar with the context can accurately match questions to their answers.
Admittedly, fine-tuning comes with some risks, too. One concern is that it may allow the model to learn evasion tactics and connect questions with their answers despite their poor quality. It would result in conservative estimates that artificially inflate answer quality. Indeed, if we ignored evasion tactics, answers previously deemed relevant may no longer be, while those initially considered irrelevant may become even more so. However, pure evasion will tend to result in replies unrelated to the original question. To draw an analogy, prisoners do not escape by remaining in their cell or even relocating to another but by leaving the prison grounds entirely, with their success depending on the guards losing track of their whereabouts. It raises doubts about the model’s ability to effectively learn such behavior, especially given its exposure to a limited number of question–answer pairs during fine-tuning, with only a portion involving evasion. It also highlights the paradoxical nature of “predictable evasion,” as an evasion strategy that we can easily associate with the question fails in its purpose.
To be sure, we compared the cosine similarity estimates between the pre-trained and fine-tuned models. We found a strong correlation between estimates from both models, with a 0.744 correlation coefficient.Footnote 3 On average, question–answer pairs with low cosine similarity estimates in the pre-trained model have even lower estimates in the fine-tuned model, and pairs with the highest cosine similarity have similar cosine similarity estimates in both models. This suggests that fine-tuning enhances the model’s ability to distinguish between relevant and irrelevant pairs without causing a general rise in cosine similarity estimates. Furthermore, substantive results from the pre-trained model provided in the Supplementary Material are consistent with those from the fine-tuned model.
5.4 Mean Reciprocal Rank
We optimize the model’s training hyperparameters based on its performance on the validation set as measured by the mean reciprocal rank (MRR), a standard metric for evaluating the accuracy of information retrieval systems (Jurafsky and Martin Reference Jurafsky and Martin2024, 311). We compute the MRR by averaging across all questions in the validation set the reciprocal of the rank of the correct answer among all candidate answers in the validation set, ordered by decreasing similarity to the query:
 $$\begin{align*}\text{MRR} = \frac{1}{\left|Q\right|} \sum_{i = 1}^{\left|Q\right|} \frac{1}{\text{Rank}_{i}}. \end{align*}$$
It is standard to set all ranks below a certain threshold to zero. Accordingly, we truncate all ranks below ten. The Supplementary Material contains MRR values for various training hyperparameter values and lists the training hyperparameters we retained.
The MRR accounts for the fact that our model ranks potential answers based on their likelihood of being correct. It aligns with our objective that correct answers attain the highest possible rank among candidate answers. In contrast, classification metrics like precision and recall aggregate all answers above a certain rank or threshold, such as all those above the tenth rank, treating cases in which the correct answer ranks first the same as those in which it ranks ninth.
6 Data
We analyze all exchanges that took place during QP from the 39th to the 43rd legislatures, a period spanning the fifteen years between the January 23, 2006 election and the September 20, 2021 election. This amounts to 58,343 exchanges, each consisting of a question and an answer. Our analysis focuses on questions from members of the four parties that have held official status at some point during our period of interest: the Bloc Québécois (BQ), the Conservative Party (CPC), the Liberal Party (LPC), and the New Democratic Party (NDP).Footnote 4 We construct our dataset from the official English transcripts published on the House of Commons website, which include professional translations of the interventions pronounced in French.
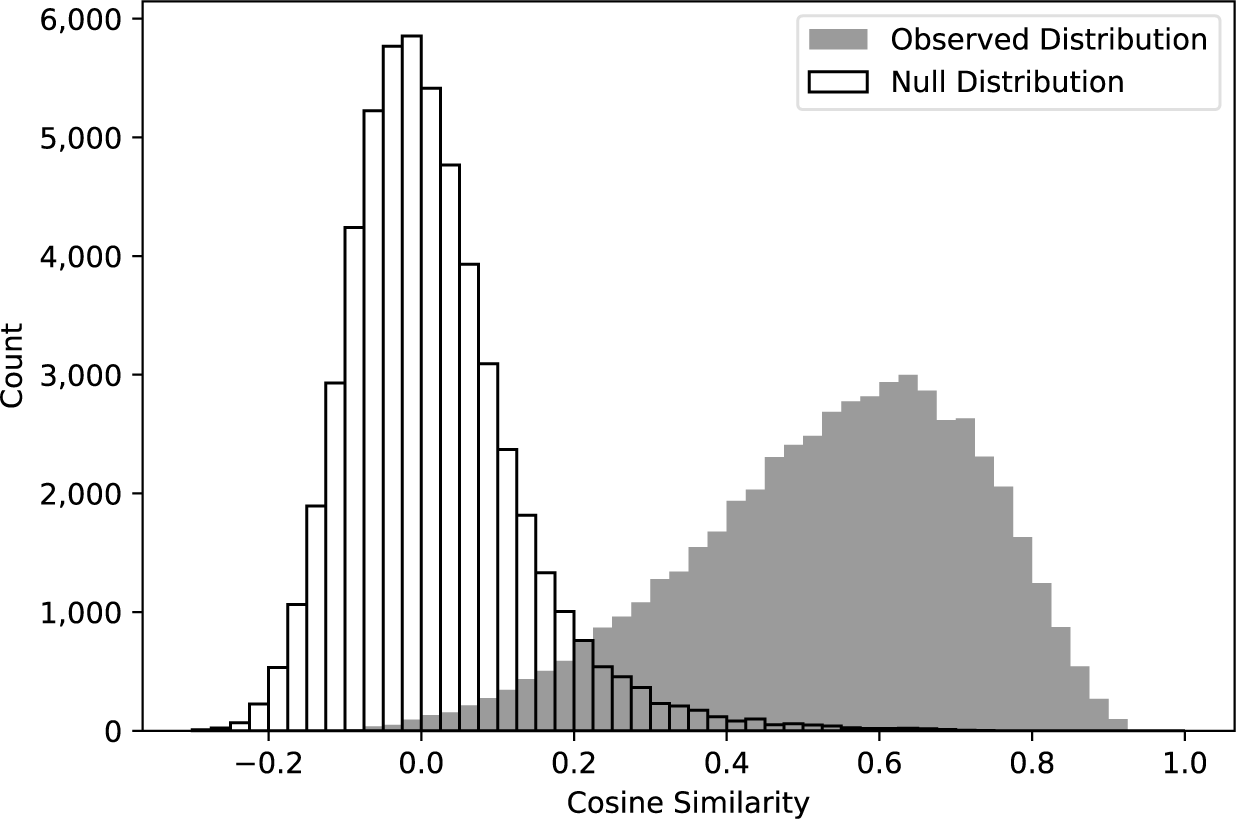
Figure 3 depicts the distribution of cosine similarity for all question–answer pairs in the inference set and a null distribution of the cosine similarity between randomly matched questions and answers. The observed distribution is approximately Gaussian with a notable negative skew, reflecting a larger share of answers having a relatively low level of relevance to questions compared to the share of answers with an equally high degree of pertinence. The answers with the lowest degree of germaneness are orthogonal to the questions. The observed distribution of cosine similarity differs markedly from the null distribution, implying that the observed answers are significantly more relevant than random replies. While this is a low standard, it ensures that the answers have at least a superficial relevance to the questions.

Figure 3 Distribution of the cosine similarity between questions and answers.
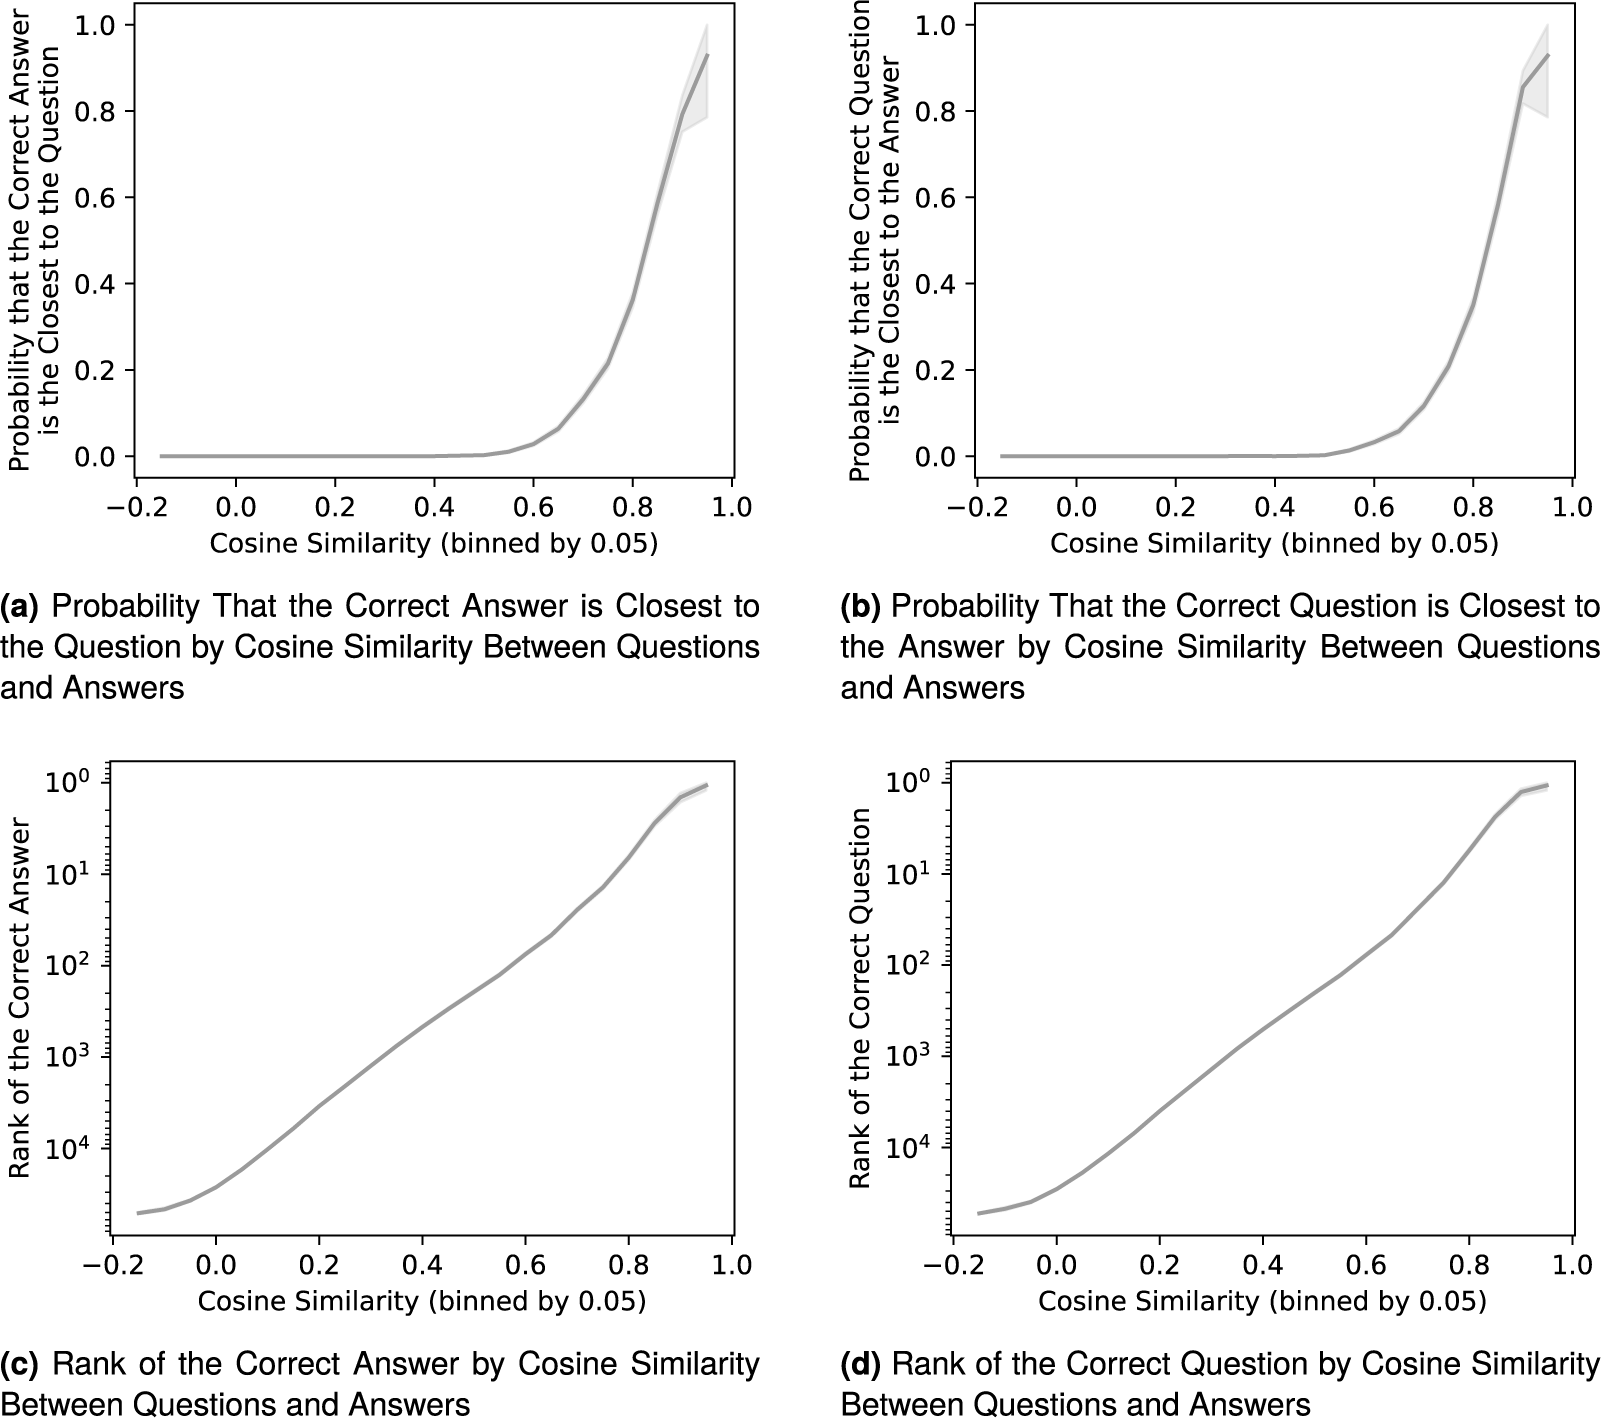
Figure 4 shows that the cosine similarity between questions and answers reflects two factors: (i) the likelihood that the embeddings of a given question–answer pair are closest to each other, and (ii) the ranking of the correct question or answer among all candidates. Additional figures in the Supplementary Material confirm the consistency of the cosine similarity across legislatures and the party affiliation of the MPs asking questions. This dispels concerns that the correlation between answer quality and variables of interest revealed below is merely an artifact of variations in model accuracy across these features.

Figure 4 Validity of the cosine similarity between questions and answers.
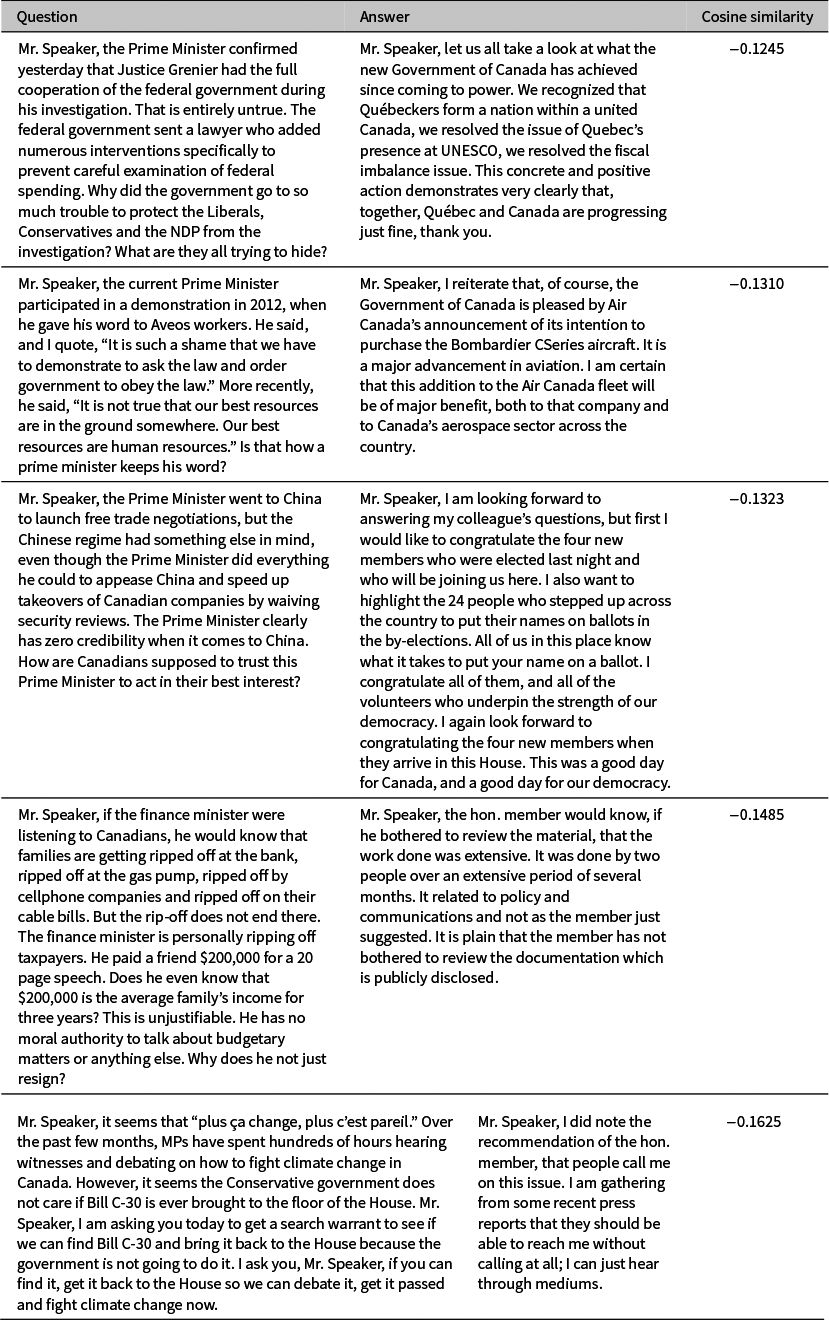
To illustrate what our measure of answer quality captures, Tables 1 and 2 present the five question–answer pairs with the lowest and highest cosine similarity, respectively. The exchanges with the lowest cosine similarity exemplify how a minister may fail to answer a question adequately. For example, the first two exchanges in Table 1 show ministers deflecting by underlining the government’s achievements on tangentially related topics. The third exchange underscores that not all irrelevant answers arise from manifest ill intent. The fourth answer superficially touches on the question using generic talking points. In the fifth exchange, the minister dismisses the question with humor. Finally, only the second question suffers from poor framing, confirming that low-quality answers do not stem from poorly framed questions.
Table 1 Five exchanges with the lowest cosine similarity between questions and answers.

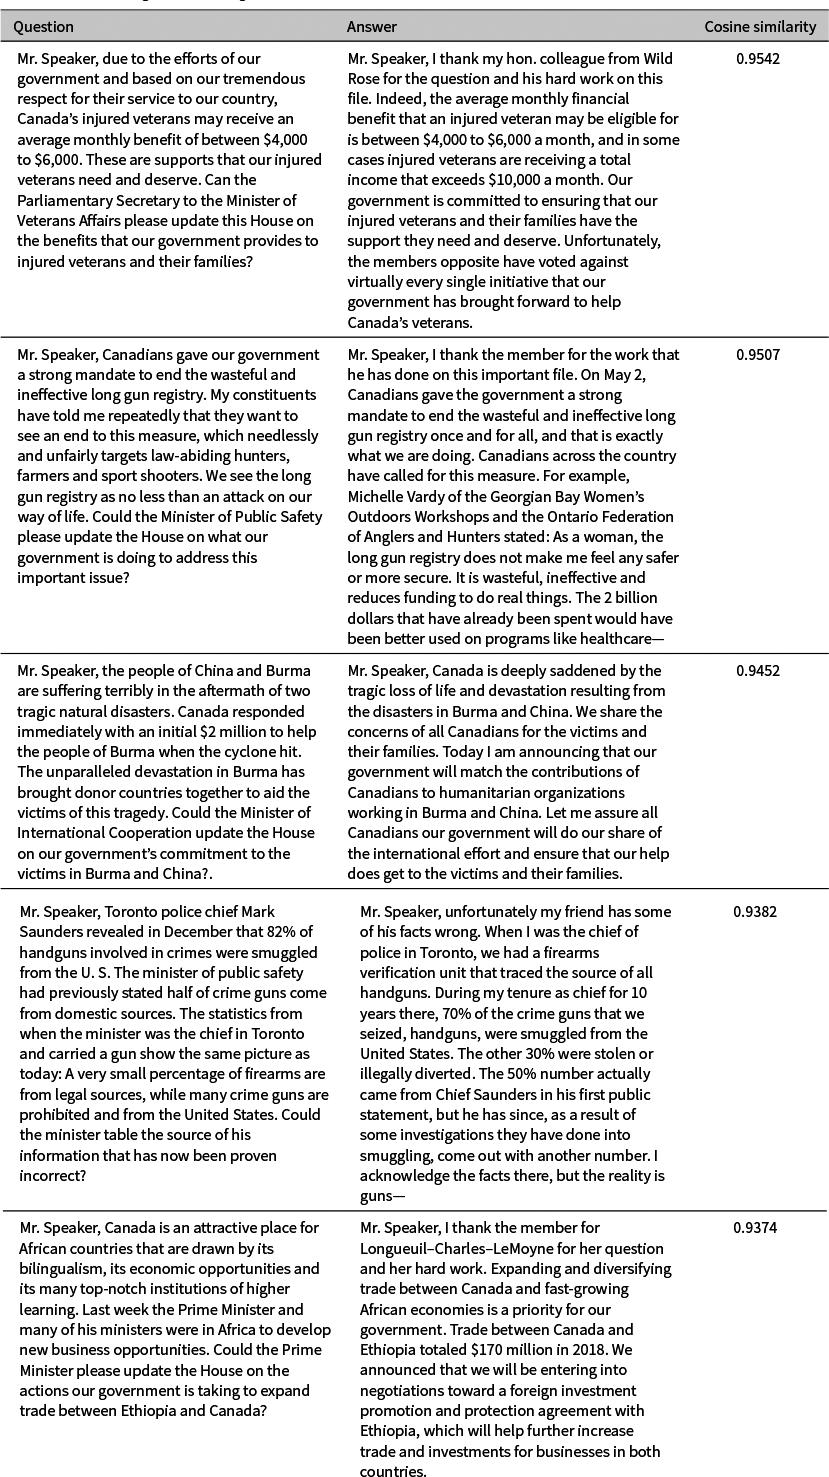
In contrast, the five exchanges in Table 2 feature detailed and precise answers. Many of the questions in these exchanges are emblematic of “planted questions.” We expected these questions and answers to exhibit high similarity. However, it is unclear how these questions contribute to effective government accountability, underscoring the difficulty of operationalizing answer quality given QP’s multiple functions. Nonetheless, the fourth exchange demonstrates that even a high-quality answer can challenge the question’s premises, indicating that our measure of answer quality does not merely reflect collusion between the questioner and the respondent.
Table 2 Five exchanges with the highest cosine similarity between questions and answers.

7 Validity Experiment
To assess the validity of our measure of answer quality, we compare it to labels produced by manually labeling a random sample of 500 question–answer pairs from the inference set. The labeling process follows the methodology used by Bates et al. (Reference Bates, Kerr, Byrne and Stanley2012) and Bull and Strawson (Reference Bull and Strawson2019). In particular, we classify each answer into one of three categories:
-
(i) Full reply: An answer that thoroughly provides the requested information and/or conveys explicitly the government’s position on the issue.
-
(ii) Intermediate reply: An answer that expresses the politician’s views implicitly rather than explicitly and/or addresses only one part of a multi-pronged question.
-
(iii) Non-reply: An answer that fails to address the question, instead diverting to an unrelated topic, omitting the requested information, and/or withholding the government’s stance on the issue.
In this validity experiment, our goal is not to show a perfect correlation between our measure and the benchmark labels, as they reflect different conceptions of answer quality. This would also imply that our methodology is redundant. Still, we expect our measure to align moderately with existing conceptions of answer quality, especially since the traits they encompass generally make it easier to recognize answers. Accordingly, we expect full replies to receive, on average, higher quality estimates than intermediate replies, which, in turn, should receive higher average estimates than non-replies. If this holds, it would confirm that our measure can be relied upon to capture meaningful variations in answer quality. This experiment also defines reference points for interpreting cosine similarity values, though we must use them cautiously to avoid misleading comparisons.
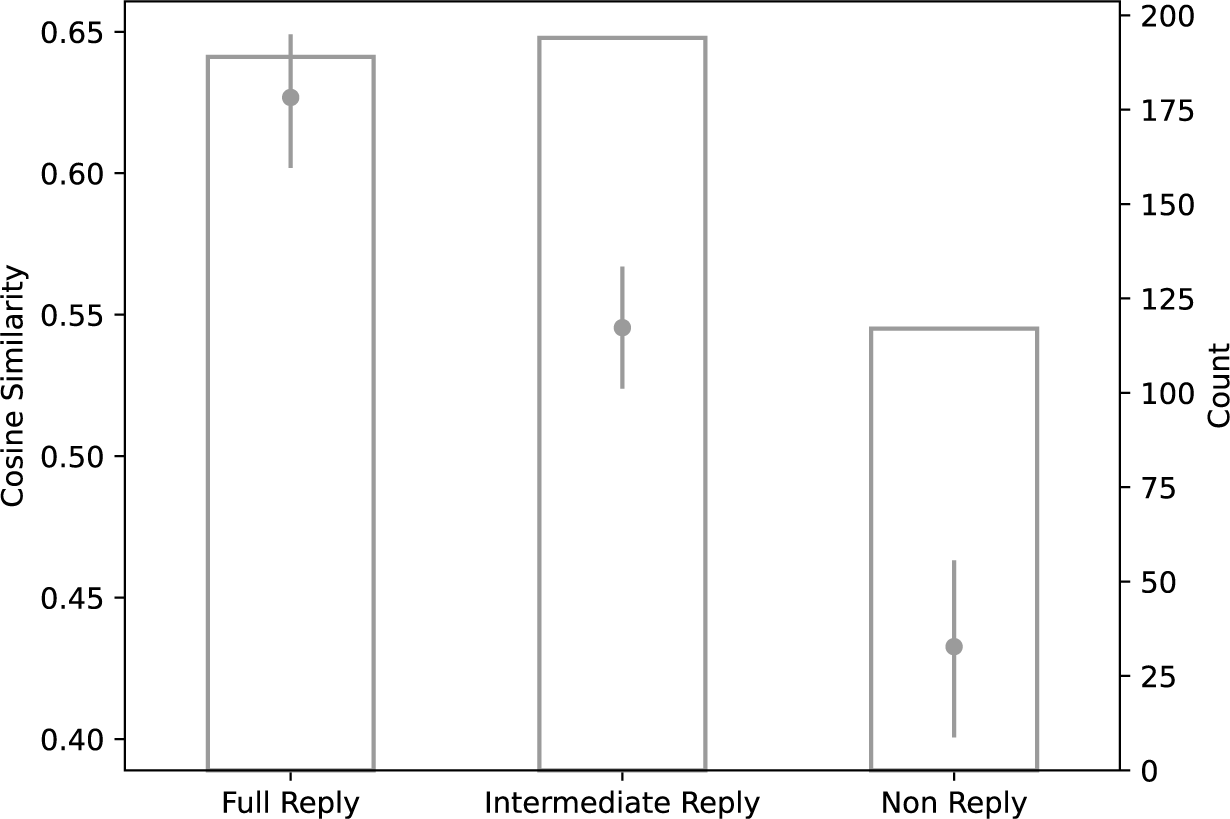
Figure 5 illustrates the results of this experiment, showing the average cosine similarity (on the left axis) and the observation count (on the right axis) for each reply category.Footnote 5 The differences in average cosine similarity across all categories are statistically significant at the 95% confidence level, implying that our measure of answer quality aligns with the previously defined taxonomy of replies while offering a complementary perspective.

Figure 5 Average cosine similarity between questions and answers and count by reply category.
The difference between the average cosine similarity for full replies (0.627) and non-replies (0.433) is small relative to the range of cosine similarity estimates across all pairs. In addition, the average cosine similarity for intermediate replies (0.545) is nearly equal to that for the entire inference set (0.539), suggesting that the typical answer falls into this intermediate category. Notably, the average cosine similarity for non-replies is significantly above zero and nears the upper bound of the null distribution, indicating that non-replies are generally more relevant than random answers.
8 Hypotheses
We now turn to the relationship between the quality of answers and relevant variables. This analysis seeks to understand the behavior of QP participants and, specifically, identify factors associated with more relevant answers. It is also a test of our measurement approach’s face validity: if none of the expected correlations materialize, it might suggest that our methodology does not effectively capture answer quality.
We focus our analysis on the relationship between the quality of answers and power dynamics in the House of Commons. We propose three hypotheses:
-
(i) When the government has a minority of seats in the House of Commons, its answers tend to be more relevant.
-
(ii) The relevance of answers varies with MPs’ party affiliation, favoring government backbench members and those from parties with which the government is closer ideologically.
-
(iii) The relevance of answers to questions from opposition parties varies with the size of their caucus.
The first hypothesis stems from the premise that a minority government has more incentives to collaborate with opposition parties since its survival hinges on their support in confidence votes. In this context, inadequate answers to the opposition’s questions risk alienating them and jeopardizing the government’s stability.
The second hypothesis suggests that the LPC, for example, may provide higher-quality answers to questions from the NDP than those from the CPC. Additionally, government backbenchers asked 4,061 (7.4 $\%$
) questions in the inference set. These questions are often “planted questions,” that is, friendly, prearranged questions meant to highlight the government’s achievements or criticize the opposition rather than scrutinize the government’s actions. We expect a high similarity between these questions and their answers.
$\%$
) questions in the inference set. These questions are often “planted questions,” that is, friendly, prearranged questions meant to highlight the government’s achievements or criticize the opposition rather than scrutinize the government’s actions. We expect a high similarity between these questions and their answers.
The third hypothesis considers how the size of an opposition party’s caucus influences the quality of government answers. The direction of this relationship is initially ambiguous. On the one hand, a larger caucus could enhance the party’s ability to secure high-quality answers by boosting its influence on confidence motions. On the other hand, a larger caucus may heighten competition with the government, prompting the opposition party to adopt a more aggressive questioning style and, in turn, cause the government to prioritize counterattacks over addressing the questions’ substance, ultimately reducing the quality of answers.
Note that our analysis does not establish a causal relationship between answer quality and variables of interest. In particular, it is crucial to acknowledge the questions’ endogeneity. In this context, the incentives of the government and opposition parties both influence answer quality. We must account for this when interpreting our findings.
9 Results
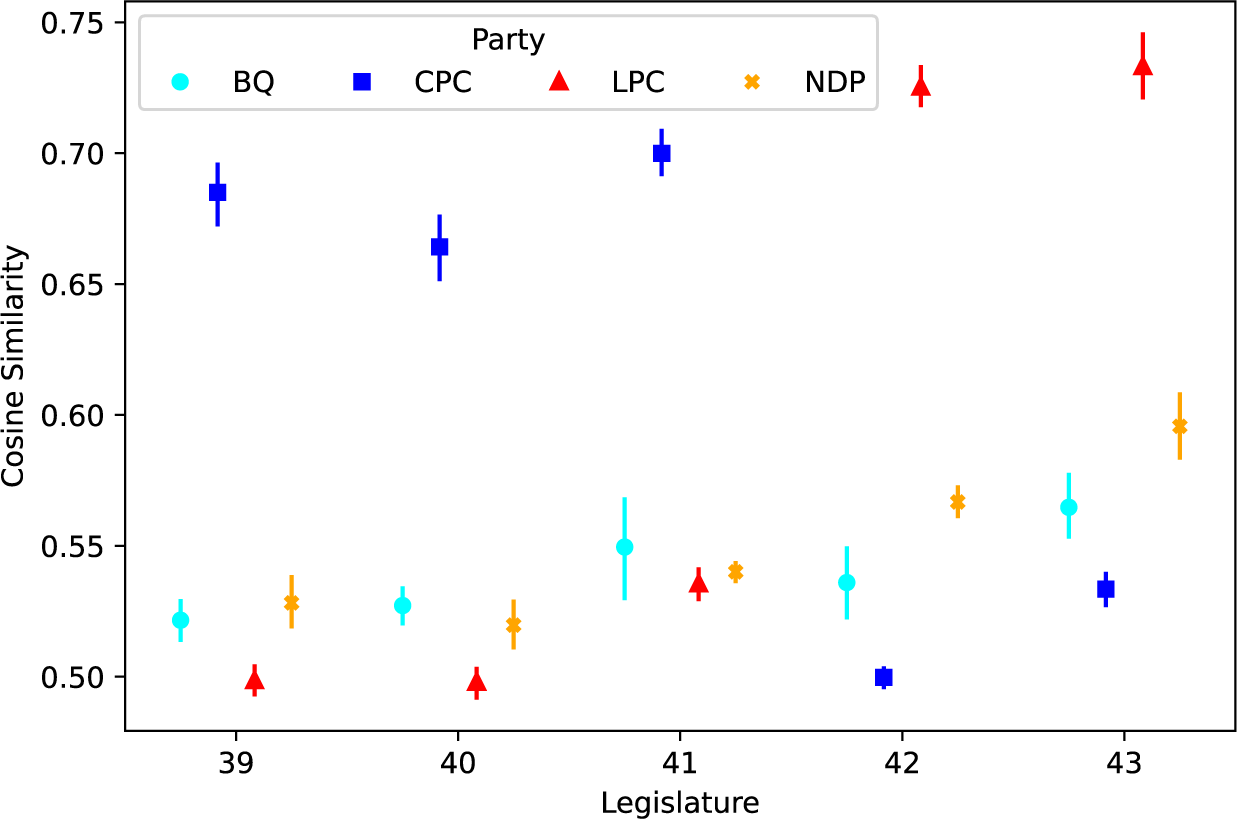
In this section, we describe the results of our analysis. Figure 6 illustrates the evolution of the average cosine similarity between questions and answers conditional on the party affiliation of the MP asking the question across the five legislatures within our period of interest. For context, the CPC held office between the 39th and 41st legislatures, whereas the LPC held office during the 42nd and 43rd legislatures. Also, minority governments held office during the 39th, 40th, and 43rd legislatures.

Figure 6 Average cosine similarity between questions and answers by party and legislature.
We draw four conclusions. First, answers to questions from government backbenchers have, on average, a much higher quality than those to questions from opposition members. The difference in the relevance of answers to questions from government backbenchers compared to opposition MPs is much greater than the difference in the relevance of answers to questions from members of various opposition parties. We expected this since members of the ruling party are unlikely to ask questions that would embarrass or hurt the government they belong to. As noted earlier, it is common for ministerial aides to arrange for government backbenchers to ask friendly questions. Our finding gives credence to the belief that this is a common practice.
Second, there is mixed evidence regarding the hypothesized relationship between the quality of answers and whether the government holds a minority or majority of seats in the House of Commons. Comparing the 39th and 40th legislatures to the 41st, it seems that the CPC offered, on average, more relevant answers to questions from the opposition when it held a majority of seats in the House of Commons, contrary to our hypothesis. On the other hand, comparing the 42nd and 43rd legislatures, we find that the LPC offered, on average, more relevant answers to questions from the opposition when it held a minority of seats in the House. However, the 43rd legislature coincided with the COVID-19 pandemic, which likely affected the nature of the questions and the government’s inclination to answer them transparently. Given this ambiguous evidence, we do not consider that the data confirms our hypothesis.
Third, third-party MPs receive, on average, more relevant answers than MPs from the official opposition. During the 39th, 40th, 42nd, and 43rd legislatures, the quality of answers to questions from members of third parties was significantly higher than the quality of answers to questions from members of the official opposition. The outcomes from the 41st legislature, the first and only time the NDP formed the official opposition, further illustrate this. During that period, answers to members of the NDP were no different in quality from those given to members of the LPC. In contrast, there were statistically significant differences during the previous two legislatures. Figures in the Supplementary Material further support this finding, showing a statistically significant negative correlation between cosine similarity and the number and share of seats opposition parties hold. We attribute this difference to the fact that the media and public tend to see the official opposition as the “government-in-waiting,” positioning it in direct competition with the government. It can lead the official opposition to be more antagonistic and assertive in questioning the government and the latter to be more hostile and reticent in answering its questions.
Fourth, the difference between answers to questions from the official opposition and third parties is smaller than the variations in responses to questions from different opposition parties attributable to their perceived ideological proximity to the government. For example, during the 42nd and 43rd legislatures, questions from NDP members have received much more relevant answers, on average, than those from all opposition parties before and in the same period. This relationship was particularly pronounced during the 43rd legislature when the LPC held a minority of seats in the House of Commons and heavily relied on the NDP to survive motions of confidence. Over that period, the representation of the NDP in the House of Commons was comparable to its representation during the 39th and 40th legislatures and the LPC’s during the 41st legislature. Thus, we can impute this pattern to variations in the relative size of the NDP’s caucus.
10 Conclusion
This paper proposes a novel approach for measuring answer quality, drawing inspiration from semantic search, a core task in NLP and information retrieval. Our methodology consists of assessing the quality of an answer by how easily and accurately it can be recognized from a random set of candidate answers given the question’s text. This measure reflects the relevance of answers to questions. It is valuable for assessing the efficacy of QP as an accountability and oversight mechanism. A key advantage of our approach is that we can computationally implement it by fine-tuning a language model on the corpus of observed questions and answers without human-labeled data, making it highly efficient for analyzing large corpora.
We showcased our methodology by studying QP in the Canadian House of Commons. Our findings imply that we should not consider QP as a time when government ministers innocently deliver plain answers to every question. Nor should we dismiss it as a stage for opposition MPs and government ministers to engage in political messaging and deliver essentially independent speeches disguised as questions and answers. Indeed, while our findings showed that some answers have a vague semantic connection to questions, suggesting some evasion or obfuscation, answers are generally moderately relevant to the questions asked, more so than if the government responded randomly. Therefore, in line with its stated purpose, QP effectively allows MPs to elicit relevant answers from the government.
Our measurement approach also allowed us to identify correlates of answer quality. Our analysis revealed a significant correlation between the quality of answers and the party affiliation of the MP asking questions, with questions from government backbenchers, MPs from third parties (as opposed to the official opposition), and those from parties ideologically closer to the government tending to receive more relevant answers. These findings underscore the substantive value of our measurement approach and provide strong evidence of its validity.
To complement our main study, the Supplementary Material contains an analysis of the correlation between the quality of answers and the topics of the questions, alongside two robustness checks. The first considers potential bias from sampling error in estimating latent representations. The second investigates the impact of including exchanges initiated by government backbenchers in the training set on our findings. The results from both robustness checks affirm our conclusions.
In conclusion, the measurement approach proposed in this article could apply to many other contexts within and beyond political science. Its applicability to institutions similar to QP, such as the United Kingdom’s Prime Minister’s Questions and France’s Questions au Gouvernment, is evident. This methodology can also be used to analyze parliamentary hearings, election debates, and press conferences, including in the United States. Beyond political science, this approach could be valuable for analyzing news interviews with non-political public figures, press conferences by central bankers, or investor calls by executives of publicly traded companies. We encourage researchers to adopt this approach to study their institutions of interest and test their hypotheses. In doing so, they may find some refinements or adjustments to the methodology necessary. One area for further investigation is follow-up questions, particularly in unmoderated or less structured settings. To accurately assess the quality of answers to those questions, it may be necessary to consider a broader context, including prior questions.
Author Contributions
J.M. contributed to this study by developing the methodology, conducting the empirical analysis, and coordinating the drafting of the manuscript. R.M.A. was involved in the conceptualization of the study, contributed to the writing of the manuscript, and managed project administration.
Funding Statement
The authors declare none.
Conflicts of Interest
The authors declare none.
Ethical Standards
This study did not include research involving human participants.
Data Availability Statement
Replication code and data for this article is available at Morrier and Alvarez (Reference Morrier and Alvarez2025). A preservation copy of the same code and data can also be accessed via Dataverse at https://doi.org/10.7910/DVN/MXNQ7F.
Supplementary Material
For supplementary material accompanying this paper, please visit https://doi.org/10.1017/pan.2025.10007.