


Moderate acute malnutrition (MAM) continues to be a global problem affecting an estimated 31 million children worldwide(1). These children have an increased risk of infection, progression to severe acute malnutrition and death and 5 % of all deaths in children under the age of five can be attributed to MAM(1,Reference Black, Victora and Walker2) . Inadequate diets and infections can lead to iron deficiency and anaemia, and if energy intake is also low it may eventually result in MAM. This results in higher prevalence of iron deficiency and anaemia in children with MAM(Reference Black, Victora and Walker2). In children under the age of five years, iron deficiency anaemia is most frequent in sub-Saharan Africa with a prevalence of 32 %. This is due to inadequate iron intake, the high phytate content of the diet resulting in low bioavailability of iron and reduced intestinal absorption because of infections(Reference Black, Victora and Walker2,Reference Lemoine and Tounian3) . Iron metabolism is regulated by hepcidin, a peptide hormone produced by hepatocytes, and regulated through a negative feedback loop(Reference Nemeth and Ganz4). High iron concentration in the periportal blood increases the production of hepcidin, which in turn reduces the intestinal absorption of iron and reduces the release of recycled iron from both macrophages and hepatocyte storage(Reference Nemeth and Ganz4). Conversely, iron deficiency leads to down-regulation of hepcidin to increase intestinal iron absorption and macrophage and hepatocyte release.
Inflammation also regulates hepcidin as interleukin-6 stimulates hepcidin synthesis, which leads to reduced iron availability(Reference Nemeth and Ganz4). This increase in hepcidin during inflammation may serve as a host defence strategy to prevent growth of iron-dependent microbes such as malaria parasites(Reference Nemeth and Ganz4). According to the WHO, the African region accounts for 94 % of cases and 95 % of the deaths from malaria and, of these, 78 % were children under the age of five years(5). In a general child cohort, malaria had a particularly strong effect on serum levels of hepcidin (s-hepcidin) as both symptomatic and asymptomatic infection with Plasmodium falciparum increased s-hepcidin(Reference Atkinson, Uyoga and Armitage6). There is a major overlap between malaria and MAM in sub-Saharan Africa, both of which may contribute to iron dysregulation. However, there is little knowledge about the interplay between malnutrition and malaria in the regulation of s-hepcidin, which could affect iron uptake from food. Furthermore, the effect of different food supplements in normalising iron status is needed to optimally treat children with MAM. Therefore, the aim of our study was to assess the association between s-hepcidin and anthropometry, inflammation, malaria and iron status in children aged 6–23 months in children with MAM and to evaluate the effect of food supplementation on s-hepcidin.
Methods
Study settings, design and participants
This study is based on data and cryopreserved samples from a randomised trial, Treatfood, which was carried out in 2013–2014. The trial had a 2×2×3 factorial design stratified on study site and was conducted in children with MAM, evaluating the effects of 12 weeks of fortified food supplement providing 500 kcal/d and 12 mg/d of iron(Reference Iuel-Brockdorf, Draebel and Ritz7). The children were randomised to 12 different food supplements with either corn–soy blend (CSB) or lipid-based nutrient supplement (LNS); with either dehulled soy or soy isolate; and with either 0 %, 20 %, or 50 % of protein from dried skimmed milk. The blinding and randomisation have previously been described(Reference Fabiansen, Yameogo and Iuel-Brockdorf8). Treatfood was conducted in Burkina Faso at five different governmental health centres in Province du Passoré, Northern Region, where the catchment area included 143 villages with a total population of approximately 258 000. The children in the area were screened by either community health workers or local screening teams using either mid-upper arm circumference (MUAC) or both MUAC and weight-for-length z-score (WLZ). Children could also be referred from a local health centre or come on caretaker’s initiative. The children were assessed on site and were eligible for inclusion if they were 6–23 months, had MAM (MUAC ≥ 115 mm and < 125 mm and/or WHZ ≥ –3 and < –2), were resident in the catchment area and if the caretakers gave informed consent. They were excluded if they were enrolled in another nutritional programme, if they needed hospitalisation or had been hospitalised or treated for severe acute malnutrition in the last 2 months, if they had very low haemoglobin (< 4 g/dl) or evidence of decompensated anaemia or if they had a suspected allergy to either milk, peanuts, CBS or LNS.
Data collection
At baseline, the study nurse collected information on sociodemographics, breastfeeding and two-weeks history of illness using structured questionnaires and performed a clinical examination. Breastfeeding was defined as any current breastfeeding. Any illness in the last two weeks was based on both medical history and clinical examination. Fever was defined as axillary temperature ≥ 37·5°C. If the children were not up to date with vaccinations in the current vaccine programme, they were referred to a health centre. A single dose of vitamin A (100 000 IU if 4–8 kg body weight; 200 000 IU if > 8 kg body weight), albendazole (200 mg if < 8 kg body weight; 400 mg if > 8 kg body weight) or both was given if this had not been given in the last 6 months. The children were followed every two weeks with duplicate measures of anthropometrics. MUAC was measured to the nearest 1 mm on the left arm using a standard measuring tape, weight was measured to the nearest 100 g using an electronic scale (Seca model 881 1021659, Hamburg, Germany) and length was measured to the nearest 1 mm using a wooden length board. STATA (Stata Corp) package ‘zscore06’, which uses WHO anthropometric reference, was used to calculate weight-for-age z-score, WLZ and length-for-age z-score (LAZ). Stunting was defined as LAZ < –2.
Blood collection and analyses
At baseline and after 12 weeks, a 2·5 ml venous blood sample was collected. One drop was used for a malaria rapid diagnostic test (RDT) based on P. falciparum histidine-rich protein two antigen (SD Bioline Malaria Ag Pf, Abbott Diagnostic Korea Inc, Yongin, South Korea), and one drop was used for determination of haemoglobin (HemoCue device, Hb 301, Ängelholm, Sweden). A clot activator sample tube was used for the remaining blood (Becton Dickinson, reference #268,392). The tube was stored at 2–8°C during transport, and at the trial lab it was centrifuged at 700×g (EBA 20 S Hettich) after which serum was isolated and stored at −20°C during shipment to VitMin Lab in Willstaedt, Germany, and then at −80°C until analysis. At VitMin Lab, a combined sandwich enzyme-linked immunosorbent was used to measure serum C-reactive protein (CRP), α 1-acid glycoprotein (AGP) and ferritin(Reference Erhardt, Estes and Pfeiffer9). All samples were measured in duplicate, and the intra- and inter-assay coefficients of variation were < 10 %. Serum ferritin was adjusted for inflammation using regression models as previously described(Reference Cichon, Ritz and Fabiansen10). The cutoffs for categorical analyses of these variables were 110 g/l for haemoglobin(11); 2, 5, 10 and 50 mg/l for CRP(Reference Erhardt, Estes and Pfeiffer9,Reference Kushner and Antonelli12) ; 0·8, 1·0 and 1·2 g/l for AGP(Reference Raiten, Sakr Ashour and Ross13,Reference Friis, Cichon and Fabiansen14) ; 12 and 24 µg/l for serum inflammation-corrected ferritin (s-FeCI)(11,Reference Friis, Cichon and Fabiansen14) and 8·3 mg/l for soluble transferrin receptor (sTfR)(Reference Erhardt, Estes and Pfeiffer9). Symptomatic malaria was defined as positive malaria RDT in a child with fever, whereas positive malaria RDT without fever was interpreted as either asymptomatic or recently cured malaria. Serum hepcidin was measured at Copenhagen University Hospital, Denmark, by mass spectrometry as previously described(Reference Castberg, Sarbah and Koram15). The level of quantification was in the interval 0·6–13·9 nM with a coefficient of variation of < 11 %. Samples with s-hepcidin >13·9 nM were diluted to obtain exact measurements.
Statistical analysis
Data were double entered into Epidata 3·1 software (Epidata Association, Odense, Denmark) and all statistical analyses were carried out using STATA 12 and STATA 18.
Baseline
Baseline characteristics were summarised as % (n) for categorical data, mean (sd) for normally distributed and median (interquartile range, IQR) for non-normally distributed quantitative variables based on visual inspection of histograms and probability plots. S-hepcidin as a function of sex and age was assessed using fractional polynomials with 95 % confidence intervals. Log10 transformed Tobit regression was used to assess the association between s-hepcidin and admission criteria, anthropometry, breastfeeding, clinical and paraclinical markers of inflammation and markers of iron status, both with and without age and sex adjustment. Tobit regression was used to take left censoring into account due to the high number of values (38 %) under the limit of quantification(Reference McDonald and Moffitt16). The results were back transformed. Linear regression was used to assess the association between inflammation-adjusted ferritin and sTfR and admission criteria, anthropometry, breastfeeding and clinical and paraclinical markers of inflammation, both with and without age and sex adjustment. Linear regression was also used to assess the difference in CRP and AGP in those with and without malaria and/or fever. Interactions between anaemia and depleted iron stores as well as malaria and fever were assessed using likelihood-ratio test. Differences between those who had s-hepcidin measured and those who did not and between those who were lost to follow-up and those who were followed up were investigated using chi-squared for categorical variables, independent t test for normally distributed data and Wilcoxon rank-sum test for non-normally distributed data.
Follow-up
S-hepcidin at baseline and after 12 weeks for each supplementation group was summarised using median (IQR). The change between the two visits was estimated using mixed effects Tobit regression with log10 transformation and both site and ID as random effects and the results were back transformed. The effects of matrix, soy quality and amount of milk on s-hepcidin were assessed using mixed effects Tobit regression models with log10 transformation. Interaction between the factors was tested for three-way interactions using likelihood ratio tests, and where possible reduced to two-way interactions or main effects. The models were adjusted for sex, age, admission month, baseline MUAC, WLZ, LAZ and site as fixed effects and identification number as a random effect and the results were back transformed. Model assumptions were checked based on residual and normal probability plots and linearity of continuous variables.
Results
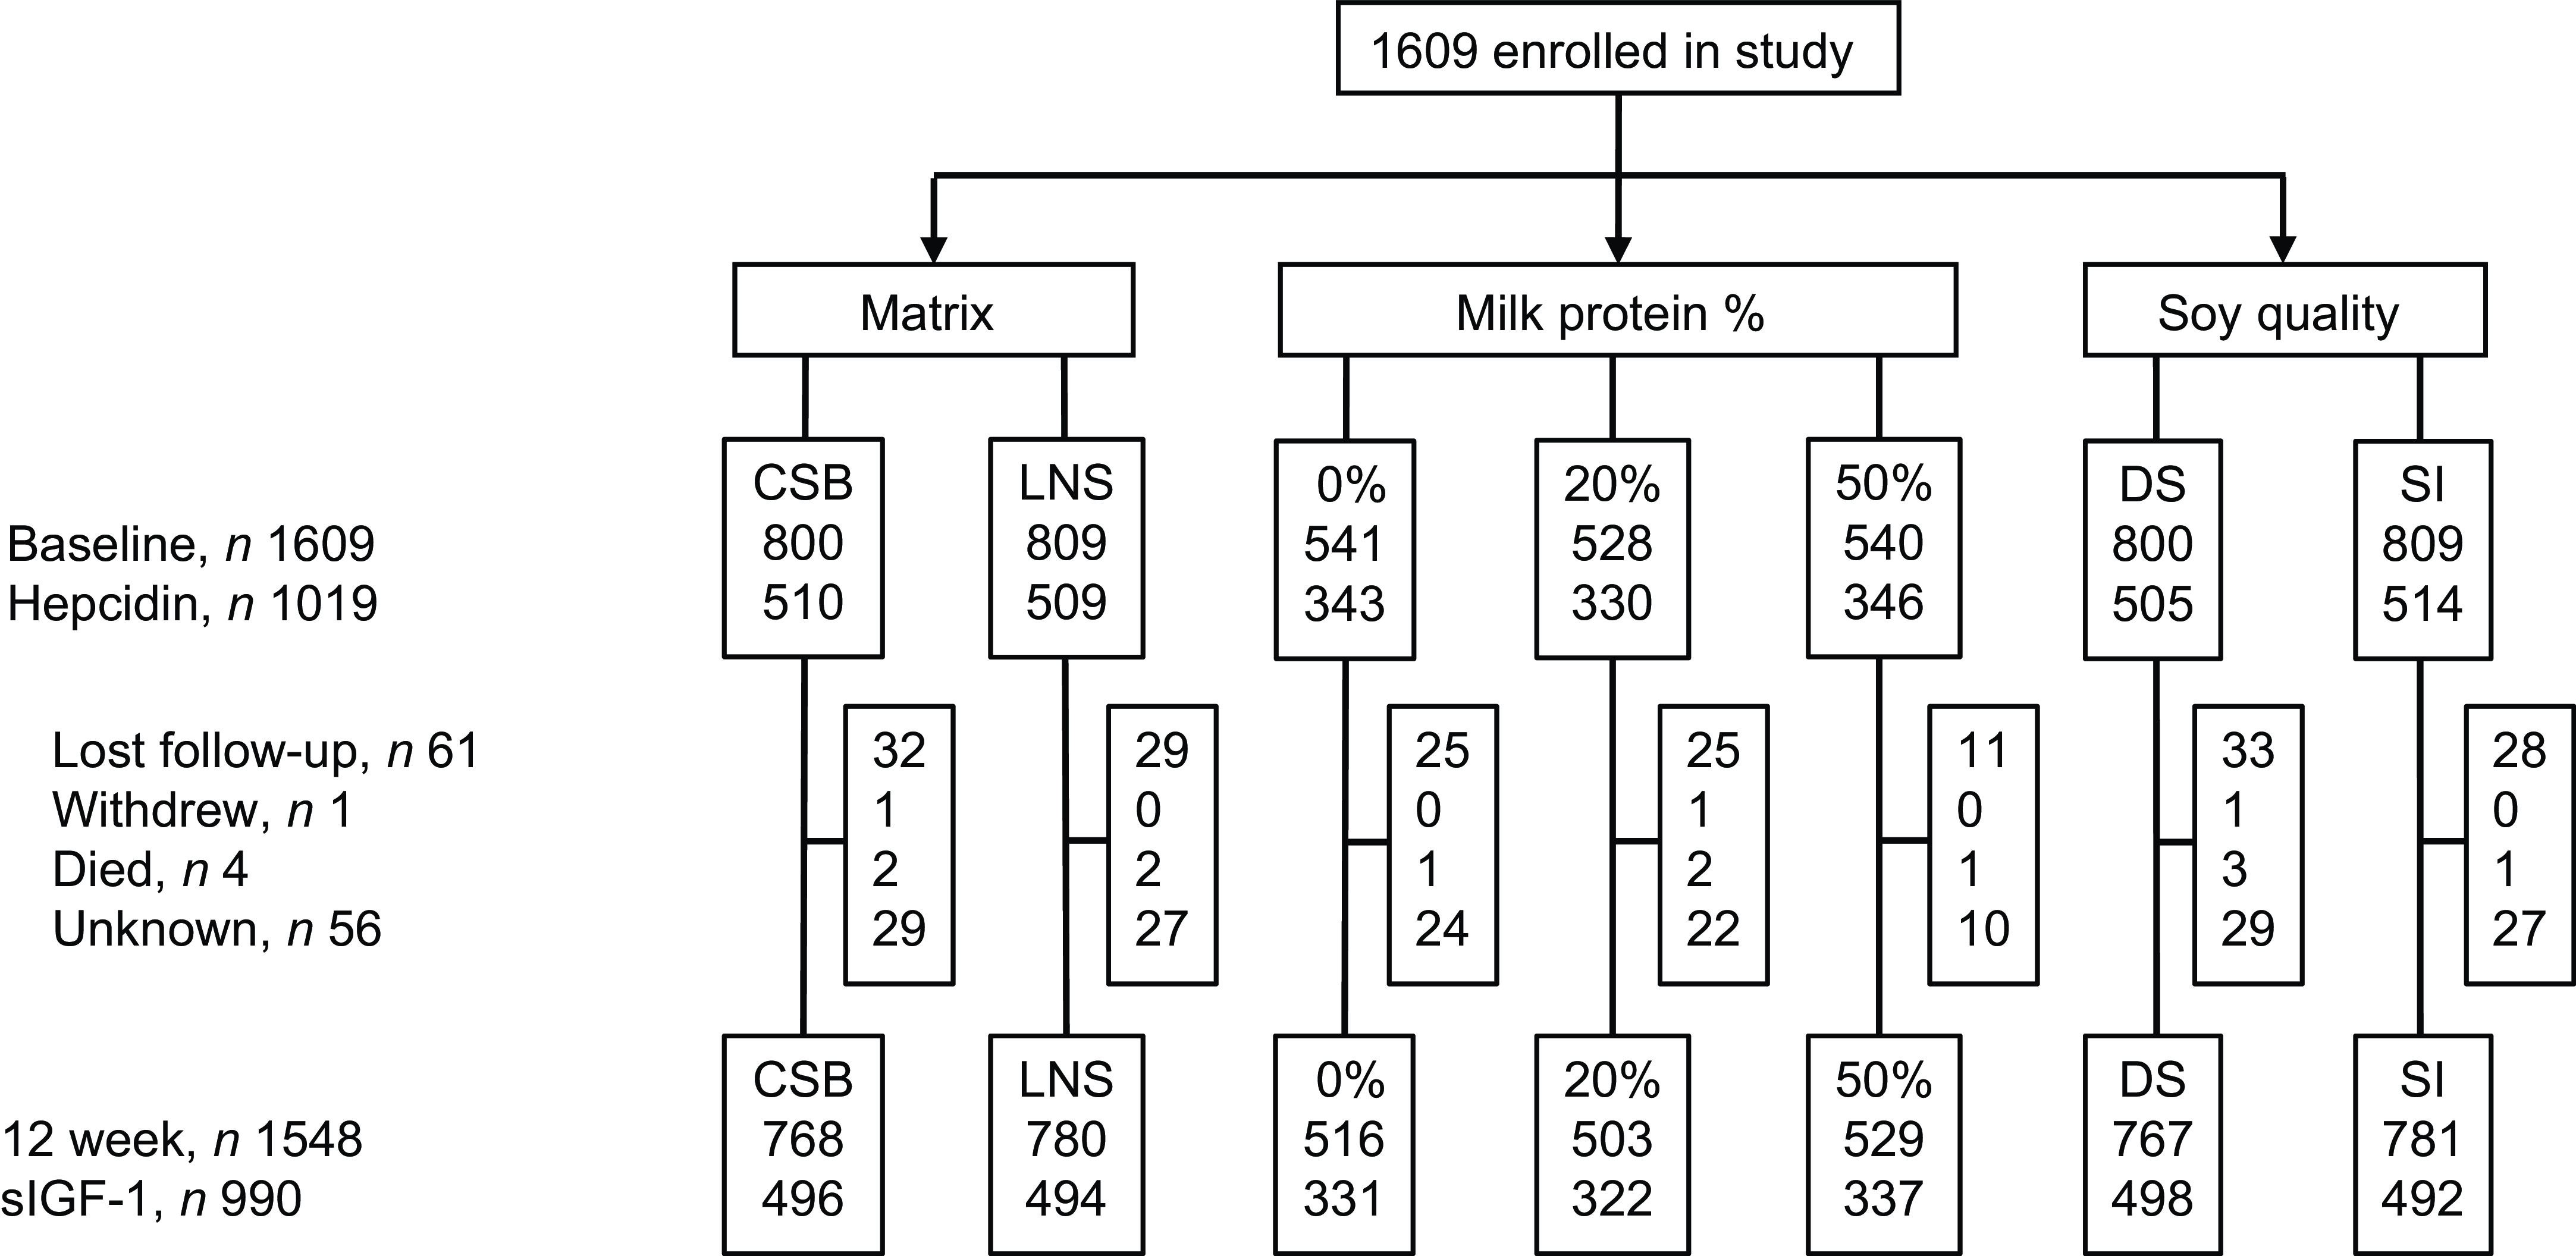
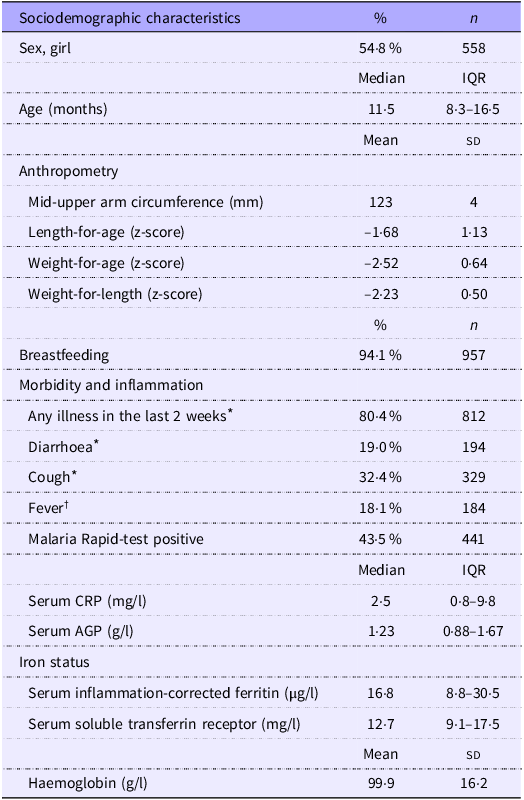
Of the 1609 children included in the TreatFood trial, 1019 (63 %) had s-hepcidin measured at baseline (Figure 1); insufficient serum was the main reason for missing s-hepcidin data. Their median (IQR) age was 11·5 months (8·3–16·5) and 54·8 % were females (Table 1). Low MUAC (≥ 115 mm and < 125 mm) was found in 78·8 % (803), low WLZ (WHZ ≥ –3 and < –2) was found in 71·6 % (730) and 36·4 % (371) were stunted. Those who had s-hepcidin measured were slightly older (11·5 v. 10·8 months, P = 0·008) and had higher s-FeCI compared with those who did not (16·8 v. 14·9 µg/l, P = 0·02). They were also more likely to have had any illness in the last two weeks (80 % v. 71 %, P < 0·001), to have had coughing in the last two weeks (32 % v. 24 %, P = 0·001), and to have a positive malaria RDT (44 % v. 35 %, P < 0·001). Other parameters were similar between those with and without s-hepcidin measurements.

Figure 1. Trial profile. CSB, corn–soy blend; LNS, lipid-based nutrient supplement; SI, soy isolate.
Table 1. Characteristics of 1019 children aged 6–23 months with moderate acute malnutrition (Percentages and numbers; median values and interquartile ranges; mean values and standard deviations)

Values are presented as % (n), mean (sd) or median (interquartile range).
Abbreviations CRP = C-reactive protein, AGP = α 1-acid glycoprotein.
* Based on maternal recall and physical examination at inclusion by trained study nurse.
† Based on physical examination at inclusion by trained study nurse. Fever is defined as temperature ≥ 37·5°C.
Correlates of serum hepcidin
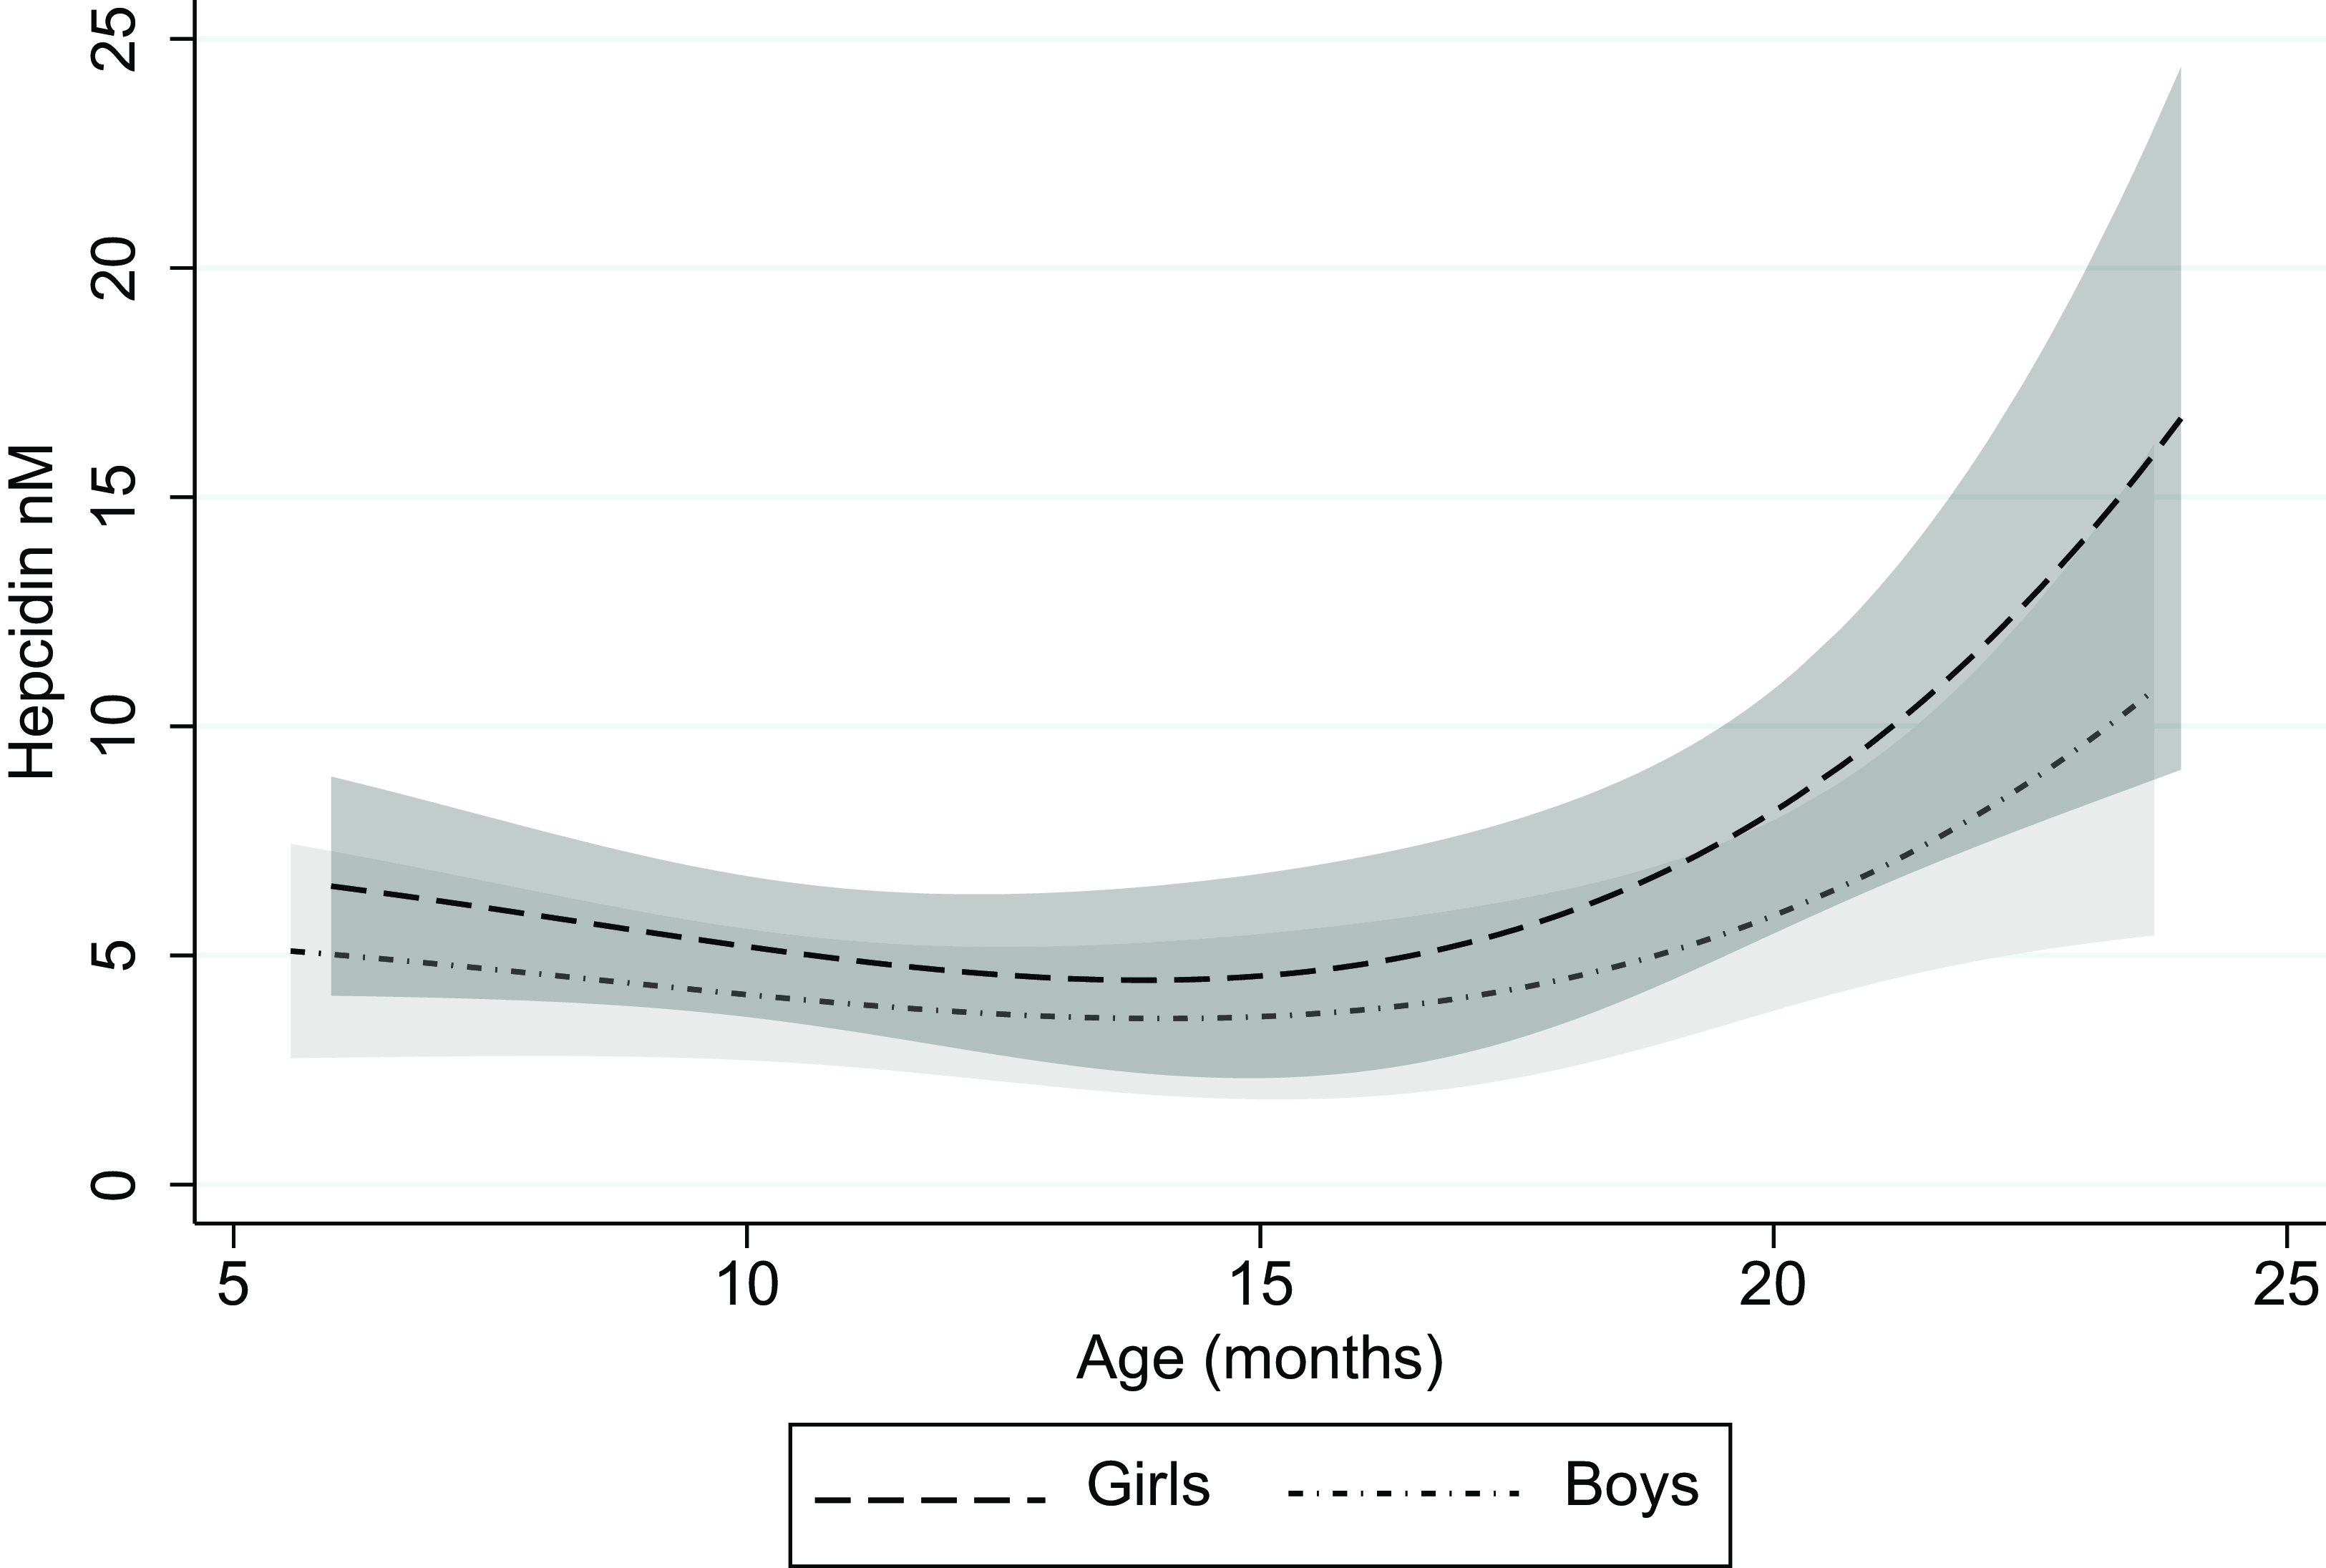
The median (IQR) s-hepcidin level was 1·3 nM (< 0·6–5·6) with 38 % of the values under the lower quantification level. S-hepcidin was 43 % (95 % CI 11, 85, P = 0·006) higher in females than in males, after adjustment for age (Table 2). From age 6 months, s-hepcidin decreased with nadir around 14 months, after which it increased to a maximum at 24 months (Figure 2). Those who were breastfed had 55 % (95 % CI 21, 74, P = 0·005) lower s-hepcidin than those who were not breastfed, after adjustment for age and sex. No associations were seen between anthropometric indicators and s-hepcidin. (Table 2 with age and sex adjustment and online Supplementary Table 1 without adjustments).
Table 2. Admission criteria, anthropometry and breastfeeding as correlates of serum hepcidin (nM) among 1019 children aged 6–23 months with moderate acute malnutrition (Median values and interquartile ranges; percentages and 95 % confidence intervals)

Abbreviations: MUAC = Mid-upper arm circumference, WLZ = = Weight-for-length Z-score.
Detection level for hepcidin is 0·6 nM. Associations were analysed by log10 transformed age- and sex-adjusted Tobit/linear regressions with back transformation, so the results are % differences.

Figure 2. Serum hepcidin as a function of age for boys and girls with 95 % CI.
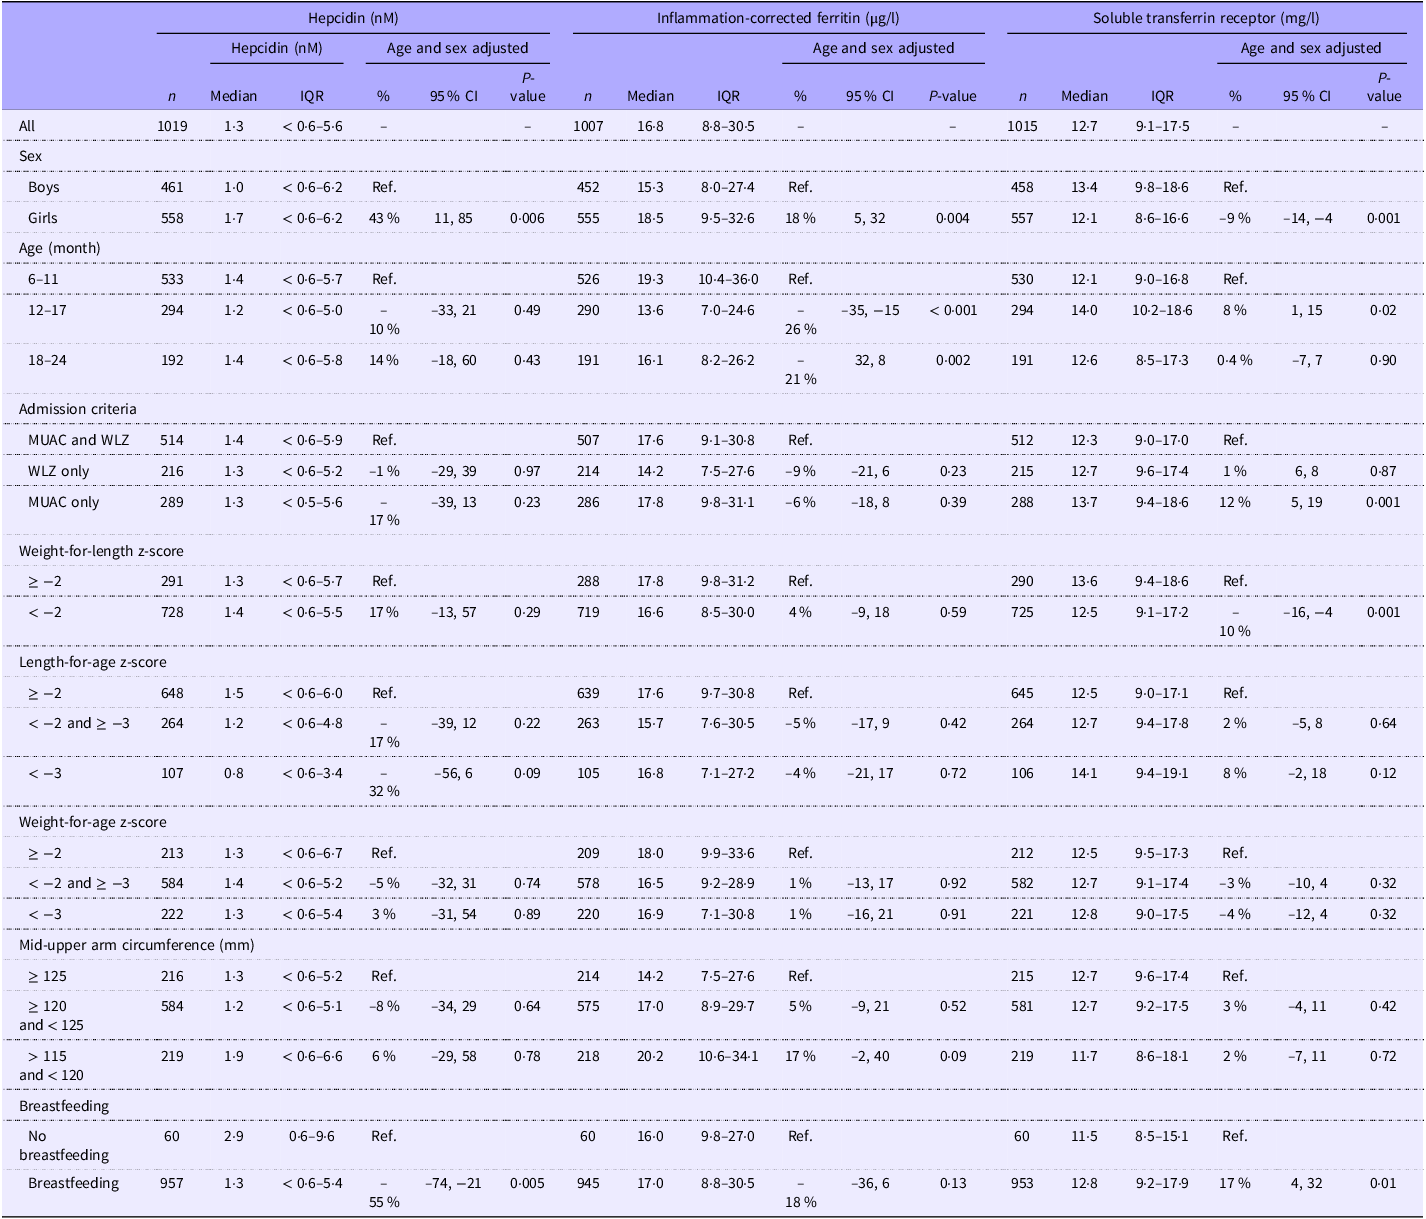
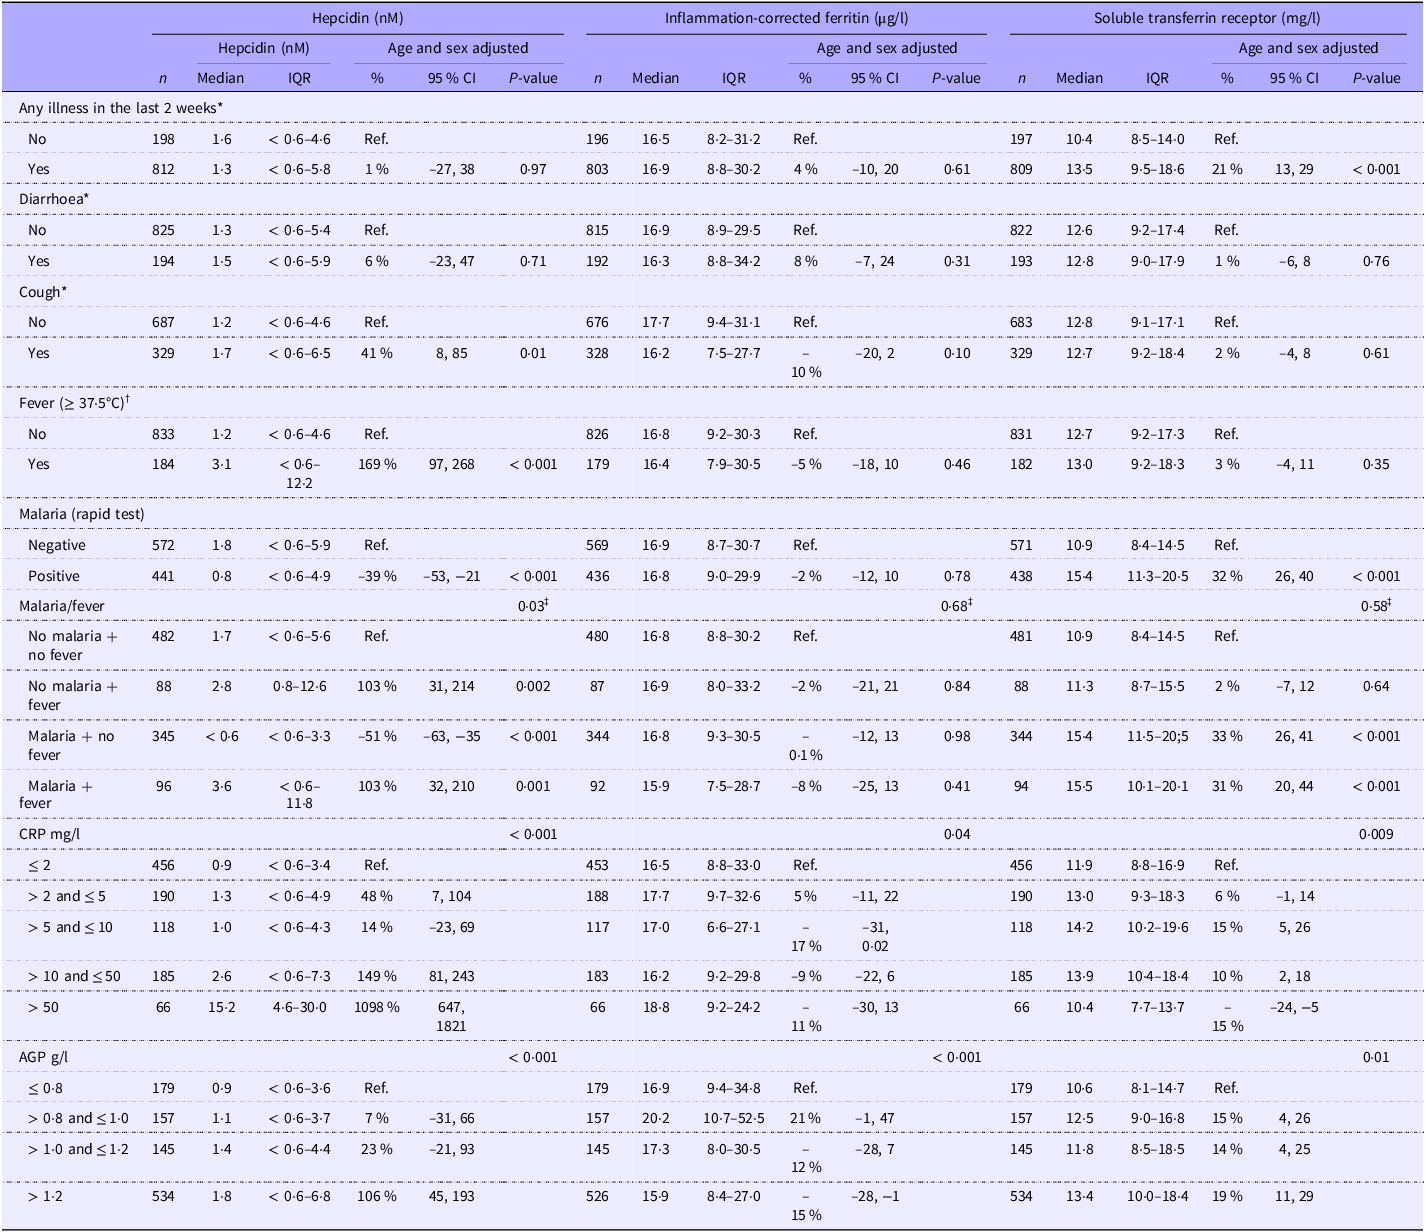
Febrile children had 169 % (95 % CI 97, 268, P < 0·001) higher s-hepcidin than those with a normal body temperature. Children with a positive malaria RDT had 39 % (95 % CI 21, 53, P < 0·001) lower s-hepcidin than those with a negative RDT (Table 3). There was an interaction between malaria and fever (P = 0·03) as children with symptomatic malaria had elevated s-hepcidin (103 %, 95 % CI 32, 210, P = 0·001), whereas the afebrile children with a positive malaria RDT had very low s-hepcidin, –51 % (95 % CI –63, –35, P < 0·001) compared with children without fever and negative malaria RDT (Table 3). Additionally, s-hepcidin increased with higher serum CRP and AGP (Table 3 with age and sex adjustment and online Supplementary Table 2 without adjustment). Those with positive malaria RDT had higher serum CRP (difference: 7 mg/l, 95 % CI 5, 9, P < 0·001) and AGP (difference: 0·3 g/l, 95 % CI 0·2, 0·4, P < 0·001) than those with negative malaria RDT. Furthermore, those with symptomatic malaria had higher serum CRP (difference: 19 mg/l, 95 % CI 15, 23, P < 0·001) and AGP (difference: 0·3 g/l, 95 % CI 0·2, 0·5, P < 0·001) than those with asymptomatic or recent malaria.
Table 3. Clinical and paraclinical markers of inflammation as correlates of serum hepcidin (nM), inflammation-corrected ferritin (µg/l) and soluble transferrin receptor (mg/l) among 1019 children aged 6–23 months with moderate acute malnutrition (median values and interquartile ranges; percentages and 95 % confidence intervals)

Abbreviations CRP = C-reactive protein, AGP = α 1-acid glycoprotein, B = beta coefficient, IQR = Interquartile range.
Detection level for hepcidin is 0·6 nM. Associations were analysed by log10 transformed age- and sex-adjusted Tobit/linear regressions with back transformation, so the results are % differences.
* Based on maternal recall and physical examination at inclusion by trained study nurse.
† Based on physical examination at inclusion by trained study nurse.
‡ P for interaction.
Serum hepcidin and markers of iron status
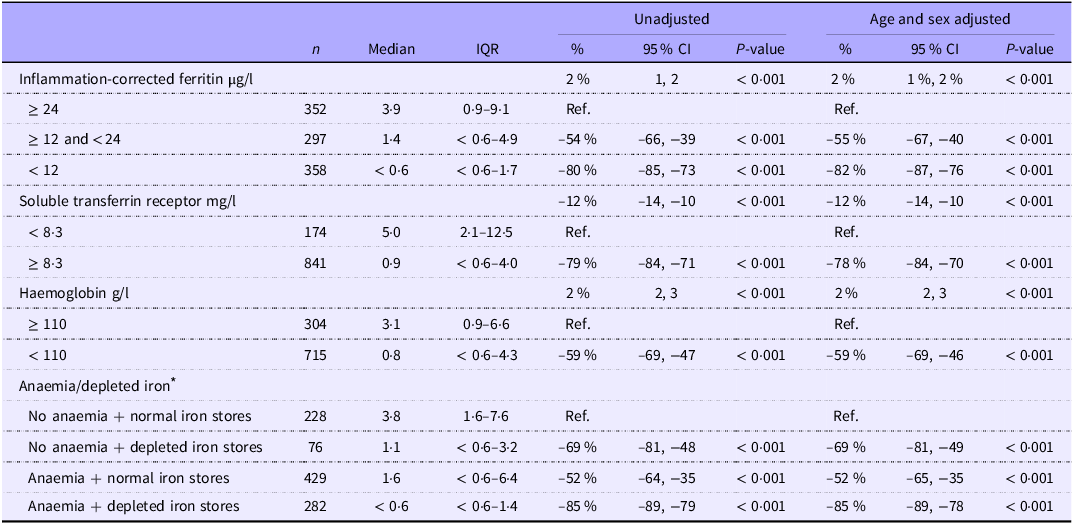
S-hepcidin increased with increasing s-FeCI: children with s-FeCI < 12 µg/l had 82 % (95 % CI 76, 87, P < 0·001) lower s-hepcidin than those with s-FeCI ≥ 24 µg/l. S-hepcidin decreased with increasing serum sTfR and those with sTfR ≥ 8·3 mg/l had 83 % (95 % CI 76, 88, P < 0·001) lower s-hepcidin than those with sTfR < 8·3 mg/l (Table 4). S-hepcidin increased with increasing haemoglobin and those with anaemia had 63 % (95 % CI 51, 73, P < 0·001) lower s-hepcidin than those without anaemia. However, no interaction was seen between anaemia and s-FeCI < 12 µg/l (P = 0·98).
Table 4. Markers of iron status as correlates of serum hepcidin (nM) among 1019 children aged 6–23 months with moderate acute malnutrition (median values and interquartile ranges; percentages and 95 % confidence intervals)

Associations were analysed by log10 transformed age- and sex-adjusted Tobit/linear regressions with back transformation, so the results are % differences. Detection level for hepcidin is 0·6 nM.
* Anaemia defined as haemoglobin < 110 g/l and depleted iron stores defined as inflammation-corrected ferritin < 12 µg/l.
Effects of interventions
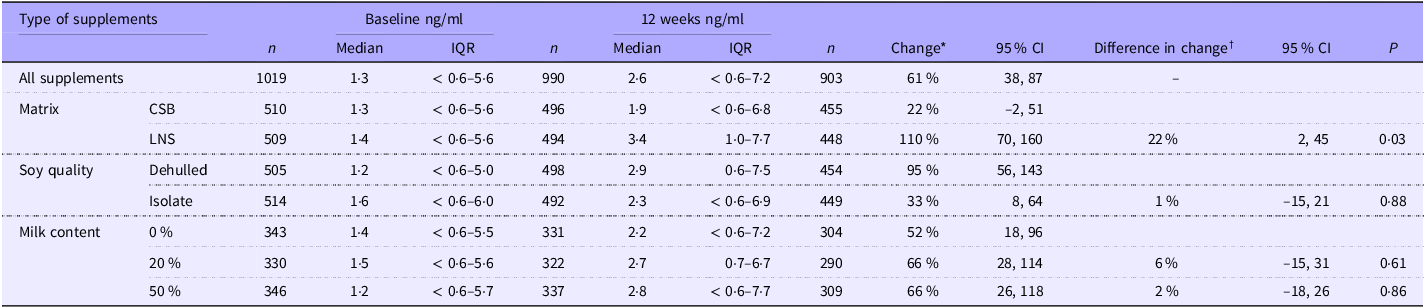
Of the 1019 children who had s-hepcidin measured at baseline, 903 had s-hepcidin measurement repeated after 12 weeks. The 116 who were not followed up had lower percentage of any illness in the last two weeks (73 % (515) v. 80 % (716), P = 0·002); lower age (10·9 months (8·1–15·0) v. 11·6 months (8·3–16·7), P = 0·006) and lower s-FeCI (14·9 (7·2–29·2) v. 17·0 (8·9–30·2), P = 0·01) than those who were followed up at 12 weeks. Overall, s-hepcidin increased 61 % (95 % CI 38, 87, P < 0·001) after 12 weeks of food supplementation. Those who received LNS had 22 % (95 % CI 2, 45, P = 0·03) higher increase in s-hepcidin than those who received CSB (Table 5). There was no effect of soy quality (P = 0·9) and milk content (20 % v. 0 %, P = 0·6 and 50 % v. 0 %, P = 0·9).
Table 5. The effect of matrix, soy quality and milk content of food supplements on hepcidin (nM) among children with moderate acute malnutrition (median values and interquartile ranges; percentages and 95 % confidence intervals)

Abbreviations: CSB, Corn-soy blend; LNS, lipid-based nutrient supplement; IQR, interquartile range.
Detection level for hepcidin is 0·6 nM.
* Results are based on tobit random-effects models adjusted for sex, age, season, site, baseline MUAC, WLZ and LAZ as fixed effects and ID as random effect. Hepcidin was log10 transformed and back transformed, so the results are % differences.
† Results are presented as the ratio of change based on tobit random-effects models adjusted for sex, age, season, site, baseline MUAC, WLZ and LAZ as fixed effects and ID as random effect. Hepcidin was log10 transformed and back transformed, so the results are % differences. The 22 % represents that those who received LNS had 22 % higher increase in s-hepcidin than those who received CSB.
Discussion
As expected, morbidity and inflammation were associated with elevated s-hepcidin in children with MAM. Interestingly, while symptomatic malaria was associated with high s-hepcidin, children with asymptomatic or recent malaria had low s-hepcidin. Those with iron deficiency or anaemia or both also had lower s-hepcidin. S-hepcidin increased with 12 weeks supplementation in children with MAM, and it increased more in those who received LNS compared with CSB.
Serum hepcidin in children
We found an overall s-hepcidin of 1·3 nM, which is lower than in healthy children aged 0–3 years from high-income countries(Reference Donker, Galesloot and Laarakkers17,Reference Uijterschout, Swinkels and Domellöf18) . Two studies from the Netherlands demonstrated that s-hepcidin in children measured with mass spectrometry ranged from 0·2 nM to 20·9 nM, with a median between 1·8 nM and 3·7 nM, whereas median s-hepcidin measured with immunochemical methods was 7·9 nM(Reference Donker, Galesloot and Laarakkers17,Reference Uijterschout, Swinkels and Domellöf18) . They also found that s-hepcidin levels vary throughout childhood, with lower levels in older children but with no sex difference(Reference Donker, Galesloot and Laarakkers17,Reference Uijterschout, Swinkels and Domellöf18) . The lower s-hepcidin in our study in children from Sub-Saharan Africa is in line with a review that found that s-hepcidin is lower in healthy children from low-income countries compared with healthy children from high-income countries(Reference Kumar, Bhatia and Jain19). Studies in healthy children in Sub-Saharan Africa showed that children aged six months from rural Kenya had a mean s-hepcidin of 2·3 nM (range 0·1–18·1 nM) with a lower concentration in boys than in girls (1·5 v. 3·2 nM)(Reference Jaeggi, Moretti and Kvalsvig20), which could be because boys are more likely to be undernourished(Reference Thurstans, Opondo and Seal21). Similarly, a study from Zimbabwe in children aged 3–12 months found that median (interquartile range) plasma hepcidin was 3·5 nM (0·9–6·9) at 3 months, 1·6 nM (0·2–2·6) at 6 months and 0·7 nM (0·3–2·2) at 12 months, but with no sex difference(Reference Mupfudze, Stoltzfus and Rukobo22). A study in coastal Kenya found similar lower s-hepcidin at older ages with s-hepcidin in children aged 0–1 year of 3·0 nM (95 % CI 2·1, 4·3) and in children aged 1–3 years of 0·9 nM (95 % CI 0·7, 1·2)(Reference Atkinson, Uyoga and Armitage6). The relatively low levels of s-hepcidin in studies from Sub-Saharan Africa, regardless of measurement method, suggest that iron deficiency is widespread, which is consistent with previous studies(Reference Muriuki, Mentzer and Webb23,Reference Mwangi, Mzembe and Moya24) . Iron deficiency in Sub-Saharan Africa is caused by lower iron intake due to diets with low content or bioavailability of iron, reduced intestinal absorption due to infections and the high burden of malnutrition, among other things(Reference Black, Victora and Walker2–Reference Nemeth and Ganz4,Reference Atkinson, Uyoga and Armitage6,Reference Skorokhod, Caione and Marrocco25) . It also indicates that factors such as chronic inflammation, e.g. due to repeated infections that would tend to increase s-hepcidin, are outweighed by the effects of iron deficiency(Reference González-Fernández, Nemeth and Pons26). Additional factors such as genetic differences may also play a role(Reference Lemoine and Tounian3,Reference Kumar, Bhatia and Jain19) .
No studies have looked at hepcidin in malnourished children in Sub-Saharan Africa. S-hepcidin was lower in our study than in healthy children without malnutrition from Kenya (1·3 nM v. 2·3 nM), which also measured s-hepcidin using mass spectroscopy. We had a high number of values (38 %) under the quantification level. In comparison, only 1·8 % or less of healthy children in high-income countries and 15 % of Kenyan children without malnutrition had values under the detection limit (0·5 nM) measured with mass spectroscopy(Reference Donker, Galesloot and Laarakkers17,Reference Uijterschout, Swinkels and Domellöf18,Reference Jaeggi, Moretti and Kvalsvig20) . Of those with values under the quantification level in our study, 91 % had either anaemia or depleted iron stores, suggesting that the iron deficiency was the cause of the low values. Likewise, the study in Kenyan children found that 59 % of those with iron deficiency and no inflammation had values under the detection limit(Reference Jaeggi, Moretti and Kvalsvig20). Low s-hepcidin in children with iron deficiency is expected as lack of iron in tissues will downregulate s-hepcidin, which will lead to higher absorption from the intestine(Reference Nemeth and Ganz4).
Association of hepcidin changes with changes in iron status and inflammation
We showed that food supplementation for 12 weeks increased s-hepcidin in children with MAM. This increase in s-hepcidin could be due to an increase in iron stores, as all food supplements contained iron. Oral iron therapy has previously been found to rapidly increase s-hepcidin in children with iron deficiency or anaemia(Reference Singh, Arora and Goyal27). This is consistent with the decrease in anaemia and iron deficiency after supplementation, previously shown in a study from the Treatfood project(Reference Cichon, Fabiansen and Iuel-Brockdorf28). However, it also showed a decrease in inflammation after supplementation. Inflammation has previously been shown to increase s-hepcidin(Reference González-Fernández, Nemeth and Pons26), and we also found positive associations between inflammation markers and s-hepcidin in our study, which suggests that s-hepcidin should decrease with supplementation. So, the effect of restoring iron is larger than the effect of reducing inflammation(Reference Jaeggi, Moretti and Kvalsvig20). Children who got LNS had higher s-hepcidin than those who received CSB. This is most likely due to the better iron status previously demonstrated in those who received LNS compared with CSB and may be due to better acceptability of LNS(Reference Iuel-Brockdorf, Draebel and Ritz7,Reference Cichon, Fabiansen and Iuel-Brockdorf28) . Also, inflammation levels were higher among those who received LNS(Reference Cichon, Fabiansen and Iuel-Brockdorf28). Both factors may have contributed to the increase in s-hepcidin.
In our study, we found no increase in s-hepcidin in children with MAM who had been ill in the last two weeks before inclusion. A study in Ghanaian children found that s-hepcidin was already within the normal range 7 d after treatment of malaria(Reference Castberg, Sarbah and Koram15). This rapid change after infection can explain the lack of increase in s-hepcidin, as two weeks may be too long an interval to capture the rapid change in s-hepcidin following malaria treatment. This also aligns with the strong association with CRP as a relatively fast inflammation marker, as opposed to AGP that is slower. Furthermore, not all diseases, e.g., gastro-intestinal infections, result in systemic inflammation and subsequent increase in s-hepcidin(Reference Atkinson, Uyoga and Armitage6,Reference Castberg, Sarbah and Koram15,Reference Jaeggi, Moretti and Kvalsvig20,Reference Cherian, Forbes and Cook29) .
Malaria
We found increased s-hepcidin, decreased sTfR and stable s-FeCI in children with symptomatic malaria and MAM. High s-hepcidin during symptomatic malaria with rapid decrease after infection has previously been found in other studies(Reference Atkinson, Uyoga and Armitage6,Reference Castberg, Sarbah and Koram15) . A study in Burkinabé children showed that s-hepcidin was higher in children with parasitemia and the best predictor of parasitemia was malnutrition(Reference Neyer, Kaboré and Nakas30). The parasite digests haemoglobin and releases hemozoin, which inhibits erythropoiesis in bone marrow(Reference Skorokhod, Caione and Marrocco25). The bone marrow suppression is lifted rapidly after treatment(Reference Helleberg, Goka and Akanmori31). These findings suggest that the low tissue iron could be due to either the use of iron by the parasite or that those with parasitemia are also the ones with insufficient nutritional intake, including iron, which is the reason for the low tissue iron. The malaria RDT can be positive for up to a month after cure, so fever was used to distinguish between symptomatic malaria and recent or asymptomatic malaria. This also meant that we could not distinguish between recent and asymptomatic malaria.
We found that MAM children with recent or asymptomatic malaria had lower s-hepcidin and higher sTfR than those with negative malaria RDT, but similar s-FeCI. This differs from other studies in children without malnutrition where s-hepcidin was increased in asymptomatic malaria(Reference Atkinson, Uyoga and Armitage6,Reference Sandalinas, Filteau and Joy32) . The increase in s-hepcidin, caused by asymptomatic malaria, has been suggested to result in iron deficiency through reduced iron absorption(Reference Atkinson, Uyoga and Armitage6), which is in line with the bone marrow suppression and anaemia found in Ghanaian children with persistent malaria and asymptomatic malaria(Reference Helleberg, Goka and Akanmori31,Reference Kurtzhals, Addae and Akanmori33) . The lower s-hepcidin in our study and the decrease in iron deficiency with food supplementation shown in a previous study on the Treatfood project suggest that asymptomatic malaria does not block iron absorption in children with MAM(Reference Cichon, Fabiansen and Iuel-Brockdorf28). This also suggests that s-hepcidin is differently regulated in children with malnutrition compared with well-nourished children. Further studies are needed to corroborate this finding, as we could not discriminate between asymptomatic and recently treated malaria.
Breastfeeding and anthropometry
We found that children with MAM who were currently breastfed had lower s-hepcidin compared with non-breastfed children when adjusted for age and sex. This is in line with a previous study in infants from the USA that showed that healthy children who were breastfed had lower s-hepcidin than those who were not breastfed, even though ferritin levels were similar(Reference Verhaeghe, George and Westerman34). Breastmilk has a very low iron content and iron is poorly absorbed(Reference Davidsson, Kastenmayer and Yuen35–Reference Domellöf, Lönnerdal and Abrams37). However, the non-breastfed group in our study was small, and the reasons for not breastfeeding included factors that could influence iron status, e.g. age. Anthropometric measures before supplementation were not associated with s-hepcidin in our study. Results from previous studies vary, showing positive, negative or no associations between hepcidin and anthropometric measures(Reference Kumar, Bhatia and Jain19,Reference Jaeggi, Moretti and Kvalsvig20,Reference Atkinson, Armitage and Khandwala38) . The fact that all children included in our study had MAM at inclusion may have limited the range of anthropometric z-scores and thus the possibility to demonstrate an association. However, our previous study on the Treatfood project found an overall increase in anthropometry. The increase was larger in children who received LNS compared with CSB(Reference Fabiansen, Yameogo and Iuel-Brockdorf8). Studies comparing overweight and normal weight children have found higher hepcidin in overweight children and reduction in hepcidin with weight loss(Reference Aeberli, Hurrell and Zimmermann39,Reference Amato, Santoro and Calabrò40) . This suggests that change in anthropometry can also influence hepcidin concentrations.
Limitations
There are some limitations in our study. Firstly, this was a secondary analysis of a randomised trial and this resulted in missing hepcidin values which may induce bias. Secondly, there was not enough blood to measure s-hepcidin for all children. Children without s-hepcidin assessment had smaller iron stores but fewer infections, including malaria, both of which influence s-hepcidin. Thirdly, 38 % of children had s-hepcidin under the quantification level of 0·6 nM so only 62 % had s-hepcidin within the measurable interval. However, our measurements had precision and accuracy up to the expected standards, and Tobit regression was used to take left censoring into account when fitting the models. Fourthly, due to ethical concerns, no control group without supplementation was included to evaluate the s-hepcidin over time. Lastly, malaria parasitemia was not evaluated, which would have given a clearer picture of the changes in s-hepcidin and iron stores, especially in the group of children with positive malaria RDT but no fever.
Conclusion
Morbidity and inflammation were associated with high s-hepcidin and iron deficiency, with low s-hepcidin in children with MAM. Unexpectedly, children with asymptomatic or recent malaria had low s-hepcidin. S-hepcidin increased with 12 weeks of food supplementation in children with MAM, with the highest increase in those who received LNS compared with CSB. Further studies confirming the downregulation of s-hepcidin in children with malnutrition and asymptomatic malaria are needed.
Supplementary material
For supplementary material/s referred to in this article, please visit https://doi.org/10.1017/S0007114525105679
Acknowledgement
Many thanks to Bernardette Cichon for the help with both research conduction and input to the analyses. We acknowledge the contributions of the study participants and their families, the research staff, the Ministry of Health in Burkina Faso, the health and village authorities in Province du Passoré and the staff at the health centres.
The study was funded by DANIDA Danish Ministry of Foreign Affairs (09-097 LIFE); Médecins Sans Frontières (Denmark, Norway); Arvid Nilsson’s Foundation; The World Food Program, which was part of a donation to the World Food Program from the American people through the support of the US Agency for International Development’s Office of Food for Peace; the Alliance for International Medical Action; the European Union’s Humanitarian Aid Funds, in partnership with Action Contre la Faim and a private donation from Merete and Mogens Brix Christensen. The funders had no role in design, analysis or writing of this article.
H. F., K. F. M., S. F., A. B. and V. B. C.: designed the Treatfood trial, C. W. Y., C. F. and A-S. I-B.: conducted the research, J. K., K. K. L. and B. S. conducted the laboratory work, T. W. H., C. R.: analysed data, T. W. H.: wrote the manuscript and had primary responsibility for final content, T. W. H., H. F., J. K., S. F. and V. B. C.: contributed to data analysis, and all authors: read, edited and approved the final manuscript.
H. F. has received research grants from Arla Food for Health Centre and research grants from the Danish Dairy Research Foundation, K. F. M. received funds from Arla Foods Amba and finally H. F., K. F. M., S. F. and A. B. have had research collaboration with Nutriset, a producer of LNS. Other authors declare no financial relationships with any organisations that might have an interest in the submitted work in the previous five years, and declare no other relationships or activities that could appear to have influenced the submitted work.
The study was conducted in accordance with the Declaration of Helsinki, and all caregivers gave written informed consent prior to inclusion using either signature or fingerprint. The study was approved by the Ethics Committee for Health Research of the Government of Burkina Faso (2012-8-059), and a consultative approval was given by the Danish National Committee on Biomedical Research Ethics (1,208,204). The trial registration was ISRCTN42569496. All treatment was free of charge, and children who developed severe acute malnutrition were treated with ready-to-use therapeutic food, and if that was not sufficient after 4 weeks, they were referred to the hospital.


 Open access