


Introduction
Dietary protein intake is essential for preventing frailty and sarcopenia, as amino acids – particularly branched-chain amino acids – from dietary proteins support skeletal muscle protein synthesis, maintain muscle function, and enhance physical performance. For healthy older adults, expert groups have reported a recommended protein intake of 1.0–1.2 g/kg body weight (BW)/day to maintain muscle mass.(Reference Bauer, Biolo and Cederholm1,Reference Deutz, Bauer and Barazzoni2) However, despite the recognised importance of protein for health in older adults, substantial evidence indicates that many community-dwelling older adults consume less protein than recommended.(Reference Ishikawa-Takata and Takimoto3,Reference Hengeveld, Boer and Gaudreau4)
Accurately assessing habitual protein intake is crucial for developing effective dietary interventions.(Reference O’Hara and Gibney5) Although various dietary assessment methods (e.g. dietary records, 24-h recalls, and food intake frequency surveys) can identify insufficient protein intake in older adults, they are often labour- and resource-intensive, limiting their practicality for rapid risk screening. Recently, a short questionnaire consisting of 13 questions, Protein Screener 55+, was developed to screen for protein intake ≤1.0 g/kg adjusted BW/day in a sample of Dutch older adults.(Reference Wijnhoven, Elstgeest and de Vet6) Another study validated this tool in a United Kingdom (UK) population.(Reference Tuttiett, Ioannou and Wijnhoven7) Protein Screener 55+ has fewer food items than that had by a typical food frequency questionnaire (includes about 50 to 200 food items),(Reference Shim, Oh and Kim8,Reference Matsumoto, Murakami and Yuan9) reducing the burden on respondents and enabling promote feedback. These findings also demonstrate that the short questionnaire (protein screening tool) effectively identifies individuals who consume protein less than the level of 1.0 g/kg adjusted BW/day among Western populations. However, to our knowledge, no similar tool exists for rapidly screening low protein intake in Asian populations, whose dietary habits differ significantly from those in Western populations.(Reference Zhou, Stamler and Dennis10) Developing such a tool would facilitate the early identification of older adults at risk of low protein intake, enabling detailed dietary assessments and appropriate interventions.
Therefore, this study developed a prediction model to identify individuals at risk of low protein intake among Japanese community-dwelling older adults using simple questions regarding the frequency of foods commonly consumed, and evaluated its performance. As in previous studies, this prediction model was designed with a minimum number of food items.
Methods
Data source and study participants
This study was a secondary analysis of the 2013 and 2017 National Health and Nutrition Survey (NHNS), conducted with permission from Japan’s Ministry of Health, Labour, and Welfare. The NHNS is an annual nutrition survey administered by Japan’s Ministry of Health, Labour, and Welfare. Details of its design have been previously described.(Reference Ikeda, Takimoto and Imai11,12) The 2013 and 2017 surveys included residents aged ≥1 year from all households in 300-unit blocks randomly selected from census enumeration areas. The NHNS comprised a dietary intake survey, physical examination, and lifestyle survey.
The 2013 and 2017 surveys were selected for this study because they collected comparable data on food intake frequency. We used combined data from individuals aged ≥65 years from the 2013 and 2017 NHNS to develop a prediction model and perform internal validation. Although participant overlap across years is theoretically possible, this information is not publicly available. Given Japan’s large population (>50 million households), we considered the likelihood of substantial overlap negligible. Of the 5,485 individuals aged ≥65 years who participated in the NHNS 2013 and 2017, we excluded 611 with no dietary intake data and 40 with extreme total energy intake (outside the mean ± 3 standard deviation for each sex). Additionally, 148 individuals missing data on the frequency of intake of nine food items and 601 with missing BMI information were excluded. The final study population comprised 4,085 individuals.
Based on official application procedures under Article 33 of the Statistics Act, permission to use anonymised individual-level data of the NHNS was obtained from the Ministry of Health, Labour, and Welfare of Japan. In accordance with the Ethical Guidelines of Epidemiological Research,(13) this study was exempted from these guidelines as it utilised only anonymised data.
Assessment of protein intake
Dietary intake data were obtained using a one-day semi-weighted household dietary record, with evaluations conducted on a single day in November, excluding holidays. Details of the dietary survey protocol have been reported previously.(Reference Ikeda, Takimoto and Imai11,12,Reference Iwaoka, Yoshiike and Date14) Before the survey, a self-administered food intake questionnaire was distributed to each household. Trained interviewers (dietitians from public health centres) instructed household representatives, typically those responsible for food preparation, on measuring food and beverage quantities and completing the questionnaire. These representatives were asked to weigh all the food and drink items consumed by household members. When weighing was not feasible, trained dietitians applied standardised weights from the nutritional survey manual. Participants recorded dietary information for each meal, including dish name, food name, volume, waste volume, and distribution of shared dishes. Trained interviewers collected and validated the completed surveys. Protein intake for each participant was estimated using the 2010 Standard Tables for Food Composition in Japan.(15)
Protein intake was expressed per kg of adjusted BW/day. To prevent inaccurate protein requirement calculations for individuals who were underweight or obese, adjusted BW was used in this study. For individuals with a BMI >25.0 kg/m2 (age <71 years) or >27.0 kg/m2 (age ≥71 years), an adjusted BMI was calculated using the BW corresponding to a BMI of 25.0 or 27.0 kg/m2, respectively. Conversely, for those with a BMI <18.5 kg/m2 (age <71 years) or <22.0 kg/m2 (age ≥71 years), the BW equivalent to a BMI of 18.5 or 22.0 kg/m2, respectively, was utilised.(Reference Berner, Becker and Wise16) Protein intake was categorised as either low (<1.0 g/kg adjusted BW/day) or high (≥1.0 g/kg adjusted BW/day). This cutoff was based on recent evidence indicating that older adults require higher protein intake than the recommended daily allowance (0.8 g/kg BW/day) and the recommendations (1.0–1.2 g/kg BW/day) of the expert group.(Reference Bauer, Biolo and Cederholm1,Reference Deutz, Bauer and Barazzoni2,Reference Nanri, Watanabe and Yoshida17) This binary variable (0 = ≥1.0 g/kg adjusted BW/day; 1 = <1.0 g/kg adjusted BW/day) was used as the outcome measure in the prediction model.
Measurements of predictive variables
Data on the intake frequency of nine food items (rice, bread, noodles, meat, fish, eggs, soybeans and soybean products, green/yellow vegetables, and other vegetables) were collected using a self-administered questionnaire. These items constitute staple, main, and side dishes and are characteristic of a healthy Japanese dietary pattern.(18) Moreover, a previous study using NHNS data reported that these food groups (meat, fish, eggs, beans, cereals, and vegetables) were the top six sources of protein intake.(Reference Ishikawa-Takata and Takimoto3) For each item, participants were asked to respond to seven options regarding their consumption frequency over the past month (almost never, <once/week, once/week, 2–3 times/week, 4–6 times/week, once/day, and ≥2 times/day). To unify ordinal variables with frequency per week, answers to the questions on food intake frequency were categorised into four groups: ≤once/week (merging three categories), 2–3 times/week, 4–6 times/week, and ≥once/day (merging two categories).
Statistical analysis
A multivariable logistic regression model was used to predict the risk of low protein intake (<1.0 g/kg adjusted BW/day). The model included sex, age, adjusted BW, and food intake frequency of rice, bread, noodles, meat, fish, eggs, soybeans and soybean products, green/yellow vegetables, and other vegetables. These variables were selected from available data based on simple items, mainly food intake frequency, with reference to the Protein Screener 55+ developed in the Netherlands.(Reference Wijnhoven, Elstgeest and de Vet6,19) The stepwise method for variable selection was not used in this study because it is not recommended for developing clinical prediction models due to the possibility of introducing estimation bias and reducing predictive performance.(Reference Efthimiou, Seo and Chalkou20) The regression equation, which includes both coefficients and intercepts derived from the model, was used to calculate predicted probabilities for each participant.
Discrimination of the prediction model was evaluated using the receiver operating characteristic (ROC) AUC. Calibration was evaluated using a calibration plot. Internal validation was conducted using 1,000 bootstrap samples to estimate model optimism and calculate optimism–corrected predictive performance. Statistical analyses were performed using R (version 4.4.2) and RStudio (version 2024.12.0 + 467). Two-sided p-values <0.05 were considered statistically significant.
Results
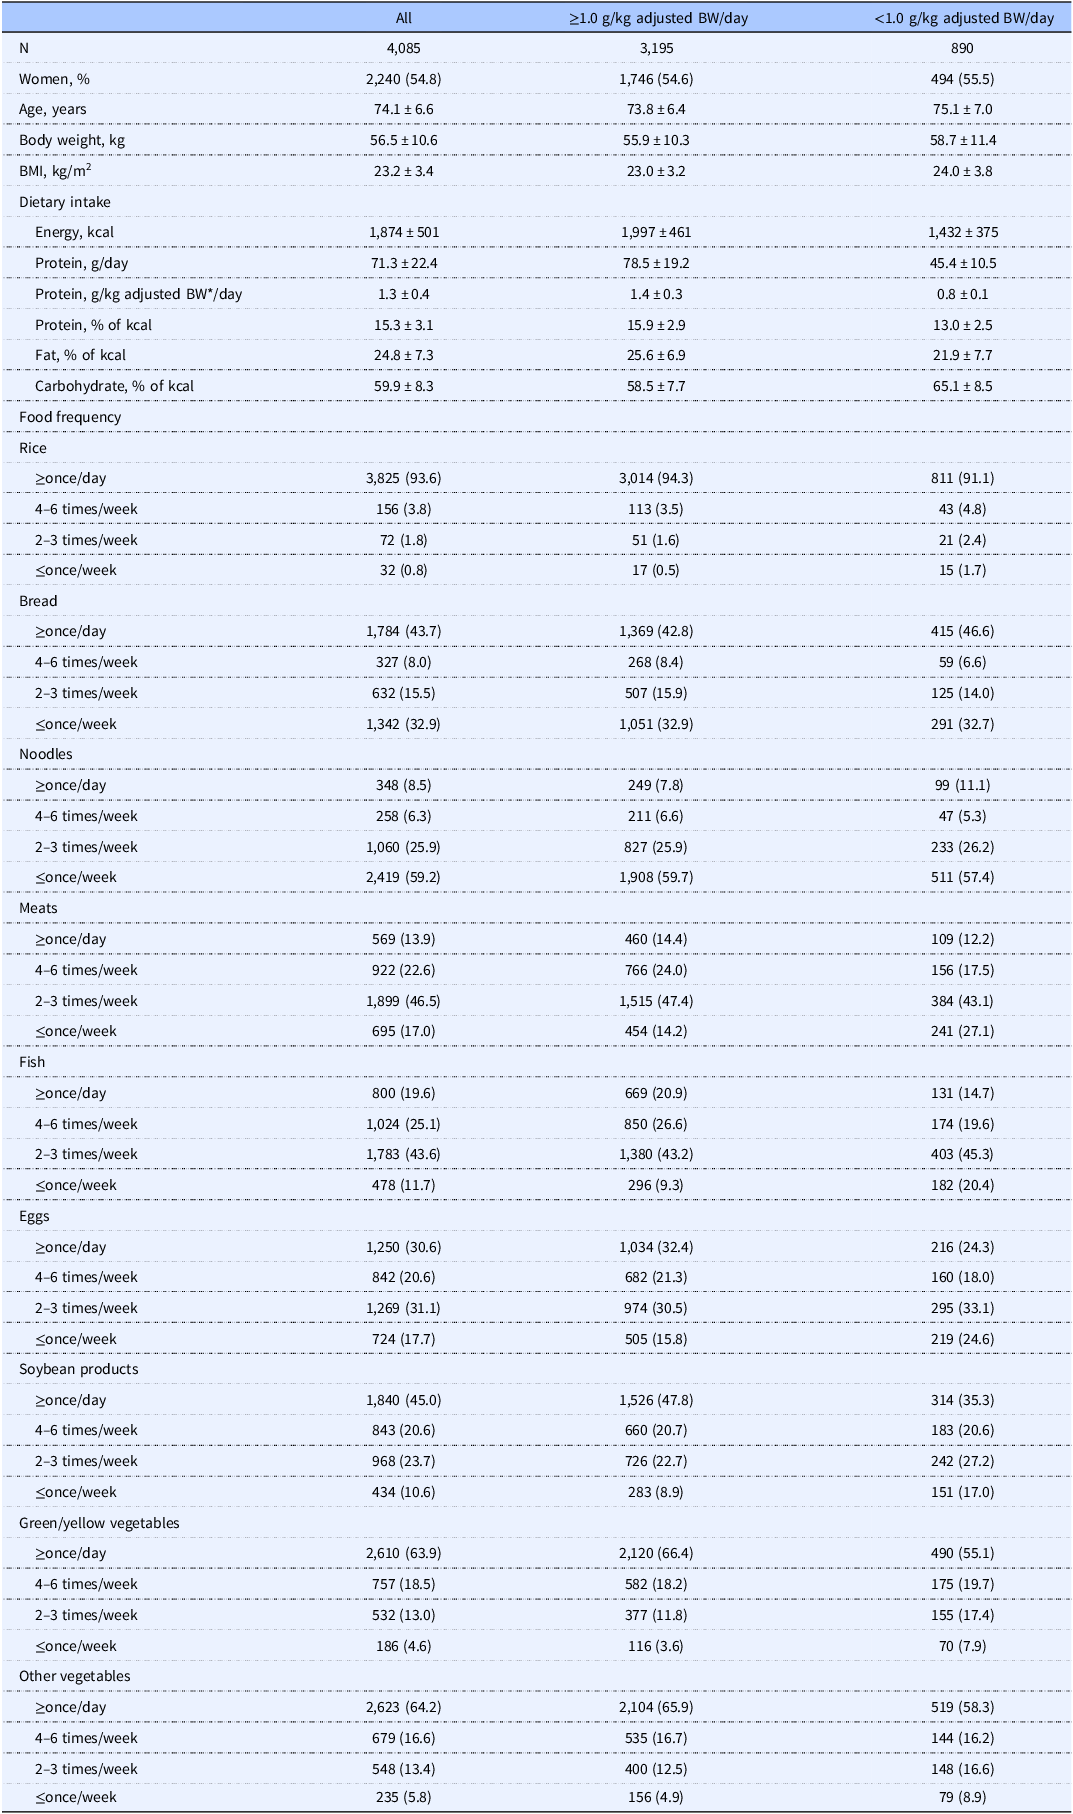
Table 1 shows the characteristics of the study participants. The mean age of the 4,085 participants was 74.1 years (standard deviation = 6.6), and 55.5% were female. The prevalence of low protein intake was 21.8%. Participants with low protein intakes had slightly higher BMI and lower energy intake than those with a high protein intake.
Table 1. Characteristics of the study participants

BW, body weight.
* Body weight was adjusted to nearest value to reflect healthy BMI in older adults (18.5–25.0 kg/m2 for adults aged <71 years or 22.0–27.0 kg/m2 for adults aged ≥71 years), as described previously.(Reference Berner, Becker and Wise16)
Values are means ± SD or n (%).
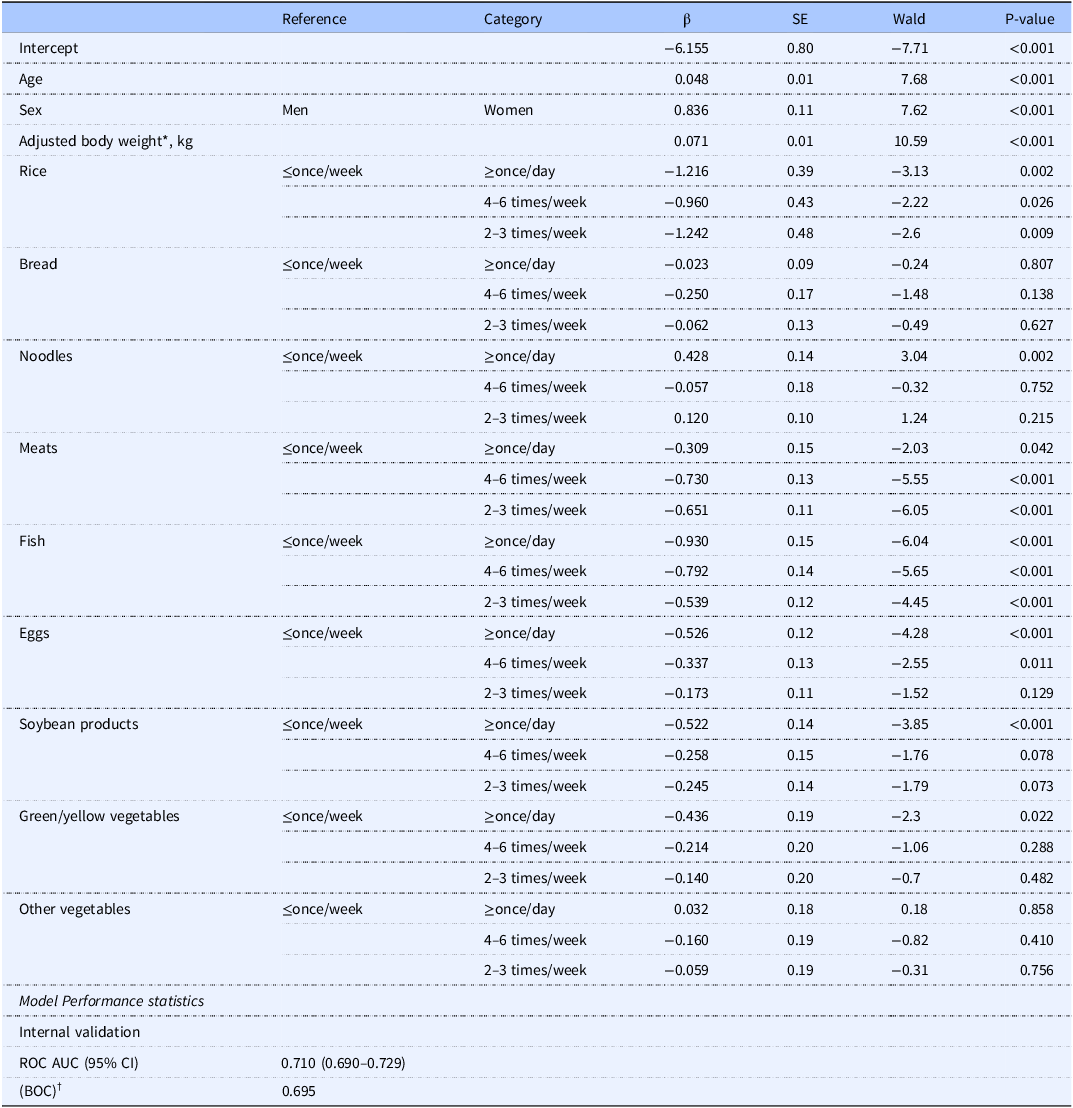
Using low protein intake as the dependent variable, a risk prediction model was constructed via logistic regression. All variables and corresponding regression coefficients for predicting low protein intake are shown in Table 2. Details of the question items are shown in Supplementary Table 1.
Table 2. Multivariable model for prediction of low protein intake (<1.0 g/kg adjusted BW/day)

BW, body weight.
* Body weight was adjusted to nearest value to reflect healthy BMI in older adults (18.5–25.0 kg/m2 for adults aged <71 years or 22.0–27.0 kg/m2 for adults aged ≥71 years), as described previously.(Reference Berner, Becker and Wise16)
† Bootstrap optimism–corrected estimate of model performance based on 1,000 bootstrap resamplings.
Table 2 and Figure 1 show the model’s performance statistics. Internal validation showed an ROC AUC of 0.710 (95% confidence interval = 0.690–0.729; bootstrap optimism-corrected AUC = 0.695), with a calibration slope of 0.921.

Figure 1. Calibration plot of the predictive model.
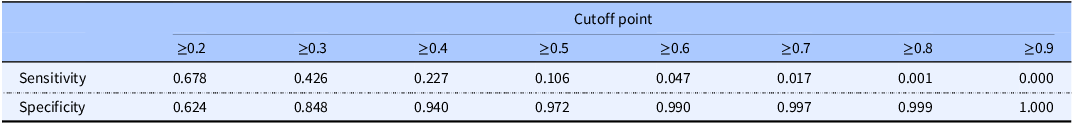
Table 3 shows the model performance for sensitivity and specificity for different probability cutoffs. The highest sensitivity and specificity were observed at a cutoff of ≥0.2, based on the Youden index.
Table 3. Model performance, with protein intake <1.0 g/kg adjusted BW/day as the reference standard, at different cut-off probabilities

Discussion
Using the NHNS data, we developed a prediction model to identify the risk of low protein intake in community-dwelling Japanese older adults. Our model included sex, age, adjusted BW, and intake frequency of specific foods (rice, bread, noodles, meat, fish, eggs, soybeans and soybean products, green/yellow vegetables, and other vegetables). Discrimination and calibration were used as the performance measures for the prediction model, and the discrimination of the developed model was considered adequate. Calibration was generally accurate; however, miscalibration occurred in regions where predicted probability risks exceeded approximately 0.5.
A key feature of the Japanese diet distinguishing it from Western diets, is the significant role of rice, which is also a major protein source. The NHNS data indicate that cereals contribute the second-highest proportion of protein intake after fish, accounting for 20.9%–23.3% of total protein intake among older adults aged ≥65 years.(Reference Ishikawa-Takata and Takimoto3) While a Dutch model for predicting low protein intake exists,(Reference Wijnhoven, Elstgeest and de Vet6) it does not fully account for Japanese community-dwelling older adults with different eating habits. While prior studies among Dutch older adults included 10 questions on frequency and/or amount of consumption of specific foods (slices of bread, glasses of milk, meat with warm meal, cheese, dairy products, egg(s), pasta/noodles, fish, and nuts/peanuts),(Reference Wijnhoven, Elstgeest and de Vet6) our model incorporated rice and soybeans/soybean products, allowing for a better representation of Japanese dietary habits. Although the frequency and/or quantity of specific foods assessed differed between previous studies and our study, we validated our findings in alignment with prior research.
In the model developed in this study, the intake frequency of animal-based protein foods (e.g. meat and fish), as well as plant-based protein sources, such as rice, which are major sources of protein for Japanese older adults, were included. Although animal proteins containing branched-chain amino acids are advantageous for increasing muscle mass, plant-based proteins have been reported to be associated with a reduced risk of frailty and a wider range of health benefits.(Reference Coelho-Junior and Marzetti21–Reference Toutirais, Vaysse and Gueugneau25) Taken together, in the prevention of frailty, evidence that recommends a specific source of protein is insufficient, and a variety of high-quality, protein-rich foods as part of a healthy dietary pattern is considered optimal for older adults.(Reference Campbell, Deutz and Volpi22,Reference Bloom, Shand and Cooper26) Therefore, we believe that including rice in the model for Japanese older adults is appropriate.
A recent meta-analysis using data from a national dietary survey and a large ageing cohort in Western countries reported that the prevalence of protein intake <1.0 g and 1.2 g/kg adjusted BW/day was 46.7% and 70.8%, respectively.(Reference Hengeveld, Boer and Gaudreau4) While direct comparisons among these studies are challenging due to differing dietary assessment methods, in this study, the prevalence of protein intake below 1.0 g and 1.2 g/kg adjusted BW/day was 21.8% and 41.0%, respectively, which was lower than that reported in a previous study from Western countries. Additionally, a recent cross-sectional study examining the non-linear relationship between dietary protein intake and frailty found that adequate protein intake among healthy Japanese older adults exceeded the current recommended daily allowance (0.8 g/kg BW/day).(Reference Nanri, Watanabe and Yoshida17) Therefore, even in Japan, where low protein intake is less prevalent than that in Western countries, screening remains crucial for facilitating assessments and appropriate support to prevent frailty.
A previous large-scale survey assessing protein knowledge among community-dwelling older adults in five countries (Finland, the Netherlands, Poland, Spain, and the UK) using nine objective statements found that many older adults had poor knowledge of dietary protein, with the lowest awareness regarding recommended intake.(Reference Visser, Hung and Verbeke27) Although protein intake knowledge among older Japanese adults remains unknown, the predictive model developed in this study can screen for low protein intake risk through simple questions and may serve as a self-check tool, regardless of an individual’s knowledge level.
A major strength of this study was the use of national survey data from a large, free-living population representative of older Japanese adults. Although we assessed validity based on one-day dietary survey data, the data was obtained from a relatively large number of participants (n = 4,085). Therefore, we believe that the influence of random errors associated with one-day dietary records was minimised. Moreover, the prediction model developed in this study efficiently identified older adults at high risk of low protein intake using only 12 items, which can facilitate rapid and detailed dietary assessments and support appropriate interventions. The number of items is almost similar to that in previous studies.(Reference Wijnhoven, Elstgeest and de Vet6)As observed in those previous studies, we developed a model derived for the older Japanese population that reduces the burden on respondents and enables prompt feedback. However, this study had several limitations. First, dietary intake data were collected from a single day, which may not reflect an individual’s typical dietary habits. A previous study reported that a 1-day intake distribution for assessing protein intake deficiency can lead to overestimation,(Reference Ishiwaki, Yokoyama and Fujii28) suggesting that our study may have similarly overestimated the proportion of older adults with low protein intake. Second, while we assessed food consumption frequency, we did not collect portion size data. Although the Protein Screener 55+ (Pro55+) includes some questions about portion size,(Reference Wijnhoven, Elstgeest and de Vet6)several studies have questioned the utility of portion size information.(Reference Noethlings, Hoffmann and Bergmann29,Reference Schlundt, Buchowski and Hargreaves30) Since our goal was to develop a rapid screening tool, further research is needed to determine whether portion size improves model accuracy. Third, dairy products were excluded from the model due to the questionnaire’s focus on staple, main, and side dishes. A previous study using the NHNS data reported that dairy products contributed 4.9%–6.8% of total protein intake among older adults aged ≥65 years.(Reference Ishikawa-Takata and Takimoto3) Although the proportion of protein intake by dairy products was relatively small compared to other food groups, incorporating dairy intake frequency may enhance model accuracy. Fourth, the developed model in this study had moderate accuracy in discriminating the risk of low protein intake (AUC-ROC of 0.71), and further improvement of the model’s accuracy is necessary. Finally, we did not externally validate our predictive model due to a lack of available data. Moreover, this is the first study to develop a model to identify the risk of low protein intake specifically for Asians, but we could not establish its transportability to other Asian countries or settings. Further external validation in diverse populations is essential to assess the model’s generalisability and transportability before clinical implementation. Upon demonstration of the transportability of this model in the future, it can potentially be applied to a wider population and is expected to contribute to the prevention of frailty and sarcopenia in Asia.
Conclusions
We developed a prediction model comprising 12 simple items to identify the risk of low protein intake among community-dwelling older adults. The model offers a simple and rapid method for detecting older adults at high risk of low protein intake and holds potential for broad application in public health settings.
Supplementary material
The supplementary material for this article can be found at https://doi.org/10.1017/jns.2025.10066.
Acknowledgements
We are grateful to all participants of the 2013 and 2017 NHNS and the staff members who supported the survey in each local public health centre and the central office.
Financial support
This work was supported by JSPS KAKENHI [grant number JP21K17654] from the Japan Society for the Promotion of Science.
Competing interests
The authors declare that they have no known competing financial interests or personal relationships that could have appeared to influence the work reported in this paper.
CRediT authorship contribution statement
Yuri Yokoyama: Conceptualisation, data curation, formal analysis, funding acquisition, investigation, methodology, writing – original draft. Takahiro Yoshizaki: Writing – review & editing. Yu Nofuji: Writing – review & editing. Hiroshi Murayama: Writing – review & editing.
Data statement
Permission for the use of the datasets was obtained from the Ministry of Health, Labour and Welfare, Japan. All data belong to the Ministry of Health, Labour and Welfare, Japan, and the database cannot be used for other studies.


 Open access