


Impact statement
Drylands cover about 40% of the Earth’s land surface. Despite scarce water and nutrients, these regions are responsible for about 40% of global net primary productivity. Primary productivity in drylands is enhanced by islands of fertility, which are defined as patches of increased resources (e.g. water and nutrients) and improved soil conditions beneath plant canopies. Islands of fertility are often defined as trees, shrubs or perennial grasses which, largely due to their size, drive the processes that form these islands such as the accumulation of nutrient-rich dust and plant litter as well as water. However, in addition to plants, the microbial community is also a key driver of soil fertility and can dominate land-cover in drylands. This study explores the factors influencing soil fertility across a range of spatial scales. Understanding the variables that affect soil fertility across spatial scales can reveal novel insights into the role of islands of fertility in productivity and land-cover change in dryland ecosystems. These findings highlight the need for additional research to develop our understanding of how ecosystem processes vary across different scales to impact patterns of soil fertility and productivity.
Introduction
Islands of fertility are an inextricable characteristic of drylands and a key driver of productivity in arid and semi-arid ecosystems (Noy-Meir, Reference Noy-Meir1973; Schlesinger et al., Reference Schlesinger, Reynolds, Cunningham, Huenneke, Jarrell, Virginia and Whitford1990; Sala and Aguiar, Reference Sala, Aguiar and West1996; Aguiar and Sala, Reference Aguiar and Sala1999). Fertile islands form through the concentration of resources (e.g. nutrients and water) below plant canopies, as a result of biotic and abiotic processes that occur beneath plants, including the accumulation of nutrient-rich dust and plant litter, the modification of soil water holding capacity, and biological nitrogen fixation by symbiotic microbes associated with shrubs (Schlesinger et al., Reference Schlesinger, Reynolds, Cunningham, Huenneke, Jarrell, Virginia and Whitford1990; Sala and Aguiar, Reference Sala, Aguiar and West1996; Ridolfi et al., Reference Ridolfi, Laio and D’Odorico2008). The concentration of resources creates a biological feedback where improved soil conditions promote growth in vegetated patches, further improving soil fertility compared to bare areas between plants (Charley and West, Reference Charley and West1975; Schlesinger et al., Reference Schlesinger, Reynolds, Cunningham, Huenneke, Jarrell, Virginia and Whitford1990). The formation of fertile islands and the biological feedbacks they create are well understood (e.g. Garner and Steinberger, Reference Garner and Steinberger1989; Sala and Aguiar, Reference Sala, Aguiar and West1996; Okin et al., Reference Okin, las, Saco, Throop, Vivoni, Parsons, Wainwright and Peters2015; Li et al., Reference Li, Gilhooly, Okin and and Blackwell2017; Eldridge et al., Reference Eldridge, Ding, Dorrough, Delgado-Baquerizo, Sala, Gross, Le Bagousse-Pinguet, Mallen-Cooper, Saiz, Asensio, Ochoa, Gozalo, Guirado, García-Gómez, Valencia, Martínez-Valderrama, Plaza, Abedi, Ahmadian, Ahumada, Alcántara, Amghar, Azevedo, Ben Salem, Berdugo, Blaum, Boldgiv, Bowker, Bran, Bu, Canessa, Castillo-Monroy, Castro, Castro-Quezada, Cesarz, Chibani, Conceição, Darrouzet-Nardi, Davila, Deák, Díaz-Martínez, Donoso, Dougill, Durán, Eisenhauer, Ejtehadi, Espinosa, Fajardo, Farzam, Foronda, Franzese, Fraser, Gaitán, Geissler, Gonzalez, Gusman-Montalvan, Hernández, Hölzel, Hughes, Jadan, Jentsch, Ju, Kaseke, Köbel, Lehmann, Liancourt, Linstädter, Louw, Ma, Mabaso, Maggs-Kölling, Makhalanyane, Issa, Marais, McClaran, Mendoza, Mokoka, Mora, Moreno, Munson, Nunes, Oliva, Oñatibia, Osborne, Peter, Pierre, Pueyo, Emiliano Quiroga, Reed, Rey, Rey, Gómez, Rolo, Rillig, le Roux, Ruppert, Salah, Sebei, Sharkhuu, Stavi, Stephens, Teixido, Thomas, Tielbörger, Robles, Travers, Valkó, van den Brink, Velbert, von Heßberg, Wamiti, Wang, Wang, Wardle, Yahdjian, Zaady, Zhang, Zhou and Maestre2024); however, past work has mainly focused on fertile islands at the local plant scale despite evidence that soil fertility, and by extension the fertile island effect (FIE), may vary across multiple scales (Ding and Eldridge, Reference Ding and Eldridge2021; Duniway et al., Reference Duniway, Benson, Nauman, Knight, Bradford, Munson, Witwicki, Livensperger, Van Scoyoc, Fisk, Thoma and Miller2022; Osborne et al., Reference Osborne, Roybal, Reibold, Collier, Geiger, Phillips, Weintraub and Reed2022).
The development of fertile islands and thus the magnitude of the FIE are mainly influenced at three spatial scales: (1) landscape level (e.g. climatic, topographic and edaphic properties), or at the local scales of (2) patch level (e.g. dominant cover type within a patch), and (3) micro-site level (e.g. soil depth, areas with different microbial community compositions) (Ochoa-Hueso et al., Reference Ochoa-Hueso, Eldridge, Delgado-Baquerizo, Soliveres, Bowker, Gross, Le Bagousse-Pinguet, Quero, García-Gómez, Valencia, Arredondo, Beinticinco, Bran, Cea, Coaguila, Dougill, Espinosa, Gaitán, Guuroh, Guzman, Gutiérrez, Hernández, Huber-Sannwald, Jeffries, Linstädter, Mau, Monerris, Prina, Pucheta, Stavi, Thomas, Zaady, Singh and Maestre2018; Ding and Eldridge, Reference Ding and Eldridge2021). At the landscape scale, physical and chemical soil properties (e.g. texture, calcite abundance) and other landscape factors (e.g., slope, elevation, runoff rates, dust or sediment accumulation) vary across landforms (Monger and Bestelmeyer, Reference Monger and Bestelmeyer2006), which can considerably influence ecosystem properties that contribute to the FIE such as nutrient availability, soil moisture content and vegetation cover and distribution (Lajtha and Schlesinger, Reference Lajtha and Schlesinger1988; McAuliffe, Reference McAuliffe1994; Parker, Reference Parker1995; Buxbaum and Vanderbilt, Reference Buxbaum and Vanderbilt2007; Rachal et al., Reference Rachal, Monger, Okin and Peters2012). At the local scale, patch-level (patch type) and microsite-level (soil depth) differences can also affect properties that influence the FIE including heterogeneity of soil nutrients, plant cover and soil microbial community structure. Although past studies have examined the relationship between the FIE and variables including elevation (Thompson et al., Reference Thompson, Walker, Landau and Stark2005), aridity and patch type (Ding and Eldridge, Reference Ding and Eldridge2021), soil depth (Ma et al., Reference Ma, Maestre, Eldridge, Hu and Ye2024), and patch size (Fitzpatrick et al., Reference Fitzpatrick, Stewart, Sutton and Eldridge2024), it remains unclear how geomorphic context may influence the FIE and whether these large-scale changes in soil characteristics could influence the FIE at the patch scale.
Additionally, the FIE is often considered only in the context of plants, as fertile islands are typically defined as islands formed by perennial plants (i.e. shrubs and grasses, see Ding and Eldridge, Reference Ding and Eldridge2021; Ma et al., Reference Ma, Maestre, Eldridge, Hu and Ye2024). However, biocrusts – soil surface aggregates containing communities of cyanobacteria, algae, lichens, mosses and fungi (Pietrasiak et al., Reference Pietrasiak, Regus, Johansen, Lam, Sachs and Santiago2013; Weber et al., Reference Weber, Belnap, Büdel, Antoninka, Barger, Chaudhary, Darrouzet-Nardi, Eldridge, Faist, Ferrenberg, Havrilla, Huber-Sannwald, Malam Issa, Maestre, Reed, Rodriguez-Caballero, Tucker, Young, Zhang, Zhao, Zhou and Bowker2022) – can also enhance soil fertility between plant patches (Bowker et al., Reference Bowker, Reed, Maestre and Eldridge2018; Sepehr et al., Reference Sepehr, Hosseini, Naseri and Gholamhosseinian2022; Maestre et al., Reference Maestre, Biancari, Chen, Corrochano-Monsalve, Jenerette, Nelson, Shilula and Shpilkina2024). Despite their importance to a range of ecosystem processes (e.g. Belnap et al., Reference Belnap, Weber, Büdel, Weber, Büdel and Belnap2016), studies exploring the FIE often only consider biocrusts in relation to plants and not in isolation. Because they play a key role in many ecological processes (e.g. nutrient and moisture content), biocrusts may act as fertile islands (or “mantles,” as in Garcia-Pichel et al., Reference Garcia-Pichel, Johnson, Youngkin and Belnap2003; Reed et al., Reference Reed, Delgado-Baquerizo and Ferrenberg2019) regardless of plant presence to enhance dryland productivity. In biocrusts, the FIE may change at different scale than for plants, as microbial biomass is typically concentrated in the top few centimeters of soil, and the community composition of biocrusts can vary at the scale of centimeters and even millimeters (Garcia-Pichel et al., Reference Garcia-Pichel, Johnson, Youngkin and Belnap2003; Steven et al., Reference Steven, Gallegos-Graves, Belnap and Kuske2013).
This study aimed to compare how the magnitude of the FIE at two soil depths varies across spatial scales (landform and patch type) for both biogeochemical factors (e.g. nutrient availability) and biotic processes (e.g. microbial community structure, extracellular enzymatic activity). We hypothesized that, while the size of the FIE would vary across patch types and soil depth, landform-driven differences would be the largest due to significant edaphic differences between landforms. We also hypothesized that the effect size of most variables would be positive for all patch types, though shrubs would have the largest effect sizes, as plant canopy size generally exhibits a positive relationship with soil resource availability (Fitzpatrick et al., Reference Fitzpatrick, Stewart, Sutton and Eldridge2024).
Methods
Study site
This study was conducted in the Jornada Experimental Range (JER) in southern New Mexico, USA, at the northern extent of the Chihuahuan Desert. Mean annual precipitation in the area is 23 cm, with about 52% of precipitation occurring during the summer monsoon (July 1–September 30) (Greenland and Anderson, Reference Greenland and Anderson1997). Air temperatures range from a monthly average maximum of 36 °C in June to an average minimum of 13 °C in January (Greenland and Anderson, Reference Greenland and Anderson1997). The JER was historically dominated by black grama (Bouteloua eriopoda) grassland but has been transitioning to shrubland in response to factors such as grazing and extreme drought in the last 50–150 years (Peters and Gibbens, Reference Peters, Gibbens, Havstad, Huenneke and Schlesinger2006).The JER has 22 unique soil types, each having high inorganic carbon (calcium carbonate) content and little to no organic matter, distributed across 24 distinct geomorphic units (Gile et al., Reference Gile, Hawley and Grossman1981; Monger, Reference Monger, Havstad, Huenneke and Schlesinger2006).
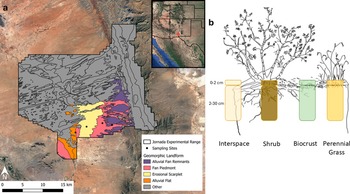
Sites were selected on four distinct geomorphic units (landforms hereafter) along the basin’s piedmont slope, based on the classification described in Monger (Reference Monger, Havstad, Huenneke and Schlesinger2006): (1) alluvial flat – the lowest topographic landform on the slope, characterized by alluvial sediments brought in by sheet floods from upslope; (2) erosional scarplet – a lower portion of piedmont slope with arcuate ridges of quartzose sand deposits derived from the basin floor. Our study focused on the sandy ridges; (3) fan piedmont – the dominant landform on the piedmont slope, largely comprising coalescent alluvial deposits and (4) alluvial fan remnant – the topographically highest landform on the piedmont slope, often containing petrocalcic horizons (see Table 1 for physical and chemical soil properties of each landform and Figure 1a for spatial distribution of sampling sites). Within each landform, three representative patches of four patch types were selected: (1) shrub – below a tarbush (Flourensia cernua) plant canopy; (2) grass – beneath an individual of the dominant grass at each site, tobosa grass (Pleuraphis mutica) or bush muhly (Muhlenbergia porteri); (3) biocrust – soil with a distinct biocrust layer in the plant interspace and (4) interspace – bare, uncrusted soil (Figure 1b).
Table 1. Mean values of physical and chemical soil qualities at each sampling scale

Note: A multiway ANOVA was used to detect significant differences in each variable across landforms, patch types, and soil depths. See Supplementary Table S1 for significant effects.

Figure 1. (a) Map of the study’s sampling sites (shown as black points) along the piedmont slope with the four sampled landforms colored. (b) On each landform, three replicates of each of the four patch types were selected, and soil samples were collected at two depths (0–2 and 2–30 cm). Source: Created by Megan S. Stovall (b).
Soil sampling
Samples were collected in June 2021 using sterile soil sampling techniques. At each patch within a site, we used a 6-cm-diameter corer to collect five soil cores to a depth of 2 cm within a 25 cm2 area. These surface cores were combined into one composite sample representing each patch at each site. This sampling depth was chosen to reflect the typical thickness of topsoil including biological soil crusts in this system. Subsurface (2–30 cm) soil samples (representing a general Bw horizon) were collected from soil pits excavated at the same locations as surface samples at the edge of the plant canopy. Soil pits were 100 cm by 50 cm wide for shrubs and 50 cm × 50 cm for grasses. For biocrust and interspace patches, pits were 25 cm × 25 cm. Pits extended to a depth of 30 cm or the top of the caliche, whichever was shallower. Pits reached caliche at two interspace patches on the alluvial fan remnant. Subsurface soils were collected from the soil profile as a composite sample from a depth of 2–30 cm, focusing consistent sampling within a 25-cm-wide area. Soil samples were transported in a cooler to a 4 °C cool room for storage until processing.
Laboratory analyses
Physical and chemical soil analysis
The fine earth fraction (<2 mm) was obtained by removing litter and gravel and passing soil aggregates through a 2-mm sieve. After sieving, gravel was weighed and compared against total sample weight to determine gravel content. The fine earth fraction was homogenized and split using sterile techniques in a laminar flow hood for soil microbial, chemical, physical and nutrient analyses.
We determined soil pH and electric conductivity (EC) using the saturated paste method using 150–200 g of soil depending on texture via an Oakton Cole-Palmer pH/CON 510 Benchtop Meter (Vernon Hills, IL, USA) (US Salinity Laboratory Staff, 1954). Soil texture was assessed using a Malvern Mastersizer 2000 laser diffractometer (Malvern Instruments Ltd., Worcestershire, UK). Soil particle size distribution was calculated as the percentage of three sizes: sand (2.0–0.063 mm), silt (0.063–0.002 mm), and clay (< 0.002 mm), with gravel >2 mm. Total soil carbon was determined using a LECO SC632 Sulfur/Carbon Determinator (LECO Corporation, MI, USA). Soil inorganic carbon content was determined using a pressure calcimeter (Sherrod et al., Reference Sherrod, Dunn, Peterson and Kolberg2002; Sparks, Reference Sparks2009) – soil was acidified in a sealed bottle, and the resultant CO2 was quantified based on the pressure change. Organic carbon content was determined as the difference between total and inorganic soil carbon.
Microbial community analysis
A 20-g subsample was sent to Ward Laboratories, Inc. (Kearney, NE, USA) for microbial biomass and composition determination by the phospholipid fatty acid method as described in Quideau et al. (Reference Quideau, McIntosh, Norris, Lloret, Swallow and Hannam2016) within 2 weeks of sample collection (Findlay, Reference Findlay, Kowalchuk, de Brujin, Head, Akkermans and van Elsas2004). The Shannon Diversity Index, an index of functional group diversity of the microbial community, was calculated using the “vegan” package in RStudio Version 12.1.402 (Oksanen et al., Reference Oksanen, Simpson, Blanchet, Kindt, Legendre, Minchin, O’Hara, Solymos, Stevens, Szoecs, Wagner, Barbour, Bedward, Bolker, Borcard, Carvalho, Chirico, De Caceres, Durand, Evangelista, FitzJohn, Friendly, Furneaux, Hannigan, Hill, Lahti, McGlinn, Ouellette, Ribeiro Cunha, Smith, Stier, Ter Braak and Weedon2022).
Extracellular enzymatic potential activity
Potential activity of 10 extracellular enzymes (Table 2) was measured using methods modified from Saiya-Cork et al. (Reference Saiya-Cork, Sinsabaugh and Zak2002) and McLaren et al. (Reference McLaren, Buckeridge, Weg, Shaver, Schimel and Gough2017). One gram of soil was blended with modified universal buffer (pH = 7.75), and slurries pipetted onto 96-well microplates along with fluorescing, 4-methylumbelliferone-tagged substrates. Assays were incubated at 20 °C for 3.5 h with half-hourly measurements, ensuring activity was measured in the linear range of the reaction. Sample fluorescence (i.e. cleaved substrate) was read at 360 nm excitation, 460 nm emission (BioTEK Synergy HT microplate reader; BioTek Instruments Inc., Winooski, VT, USA).
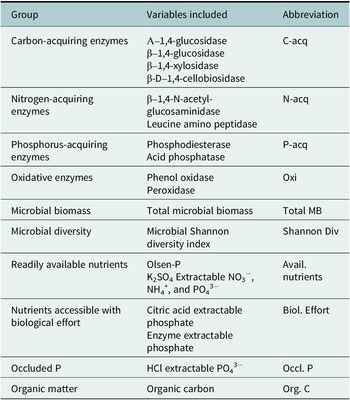
Table 2. Aggregated variables and abbreviations
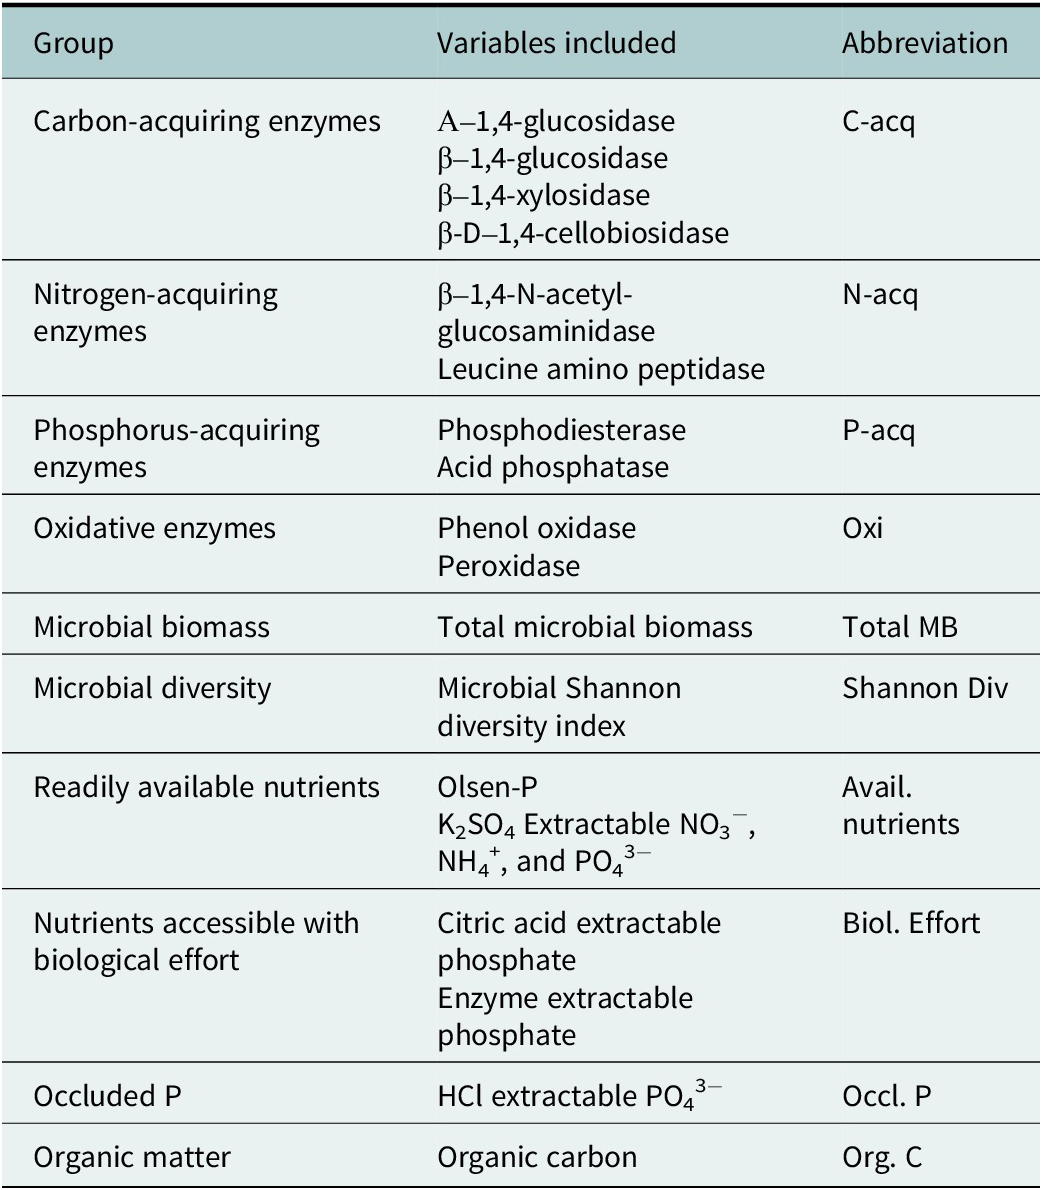
When possible, variables were aggregated based on most closely related biogeochemical or biological processes. Microbial biomass, microbial diversity, occluded P, and organic matter were not closely related to any other variables and were thus separated into distinct categories.
Soil nutrient analysis
Available nitrate (NO3−) and ammonium (NH4+) were determined by extracting 5 g of soil with 25 mL of 0.5 M potassium sulfate and shaking for 2 hours before filtering through glass filter paper. Extracts were analyzed using colorimetric microplate assays with a vanadium (III) chloride assay for nitrate (Doane and Horwáth, Reference Doane and Horwáth2003) and a Berthelot reaction assay for ammonium (Rhine et al., Reference Rhine, Mulvaney, Pratt and Sims1998). Available phosphate (PO43−) was extracted using 30 mL of 0.5 M sodium bicarbonate (pH = 8.5) added to 5 g of soil and shaken for 16 hours before filtering (Olsen, Reference Olsen1954). Biologically based phosphorus pools were measured using the method outlined by DeLuca et al. (Reference DeLuca, Glanville, Harris, Emmett, Pingree, de Sosa, Cerdá-Moreno and Jones2015). Briefly, this method uses four extractants to emulate strategies used by plants or microbes to access P: 0.01 M calcium chloride – P available in soil pore water; 0.01 M citric acid – P sorbed to clay or weakly bound to the soil matrix made accessible through organic acids released by plant roots and microbes; 1 M hydrochloric acid – P strongly bound to mineral surfaces and locked in mineral lattice (e.g. pedogenic carbonate) which is less biologically accessible; and 0.2 EU/mL phosphatase – labile organic P available through enzyme hydrolysis. Extractions were conducted in parallel by shaking 0.5 g of each sample in 10 mL of each extractant for 3 hours before centrifuging at 2500 rpm for 2 minutes and filtering. Phosphate in extracts was analyzed using colorimetric microplate assays (BioTEK Synergy HT microplate reader; BioTek Instruments Inc., Winooski, VT, USA) with a malachite green assay (D’Angelo et al., Reference D’Angelo, Crutchfield and Vandiviere2001).
Numerical and statistical analyses
The FIE size was calculated using the relative interaction index (RII) (Equation 1; Armas et al., Reference Armas, Ordiales and Pugnaire2004) to represent the magnitude of the difference between a fertile island patch and bare interspace soil between plants as described in Ding and Eldridge (Reference Ding and Eldridge2021) and Ochoa-Hueso et al. (Reference Ochoa-Hueso, Eldridge, Delgado-Baquerizo, Soliveres, Bowker, Gross, Le Bagousse-Pinguet, Quero, García-Gómez, Valencia, Arredondo, Beinticinco, Bran, Cea, Coaguila, Dougill, Espinosa, Gaitán, Guuroh, Guzman, Gutiérrez, Hernández, Huber-Sannwald, Jeffries, Linstädter, Mau, Monerris, Prina, Pucheta, Stavi, Thomas, Zaady, Singh and Maestre2018):
 $$ \mathrm{RII}=\left({\mathrm{X}}_{\mathrm{p}}-{\mathrm{X}}_{\mathrm{i}}\right)/\left({\mathrm{X}}_{\mathrm{p}}+{\mathrm{X}}_{\mathrm{i}}\right), $$
where Xp is the value of the biotic (e.g. microbial biomass) or abiotic (e.g. available nutrients) variables for the patch type of interest, and Xi is the value of the same attribute in the interspace soils from the same site and soil depth. RII ranged from −1 to 1, where positive values showed increased soil fertility compared to interspace soils, and negative values reflected a decrease in the variable relative to the interspace. We calculated the RII for each cover type and soil depth combination, considering the RII to be significantly positive or negative when the mean ± one standard error (SE) did not intersect zero.
We aggregated closely related variables based on the biogeochemical processes to which each variable was most closely related (Table 2) and calculated the mean RII of the selected variables for each sample. The FIE of each aggregated group was analyzed using a multi-factor analysis of variance (ANOVA) with the main factors such as landform, patch type and soil depth. In the presence of multi-factor interactions, aggregated variables were separated by factor and analyzed using a one-way ANOVA followed by a Tukey’s HSD post-hoc test. Plots were made using the “ggplot2” package in R Version 12.1.402 (Posit team, 2024; Wickham, Reference Wickham2016). Assumptions of normality were tested using the Shapiro–Wilk test. When needed, variables were transformed to meet the assumptions; figures present untransformed data.
Results
Physical and chemical soil characteristics
Soil particle size varied across all spatial scales (landform, patch type and soil depth; Table 1). For most variables related to particle size, there was a significant interaction between all three spatial scales (Supplementary Table S1). Generally, gravel and sand content were lowest and silt and clay highest at the basin floor (alluvial flat); these increased or decreased respectively up the piedmont slope. Gravel content was marginally higher in the unvegetated soils, while soils beneath grasses and shrubs had higher sand content and lower silt and clay content than the other patch types for three out of four landforms. Surface soils had higher gravel, silt, and clay but lower sand content than subsurface soils.
Differences in soil EC varied at all spatial scales, with the multi-way ANOVAs revealing a significant three-way interaction between landforms, patch types and soil depths (Table 1 and Supplementary Table S1). EC in surface soils was generally higher than in subsurface soils beneath shrubs and grasses but not in biocrust and interspace patches. In surface soils, EC was significantly higher below all cover types compared to interspaces. The magnitude of these differences largely depended on landform. In subsurface soils, EC below shrubs, grasses and biocrusts was higher than interspace soils in upland landforms, and this difference decreased downslope. In the alluvial flat, the EC in subsurface soils in all vegetated patches was lower than in interspace soils. Soil pH ranged from 7.20 to 7.47. pH was elevated at the top of the piedmont slope (alluvial fan remnant) compared to the other landforms. pH was similar across patch types and soil depths.
Landscape-scale variations in the FIE
There was a significant landform effect or an interaction between landform and another factor for the FIE of all aggregated variables except organic carbon (Figures 2 and 3; Supplementary Tables S2 and S3). Landform effects interacted with soil depth for microbial diversity, N-acquiring enzymes, oxidative enzymes, available nutrients, unavailable nutrients and nutrients requiring biological effort.
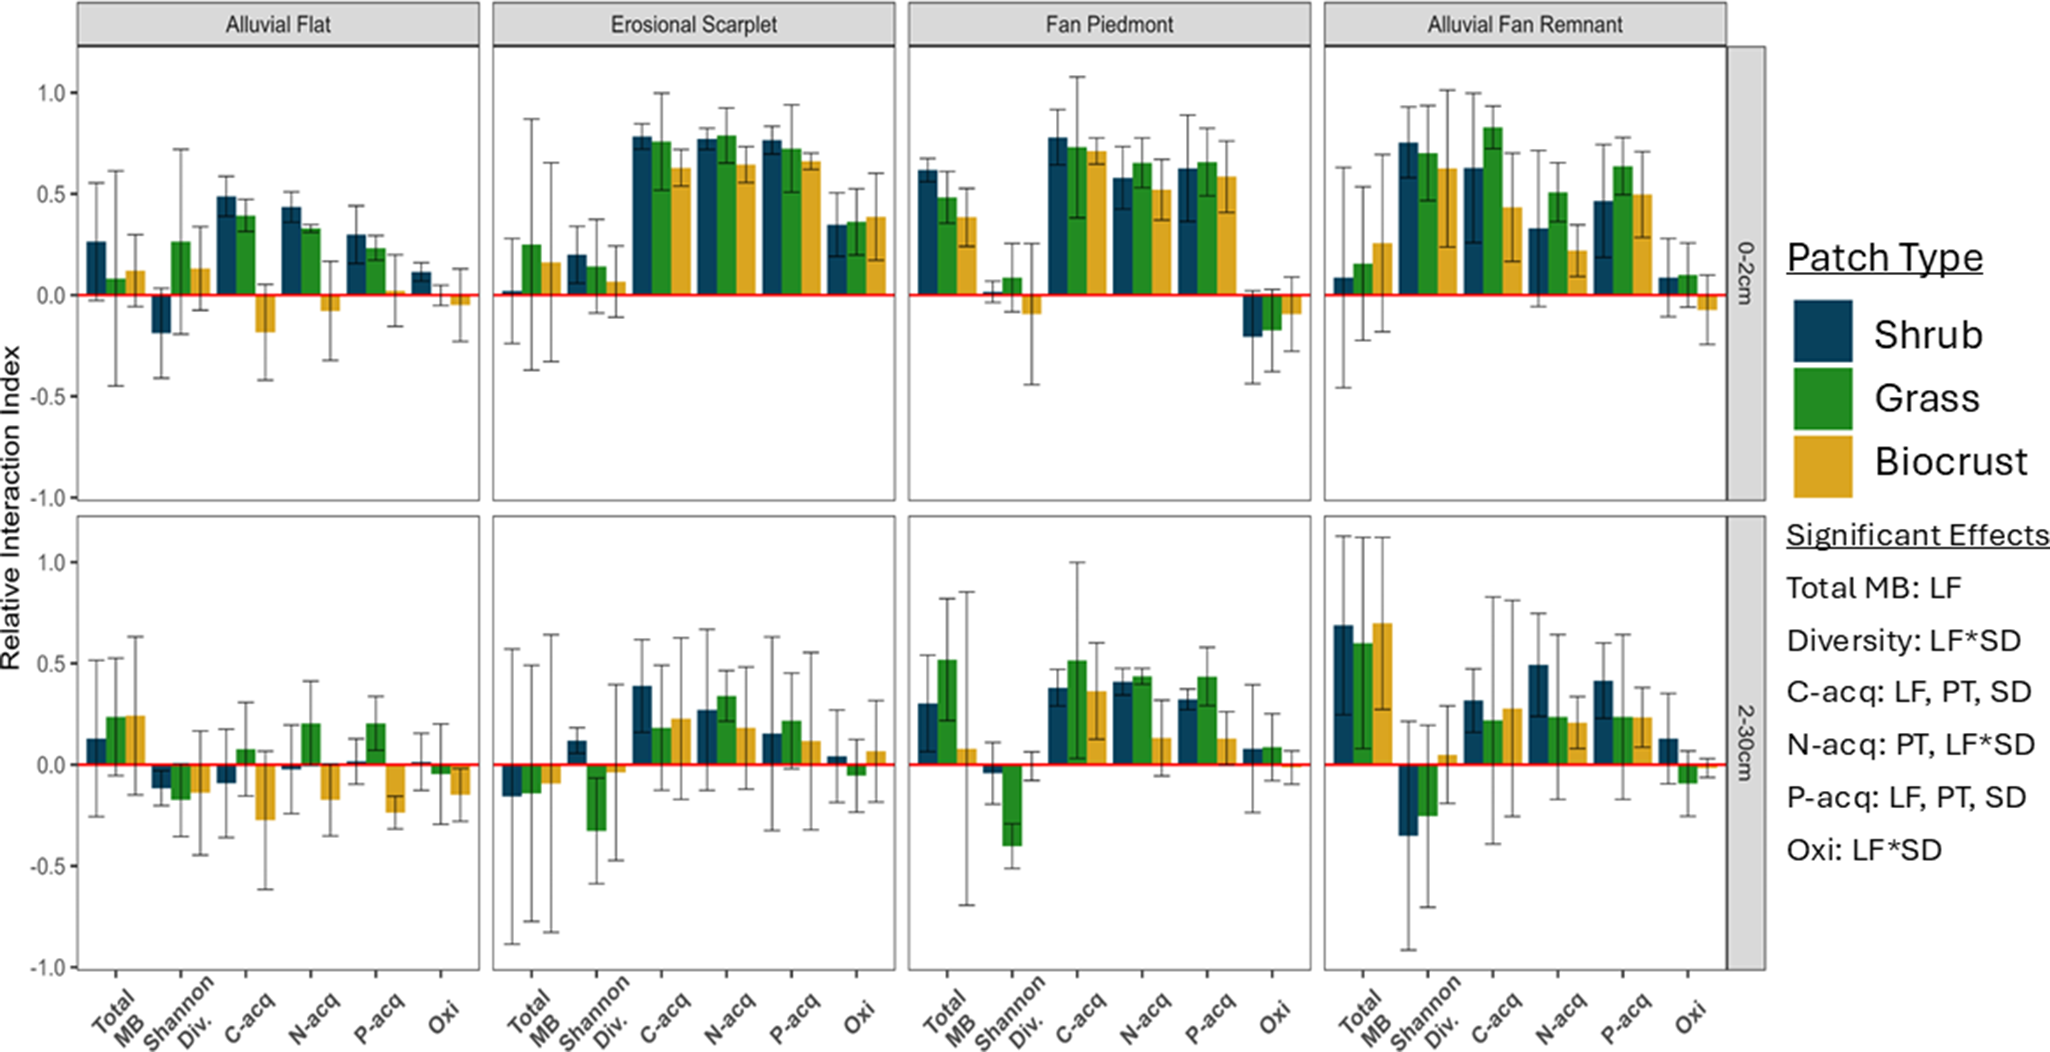
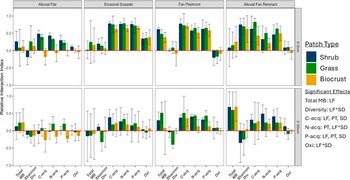
Figure 2. Differences in the fertile island effect for variables related to microbial community activity across geomorphic LFs, PTs, and SDs. Note: The fertile island effect is displayed as the relative interaction index (RII), described in Equation 1. Bar height represents the mean of replicates (n = 3) within a sampling site, and error bars show one standard error. RII is considered either positive or negative if the mean ± SE does not intersect 0. Significant ANOVA effects (p < 0.05) are displayed. Interactive effects are displayed as two factors joined with an asterisk. LF, landform; PT, patch type; SD, soil depth.

Figure 3. Differences in the fertile island effect for variables related to nutrient availability and soil organic matter across geomorphic LFs, PTs, and SDs. Note: The fertile island effect is displayed as the relative interaction index (RII), described in Equation 1. Bar height represents the mean of replicates (n = 3) within a sampling site, and error bars show one standard error. RII is considered either positive or negative if the mean ± SE does not intersect 0. Significant ANOVA effects (p < 0.05) are displayed. Interactive effects are displayed as two factors joined with an asterisk. LF, landform; PT, patch type; SD, soil depth.
The FIE of total microbial biomass was smaller at the bottom of the piedmont slope (alluvial flat and erosional scarplet) than the upper slope (fan piedmont and alluvial fan remnant). Similarly, the FIE of microbial diversity in surface soils was around zero in lower landforms and significantly higher at the top of the slope. In subsurface soils, microbial diversity had a negative or zero FIE across all landforms.
The FIE of both C- and P-acquiring enzymes was smallest at the bottom of the piedmont slope (alluvial flat), with no difference between the other three landforms. The FIE of N-acquiring enzymes followed the same trend but only in subsurface soils. In surface soils, the FIE of N-acquiring enzymes was elevated in the middle of the piedmont slope (erosional scarplet and fan piedmont) compared to the top and bottom of the slope (alluvial flat and alluvial fan remnant). The FIE of oxidative enzymes in surface soils was positive in the erosional scarplet, negative in the fan piedmont, and absent at the top and bottom of the slope. In subsurface soils, oxidative enzymes showed little to no FIE across all landforms. In surface soils, available nutrients and biologically acquired nutrients exhibited a positive FIE in all landforms except at the top of the slope, where biologically acquired nutrients had a negative FIE. The FIE of HCl-extracted P was positive in the erosional scarplet and negative in all other landforms. In subsurface soils, all forms of nutrients followed a similar trend – the FIE was about 0 in the alluvial flat and fan piedmont, less than or around 0 in the erosional scarplet, and positive at the top of the slope (alluvial fan remnant).
Patch-level variations in the FIE
Patch-level effects were present only for C-, N-, and P-acquiring enzymes and available nutrients (Figures 2 and 3 – significant effects). Although the FIE of C- and P-acquiring enzymes showed an effect of patch type, post-hoc analysis did not show significant differences between patch types. The FIE of N-acquiring enzymes was suppressed beneath biocrusts compared to shrubs and grasses.
The patch-level effect on the FIE of available nutrients interacted with soil depth (Figure 3 – significant effects). The effect of patch type was only evident in surface soils, where the FIE of available nutrients below biocrusts was smaller than that of shrubs and grasses.
Microsite-level variations in the FIE
Soil depth only significantly affected C- and P-acquiring enzymes and organic C (Figures 2 and 3 – significant effects) independent of other spatial scales. The FIE of organic C was larger in surface soils than subsurface soils. C- and P-acquiring enzymes had a similar trend, where the FIE was on average higher in surface soils than subsurface soils.
Discussion
We examined the magnitude of the FIE on a range of biogeochemical and microbial variables at two soil depths (0–2 and 2–30 cm) across multiple patch types (shrub, perennial grass and biocrust) in four landforms which varied in age and geomorphology. Our results reinforce the prevalence of the FIE in dryland ecosystems – metrics of soil fertility were generally higher below shrubs, grasses and biocrusts compared to bare interspace soils. However, the size of the FIE varied considerably across spatial scales, revealing distinct trends at each scale. These trends varied between response variables, suggesting that the magnitude and importance of the FIE may ultimately depend on a variety of biogeochemical and biological processes acting at vastly different spatial scales.
We found that the presence or size of the FIE is mainly influenced by variability in physical soil properties like texture at the landscape and microsite scales. Meanwhile, multiple patch types had a significant impact on nutrient availability and access, and differences in the FIE between patch types were consistent across the landscape (Figures 2 and 3). Although landform-level effects had a substantial impact on soil fertility as hypothesized, soil depth was similarly important, illustrating the highly variable nature of dryland soils, which can vary both across the landscape and within 2 cm in a soil profile. Surprisingly, the FIE was similar between biotic patch types for many response variables, with soils from biocrusts and grasses sometimes exhibiting an effect equal to or larger than shrubs, and these patch-specific effects influenced the FIE independently from the effects of landforms and soil depths.
The Fertile Island Effect is widespread across spatial scales
While patterns in the FIE varied across the spatial scales considered here, measured variables generally exhibited a positive FIE across all landforms in all or most patch types (Figures 2 and 3). Our results reinforce and expand our current understanding of the FIE (Garner and Steinberger, Reference Garner and Steinberger1989; Ochoa-Hueso et al., Reference Ochoa-Hueso, Eldridge, Delgado-Baquerizo, Soliveres, Bowker, Gross, Le Bagousse-Pinguet, Quero, García-Gómez, Valencia, Arredondo, Beinticinco, Bran, Cea, Coaguila, Dougill, Espinosa, Gaitán, Guuroh, Guzman, Gutiérrez, Hernández, Huber-Sannwald, Jeffries, Linstädter, Mau, Monerris, Prina, Pucheta, Stavi, Thomas, Zaady, Singh and Maestre2018; Eldridge et al., Reference Eldridge, Ding, Dorrough, Delgado-Baquerizo, Sala, Gross, Le Bagousse-Pinguet, Mallen-Cooper, Saiz, Asensio, Ochoa, Gozalo, Guirado, García-Gómez, Valencia, Martínez-Valderrama, Plaza, Abedi, Ahmadian, Ahumada, Alcántara, Amghar, Azevedo, Ben Salem, Berdugo, Blaum, Boldgiv, Bowker, Bran, Bu, Canessa, Castillo-Monroy, Castro, Castro-Quezada, Cesarz, Chibani, Conceição, Darrouzet-Nardi, Davila, Deák, Díaz-Martínez, Donoso, Dougill, Durán, Eisenhauer, Ejtehadi, Espinosa, Fajardo, Farzam, Foronda, Franzese, Fraser, Gaitán, Geissler, Gonzalez, Gusman-Montalvan, Hernández, Hölzel, Hughes, Jadan, Jentsch, Ju, Kaseke, Köbel, Lehmann, Liancourt, Linstädter, Louw, Ma, Mabaso, Maggs-Kölling, Makhalanyane, Issa, Marais, McClaran, Mendoza, Mokoka, Mora, Moreno, Munson, Nunes, Oliva, Oñatibia, Osborne, Peter, Pierre, Pueyo, Emiliano Quiroga, Reed, Rey, Rey, Gómez, Rolo, Rillig, le Roux, Ruppert, Salah, Sebei, Sharkhuu, Stavi, Stephens, Teixido, Thomas, Tielbörger, Robles, Travers, Valkó, van den Brink, Velbert, von Heßberg, Wamiti, Wang, Wang, Wardle, Yahdjian, Zaady, Zhang, Zhou and Maestre2024). First, all biotic patch types (including biocrusts) typically had enriched soil (e.g. elevated soil nutrients), elevated soil microbial activity (enzymatic activity, microbial biomass), more available soil moisture and increased organic matter across all landforms compared to bare interspace soils. Additionally, the coarser soils below grasses and shrubs compared to unvegetated patches shows that vegetation stabilizes the soil and captures aeolian sediments, especially larger particles like sand. Finally, the FIE was more apparent in surface soils (0–2 cm), though it was also observed in subsurface soils (2–30 cm) depending on landform and patch type. The elevated FIE in surface soils reflects the concentration of microbial activity and plant roots close to the soil surface; unsurprisingly, biological activity was generally higher where soil fertility was higher (Gibbens and Lenz, Reference Gibbens and Lenz2001; Taylor et al., Reference Taylor, Wilson, Mills and Burns2002; Kirschner et al., Reference Kirschner, Xiao and Blilou2021).
Occluded P presents a notable exception to the trend of a positive FIE. Occluded P exhibited a positive FIE in both surface and subsurface soils in only one landform (erosional scarplet for surface and alluvial fan remnant for subsurface), and the FIE of occluded P was either absent or negative in all other landforms. The negative FIE in surface soils under all cover types compared to the interspace reflects the variety of effects that plants and biocrusts can have on nutrient cycling (Hobbie, Reference Hobbie1992; Delgado-Baquerizo et al., Reference Delgado-Baquerizo, Maestre, Escolar, Gallardo, Ochoa, Gozalo and Prado-Comesaña2014; Maestre et al., Reference Maestre, Biancari, Chen, Corrochano-Monsalve, Jenerette, Nelson, Shilula and Shpilkina2024). P is made unavailable through leaching to deeper soils or sorption to pedogenic carbonate in the soil; these processes may be increased in interspace soils where plants and microbes are not actively cycling the available P (Guppy et al., Reference Guppy, Menzies, Moody and Blamey2005; Belnap, Reference Belnap, Bünemann, Oberson and Frossard2011). As a result, this “stagnant” P may be more vulnerable to occlusion and leaching, thus decreasing P availability. The lack of a significant FIE on occluded P in subsurface soils in these landforms may show a comparably small influence of plant and microbial activity on P cycling compared to surface soils. As droughts and heat waves increase in frequency and severity, the increased occlusion of available P due to decreased biological demand could degrade dryland soil fertility, causing significant negative feedbacks in P cycling in arid regions.
The soil-geomorphic template influences the magnitude of the Fertile Island Effect
Geomorphology is the primary long-term control in structuring dryland landscapes and developing into units of similar soil properties and ecological conditions designated as the soil-geomorphic template, a conceptual framework predicting vegetation, animal and microbial community composition and structure (Monger, Reference Monger, Havstad, Huenneke and Schlesinger2006; Monger and Bestelmeyer, Reference Monger and Bestelmeyer2006). Under the soil-geomorphic template, biotic processes are influenced by variation in soil properties (e.g. texture, salinity), topography (e.g. elevation, aspect), microclimate and parent material. Accordingly, the soil-geomorphic template considers many factors directly relevant to soil fertility including water, nutrients, root development and plant anchorage, and may help predict patterns of soil fertility in dryland systems as suggested in our study.
Due to their proximity (<10 km between sites), our study sites had similar climate, parent material and dominant vegetation types; consequently, differences in topography and soil properties (e.g. particle size, soil moisture) likely explain much of the variation between sampling sites. Lower elevation landforms typically had a gentle slope and fine-textured soils while higher elevations had a steeper slope and gravelly, coarser-textured soils. Although soil texture class did not change dramatically across the landscape (soils ranged from silty loam at the base of the slope to sandy loam at the top), sand and gravel contents did increase substantially with elevation, indicating the role of geomorphology in determining soil texture (Table 1). However, biotic processes can also alter texture, evidenced by coarser soils beneath shrubs and grasses compared to unvegetated patches (Table 1). This effect is the strongest at the bottom of the slope with finer soil texture, possibly because wind would be strongest at low elevations, thus increasing the trapping of coarse sediments by plants and biocrusts, while the weak effect at the top of the slope indicates that coarse sediments accumulate regardless of vegetation or biocrust presence.
Soil texture directly influences an array of ecosystem processes including water and nutrient availability, microbial activity, plant survival and recruitment and C storage (Silver et al., Reference Silver, Neff, McGroddy, Veldkamp, Keller and Cosme2000; Osborne et al., Reference Osborne, Roybal, Reibold, Collier, Geiger, Phillips, Weintraub and Reed2022; Veblen et al., Reference Veblen, Nehring, Duniway, Knight, Monaco, Schupp, Boettinger, Villalba, Fick, Brungard and Thacker2022). However, we found that regardless of texture or topography, soil salinity (measured as electrical conductivity, Table 1), a proxy for water availability in such water-scarce environments, was higher in surface soils beneath plants than in unvegetated soils in all landforms. The consistency of this effect indicates plants’ ability to increase water availability and improve soil conditions beneath their canopies across a range of geomorphic conditions (Sala and Aguiar, Reference Sala, Aguiar and West1996; Fitzpatrick et al., Reference Fitzpatrick, Stewart, Sutton and Eldridge2024). The increased salinity beneath plants may also stem from hydraulic lift, wherein plant roots bring potentially saline water from lower soil layers to the soil’s surface (Caldwell et al., Reference Caldwell, Dawson and Richards1998; Armas et al., Reference Armas, Padilla, Pugnaire and Jackson2010). Additionally, the accumulation of litter and sediment beneath plants can increase decomposition, further explaining the elevated electrical conductivity in vegetated patches (Xu et al., Reference Xu, Shi, Li, Rey, Ruan, Craine, Liang, Zhou and Luo2016; Stavi et al., Reference Stavi, Rachmilevitch and Yizhaq2019; Anjum and Khan, Reference Anjum and Khan2021). While vegetation’s effect on soil moisture persisted regardless of landform, the magnitude of the effect varied: the difference in salinity between vegetated and unvegetated patches was greatest at the valley floor where water availability is often highest, increasing accumulation around plants (Table 1). That the effect of vegetation can vary dramatically across landforms implies that landscape position plays a role in determining the strength of the FIE.
Variations in the FIE of both biogeochemical and microbial factors were observed across the landscape, which may be explained in part by processes comprising the soil-geomorphic template. The FIE of variables related to microbial activity (i.e. biomass, diversity, enzymatic activity) was generally highest at the top of the piedmont slope and lowest at the valley floor (Figure 2). However, nutrient availability generally exhibited the opposite trend, with a larger FIE in fine-textured soils at the bottom of the slope, though FIE was generally positive across all landforms (Figure 3). Additionally, the FIE of microbial activity and available nutrients was positive in both coarse and fine soils, indicating higher levels of each below fertile islands compared to interspace soils, but differences between fine and coarse soils were more pronounced for microbial activity than nutrient availability. The contrast between microbial activity and nutrient availability illustrates that fertile islands may differentially affect different biogeochemical processes depending on their geomorphic context. Naturally, factors not considered in this study such as heterogeneity of local precipitation, grazing intensity or time since patch formation likely contribute to the observed trends (Schlesinger et al., Reference Schlesinger, Reynolds, Cunningham, Huenneke, Jarrell, Virginia and Whitford1990; Ridolfi et al., Reference Ridolfi, Laio and D’Odorico2008; Allington and Valone, Reference Allington and Valone2014). The soil-geomorphic template provides a framework in which to consider and potentially predict how patterns of soil fertility may vary across a range of geomorphic conditions.
Patterns in the Fertile Island Effect across patch types are consistent across landforms
Islands of fertility are typically defined as vegetated patches, often shrubs or grasses, that improve soil conditions below their canopies (Schlesinger et al., Reference Schlesinger, Reynolds, Cunningham, Huenneke, Jarrell, Virginia and Whitford1990; Allington and Valone, Reference Allington and Valone2014) while biocrusts in this context are typically only considered alongside vegetation (e.g. Ding and Eldridge, Reference Ding and Eldridge2021). We provide evidence that unvegetated patches with pronounced biocrust cover can exhibit an FIE of similar strength to that of grasses and shrubs across key metrics of soil fertility. This finding necessitates further investigation into the ability of biocrusts to act as fertility islands (or “mantles,” see Garcia-Pichel et al. (Reference Garcia-Pichel, Johnson, Youngkin and Belnap2003)) independently from vegetation. Proposed mechanisms explaining the origins of fertile islands often center on the initial establishment of the shrubs that in time become an island (see Sala and Aguiar, Reference Sala, Aguiar and West1996; Ridolfi et al., Reference Ridolfi, Laio and D’Odorico2008); our study contributes to a growing body of evidence that the formation of fertile island may be supported in part by facilitation from biocrust communities (e.g. Sepehr et al., Reference Sepehr, Hosseini, Naseri and Gholamhosseinian2022).
Despite the widespread landform effects on the FIE and the differences in physical soil characteristics between landforms, the effects of patch type on the FIE remained consistent across the landscape. Patch type effects on the FIE were limited to variables related to nutrient availability and acquisition (available nutrients and extracellular enzymatic activity), and these effects were largely unaffected by landform-level differences (Figures 2 and 3). The lack of an interactive effect between landforms and patch types on the FIE of available nutrients and enzymatic activity suggests that large, landscape-scale differences in soil properties do not affect the patch-level biological processes influencing nutrient availability and acquisition. Plants and biocrusts can act as ecosystem engineers to modify and improve soil conditions (van Breemen and Finzi, Reference van Breemen and Finzi1998; Xiao et al., Reference Xiao, Bowker, Zhao, Chamizo and Issa2022), and the microbial community may play a similar role through the use of extracellular enzymes. Consequently, plant and microbial activity may be more influential than landscape-scale processes in producing the patch-scale patterns described in this study.
However, patch-level effects on the FIE of available nutrients did differ across soil depths. The interactive effect between patch type and soil depth on available nutrients may be explained partly by the difference in soil depths that different organisms can access. Microbes are typically concentrated in the soil surface (topsoil) or around roots, while plant roots can extend deeper into the soil profile (Gibbens and Lenz, Reference Gibbens and Lenz2001; Garcia-Pichel et al., Reference Garcia-Pichel, Johnson, Youngkin and Belnap2003; Kirschner et al., Reference Kirschner, Xiao and Blilou2021). Thus, microbial uptake may be a dominant form of nutrient uptake in the top 2 cm of all patch types – but especially biocrusts – while uptake by plant roots and associated microbes may be dominant in deeper soils beneath grasses and shrubs. Our findings stress the importance of patch type, as each patch type can distinctly influence the FIE regardless of geomorphological context. The patch types considered in this study exhibited a positive FIE across many response variables and vastly different spatial scales, and the effect was often comparable between patch types, indicating that shrubs, grasses and biocrusts can all similarly affect soil fertility.
Conclusion
Our findings provide evidence that interactions between soil geomorphology and soil fertility vary across spatial scales while also demonstrating that biogeochemical processes are differentially affected by geomorphology depending on both biotic and abiotic processes. This new understanding of the relationship between geomorphology and soil fertility necessitates a more interdisciplinary approach to studying patterns of productivity in dryland ecosystems. Including the influences of processes acting on the FIE – and thus productivity – at a range of spatial scales will help improve models of dryland productivity and land-cover change. Additionally, our results show that biological soil crusts may also act as fertile islands; expanding our perception of fertile islands to include biocrusts in addition to perennial plants may reveal novel insights into the factors driving this key dryland phenomenon. These findings necessitate further work to improve our understanding of how ecosystem processes vary across scales to influence patterns of soil fertility and productivity.
Open peer review
For open peer review materials, please visit https://doi.org/10.1017/dry.2025.10004
Supplementary material
The supplementary material for this article can be found at http://doi.org/10.1017/dry.2025.10004.
Data availability statement
Data are available from the Environmental Data Initiative repository at https://doi.org/10.6073/pasta/9085a63e6ff1e310f13784b6fa0f8616.
Acknowledgements
We thank John Anderson and the Jornada LTER for logistical support in site selection and Sasha Reed for her help conceptualizing this paper. Laboratory analyses and field sampling were conducted by Kate Merrill, Mariana Lafón, Karina Tovar, Adrianna Tafoya, Tricia Tellez, Michelle Quiroz, Andrew Dominguez and Jessica Mikenas.
Author contribution
Dylan J. Stover: Writing – original draft preparation, review and editing, investigation, visualization, data curation. Lixin Jin: Writing – review and editing, methodology, investigation, funding acquisition, data curation. Nicole Pietrasiak: Writing – review and editing, methodology, investigation, data curation. Jennie R. McLaren: Writing – review and editing, methodology, data curation, supervision.
Financial support
This research was supported by the National Science Foundation (NSF EAR 2012475). Karina Tovar and Adrianna Tafoya were awarded the Jornada Jornada Basin Long-Term Ecological Research Program REU Fellowship (grant no. NSF DEB 2025166); Kate Merrill was awarded the Chihuahuan Desert Biodiversity REU Award (grant no. NSF DBI 1950810).
Competing interests
The authors declare that they have no competing interest.


 Open access
Comments
January 17, 2025
Drylands, Editors in Chief, Professors Osvaldo Sala and David Eldridge
Dear Drs. Sala and Eldridge,
We would like to submit our manuscript entitled “Multi-scale influences on the fertile island effect: Landscape-scale and patch-level processes drive patterns of soil fertility in the Chihuahuan Desert” for publication as a “Research Article” in Cambridge Prisms’ Drylands.
In this paper, we addressed the question, “How does the the fertile island effect vary across spatial scales for both biogeochemical factors and biotic processes?” The fertile island effect is a key driver of productivity in dryland ecosystems, and determining how geomorphology and cover type (e.g. shrub, grass, biocrust, bare soil) influence this effect is vital to understanding how patterns of productivity and soil fertility vary across spatial scales depending on geomorphological and ecological context. To address this question, we measured a suite of physical, biogeochemical, and microbial factors across three spatial scales – geomorphic landform, individual patches (shrub, grass, bare soil, biocrust), and soil depth within a core and calculated the Relative Interaction Index (Armas et al. 2004) to determine the size of the fertile island effect.
Our key findings are:
1) The fertile island effect is widespread across all spatial scales, reinforcing our current understanding of fertile islands in drylands.
2) Geomorphology influences the magnitude of the fertile island effect, and the soil-geomorphic template may be a valuable tool for predicting patterns in soil fertility across landscapes. Variations in the fertile island effect of both biogeochemical and microbial variables were explained in part by geomorphological factors including soil texture and topography.
3) The fertile island effect varies across patch types, but these patterns are consistent across landforms, suggesting that plants and biological soil crusts can influence soil fertility in distinct, patch-specific ways. Additionally, unvegetated patches with pronounced biocrust cover exhibited a fertile island effect of similar strength to grasses and shrubs, indicating the ability of biocrusts to act as islands (or “mantles”) of fertility independently from vegetation.
We believe this paper is relevant for Drylands because we pose new questions about our current understanding of islands of fertility and their relationship with geomorphology, an inextricable characteristic of dryland ecosystems. Editors of this journal have published influential articles about this topic, and this research article will introduce new ideas to this discourse.
We have no conflicts of interest to disclose. In the anticipation that you feel this manuscript is appropriate for Drylands, we suggest the following reviewers:
1. Brooke Osborne, Utah State University;
2. Scott Collins, University of New Mexico;
3. Jingyi Ding, Beijing Normal University
Sincerely,
Dylan J. Stover (The University of Texas at El Paso)
Nicole Pietrasiak (University of Nevada Las Vegas)
Lixin Jin (The University of Texas at El Paso)
Jennie R. McLaren (The University of Texas at El Paso)
Current contact information for corresponding author, Dylan Stover
Department of Biological Sciences
University of Texas at El Paso
El Paso, Texas, 79968, USA
1-760-519-5631 (mobile)
djstover@miners.utep.edu