


I. Introduction and problem statement
Vines are one of the most fungicide intensive crops. In Germany, for example, 17% of the total fungicide mass is applied in viticulture, although wine is only grown on 0.6% of agricultural land (own calculations based on JKI, n.d.; Umweltbundesamt, 2023). The majority of fungicide treatments are used to combat the diseases powdery mildew and downy mildew (Roßberg and Ipach, Reference Roßberg and Ipach2015). Fungus-resistant grape varieties (FRGVs) could potentially lead to reductions between 50 and 100% in fungicide usage, depending on the variety and the yearFootnote 1 (Eisenmann et al., Reference Eisenmann, Wingerter, Dressler, Freund, Kortekamp and Bogs2023; Wingerter et al., Reference Wingerter, Eisenmann, Weber, Dry and Bogs2021). Although it would be theoretically possible to completely dispense with fungicides, this is not recommended due to the risk of new resistance-breaking pathogens emerging (Trapp and Töpfer, Reference Trapp and Töpfer2023).
The use of fungicides to combat mildew poses risks to human health, the environment, and biodiversity (Cappellari et al., Reference Cappellari, Malagnini, Fontana, Zanotelli, Tonidandel, Angeli, Ioriatti and Marini2024; Geiger et al., Reference Geiger, Bengtsson, Berendse, Weisser, Emmerson, Morales, Ceryngier, Liira, Tscharntke, Winqvist, Eggers, Bommarco, Pärt, Bretagnolle, Plantegenest, Clement, Dennis, Palmer, Oñate and Inchausti2010). Furthermore, the cultivation of FRGVs could contribute to the goals of the Farm-to-Fork strategyFootnote 2 (Richter and Hanf, Reference Richter and Hanf2022).
Besides the ecological advantages, there is the potential to achieve overall cost reductions. For example, Sambucci et al. (Reference Sambucci, Alston, Fuller and Lusk2019) estimate the cost of powdery mildew control in Californian grape production at $239 million per year, with $176 million of those costs attributable to wine production.Footnote 3 Dressler (Reference Dressler2024) shows that growing FRGVs in Germany can reduce pesticide management costs per hectare by 46–75%, that is, up to €1,000.
Notwithstanding their considerable economic and ecological potential, FRGVs have thus far been cultivated only on a limited scale. Germany is the leading country in FRGV cultivation worldwide (Anderson and Nelgen, Reference Anderson and Nelgen2020), with approximately 4,400 ha (4%) of its vineyard area dedicated to these varieties (Statistisches Bundesamt, 2025), compared to just 1,200 ha (0.1%) in France (Dolet et al., Reference Dolet, Paire, Cheriet, Geffroy, Le Fur, Hannin, Samson, Caillé, Nougarède, Olivier and Chervin2024).Footnote 4 However, it should be noted that 4% of Germany’s vineyard area represents only a marginal proportion, particularly when considering the positive characteristics of these grape varieties in terms of sustainability.
An important reason for the low cultivation of these varieties is that distributing the wine produced from them is challenging for producers (Kiefer and Szolnoki, Reference Kiefer and Szolnoki2024a; Richter and Hanf, Reference Richter and Hanf2022; Zachmann et al., Reference Zachmann, McCallum and Finger2024). One of the main difficulties is that consumers are not familiar with FRGVs (Pedneault and Provost, Reference Pedneault and Provost2016). However, familiarity with a grape variety has a significant influence on purchasing decisions (Nesselhauf et al., Reference Nesselhauf, Fleuchaus and Theuvsen2019). As a result, FRGVs are predominantly marketed through direct sales channels, supported by extensive marketing efforts (Finger et al., Reference Finger, Zachmann and McCallum2023; Kiefer and Szolnoki, Reference Kiefer and Szolnoki2024a). Therefore, evaluating the market potential of FRGV wines necessitates a closer examination of the direct marketing segment.
In Germany, direct marketing—defined as sales made directly from the winery, including online transactions—accounts for 15% of the total wine market volume (Deutsches Weininstitut, n.d.). In contrast, 64% of total sales volume occurs through the retail trade (Deutsches Weininstitut, n.d.). Compared to retail, direct marketing tends to attract consumers who place higher importance on wine, possess greater knowledge about it, and are willing to pay higher prices (Dressler, Reference Dressler2018). A recent discrete choice experiment in Germany suggests that FRGV wines can achieve an increased willingness to pay among consumers informed about their environmental benefits, compared to conventional varieties (Kiefer and Szolnoki, Reference Kiefer and Szolnoki2024b).
Against this background—the environmental and economic benefits, and the potential willingness to pay, this paper investigates the role of FRGVs in the German direct sales wine market. We aim to answer the following research questions:
(1) Are producers demanding price premiums (PPs) for these grape varieties?
(2) Are the value-adding attributes different between FRGV wines and wines produced from conventional grape varieties?
To address these questions, a dataset of approximately 74,000 German wines listed in the wine guide “Der Eichelmann” was analyzed with a hedonic pricing model (HPM). This information can help to better understand consumers’ purchasing criteria in the future and to tailor marketing measures more closely to the relevant characteristics of FRGV wines.
Due to the complexity of the highly differentiated wine market, HPMs are frequently applied to analyze wine prices in different product categories or countries. Núñez et al. (Reference Núñez, Martín‐Barroso and Velázquez2024) identified 223 publications on hedonic price models for wine spanning the years 1993 to 2021. A multitude of studies have demonstrated that the grape variety impacts wine price (Carbone et al., Reference Carbone, Quici and Cacchiarelli2023; Núñez et al., Reference Núñez, Martín‐Barroso and Velázquez2024; Outreville and Le Fur, Reference Outreville and Le Fur2020; Schamel, Reference Schamel2018). To account for the heterogeneity of the wine market, the hedonic model will be estimated using quantile regression. Numerous studies have demonstrated that this approach is well-suited for estimating HPMs for wine (Amédée-Manesme et al., Reference Amédée-Manesme, Faye and Le Fur2020; Caracciolo et al., Reference Caracciolo, D'Amico, Bianco and Cembalo2016; Carbone et al., Reference Carbone, Quici and Cacchiarelli2023; Castriota et al., Reference Castriota, Corsi, Frumento and Ruggeri2022; Costanigro et al., Reference Costanigro, McCluskey and Goemans2010). However, to the best of the authors’ knowledge, no study to date has specifically applied a HPM to FRGVs, leaving this area unexplored in the existing literature.
The remainder of this paper is organized as follows: The second section reviews the current state of the hedonic price modeling approach with a focus on wine. The third section details the methodology, and the fourth section presents the dataset. The fifth section reports the results, followed by a discussion in the sixth section. Finally, the paper concludes.
II. Theoretical framework and previous literature
The methodology of HPMs is based on the assumption that products are a bundle of features that provide value to the consumer (Lancaster, Reference Lancaster1966). Therefore, the implicit prices of the individual product characteristics make up the price of the good (Rosen, Reference Rosen1974). Wine, as a highly heterogeneous product, possesses numerous characteristics that influence consumer preferences and purchasing decisions. In addition, wine is an experience good, meaning that consumers can assess its quality only after consumption. As a result, they rely on their prior experience with specific extrinsic (e.g., grape variety) or intrinsic (e.g., organoleptic characteristics) product attributes to inform their purchasing decisions (Dubois, Reference Dubois2021; Outreville and Le Fur, Reference Outreville and Le Fur2020). Since intrinsic quality attributes, in particular, are difficult to evaluate before consumption, consumers often turn to indirect measures, such as awards or expert ratings published in wine guides (Dubois, Reference Dubois2021; Outreville and Le Fur, Reference Outreville and Le Fur2020). The relationship between quality (assessments) and wine price has been extensively documented in the relevant literature (Núñez et al., Reference Núñez, Martín‐Barroso and Velázquez2024; Oczkowski and Doucouliagos, Reference Oczkowski and Doucouliagos2015; Orrego et al., Reference Orrego, Defrancesco and Gennari2012; Outreville and Le Fur, Reference Outreville and Le Fur2020). Guide ratings also influence sales. Friberg and Grönqvist (Reference Friberg and Grönqvist2012) showed that sales volumes increase for several weeks following a rating, with the magnitude of the effect depending on whether the rating is positive. However, even a neutral rating affects sales.
Reputation also plays a significant role in influencing consumers’ purchasing decisions and willingness to pay (Núñez et al., Reference Núñez, Martín‐Barroso and Velázquez2024). It reflects perceived quality over time, and a distinction can be drawn between individual and collective reputation (Caracciolo et al., Reference Caracciolo, D'Amico, Bianco and Cembalo2016). The influence of both reputation dimensions on price differs as price increases (Caracciolo et al., Reference Caracciolo, D'Amico, Bianco and Cembalo2016; Costanigro et al., Reference Costanigro, McCluskey and Goemans2010).
Many studies use wine guides as data sources for deriving HPMs (Oczkowski and Doucouliagos, Reference Oczkowski and Doucouliagos2015). These guides offer the advantage of providing not only objective data on individual wines but also information about the winery and its associated quality assessment. This assessment is typically based on scales, with the widely used 100-point scale providing the highest explanatory power (Oczkowski and Doucouliagos, Reference Oczkowski and Doucouliagos2015). The numerical score reflects the wine critic’s sensory evaluation and weighting of various quality factors. Additionally, a winery’s reputation is often rated on a rating scale, though typically with a lower maximum score (e.g., three or five points).
Wine guides usually list the price of the wine, which corresponds to the recommended retail price (RRP)—a subject widely discussed in the literature. The theoretical foundation of hedonic models assumes an equilibrium price, which in the case of RRPs may be distorted by producers’ pricing strategies. However, Oczkowski (Reference Oczkowski2016) has demonstrated that, although the recommended price may differ from actual market prices, hedonic estimates derived from it remain reliable.
III. Methods
As proposed by Rosen (Reference Rosen1974), implicit prices in hedonic models are estimated using regression analysis. In light of our research interest in the disparities between FRGVs and non-FRGVs, we propose a three-stage methodology. First, we estimate a joint OLS model, followed by separate OLS models for each category. The breakdown allows a comparison of the implicit prices of the HPM between non-FRGVs and FRGVs. The widely utilized OLS regression method is predicated on the assumption that the coefficients it estimates are related to the mean value of the dependent variable. For a product as heterogeneous as wine, this average approach is potentially disadvantageous. Consequently, we will calculate a quantile regression in addition to the OLS models. However, this calculation cannot be performed solely for FRGV wines due to the relatively small number of observations. Nevertheless, quantile regression provides relevant insights into the development of implicit prices as a function of the price category.
Our model follows a log-linear formFootnote 5, which is the most common form used in HPMs in the context of wine (Oczkowski and Doucouliagos, Reference Oczkowski and Doucouliagos2015; Orrego et al., Reference Orrego, Defrancesco and Gennari2012). The general form of the OLS regression equation is as follows:
 \begin{equation*}\ln \left( {{P_i}} \right) = {\text{ }}{\beta _0}\mathop \sum \limits_{j = 1}^J {\beta _j}{X_{ij}} + {\varepsilon _i}\end{equation*}
where Pi: the price recommended by the producer for wine i; βj: the estimated coefficient for characteristic j; Xij: vector of wine characteristics; εi: error term.
The quantile regression (Koenker and Bassett, Reference Koenker and Bassett1978) allows for coefficient variation across different quantiles of the dependent variable’s distribution, providing a more nuanced analysis. The following equation is employed to express the quantile regression:
 \begin{equation*}{Q_\tau }\left( {{\text{ln}}({P_i}){\text{|}}{X_i}} \right) = {\beta _0}\left( \tau \right) + \mathop \sum \limits_{j = 1}^J {\beta _j}\left( \tau \right){X_{ij}} + {\varepsilon _i}\end{equation*}
 where:  ${Q_\tau }\left( {{P_i}{\text{|}}{X_i}} \right)$ = conditional τ-quantile of the price distribution, given the explanatory variables; Pi = producer-recommended price for wine i; Xi= vector of wine characteristics for wine i; β j(τ) = quantile-specific coefficient for characteristic j; β 0(τ) = quantile-specific intercept; εi = error term.
This model was calculated in R using the quantreg package (Koenker, Reference Koenker2024). The Frisch-Newton interior point method was employed in order to estimate the model. This iterative algorithm for solving quantile regression problems is particularly well-suited for large datasets (Portnoy and Koenker, Reference Portnoy and Koenker1997).
The explanatory wine characteristics included in the models are:
• Grape variety: A set of dummy variables representing grape varieties.
• Points: The rating assigned to the wine by the wine guide, with scores in the dataset ranging from 74 to 97Footnote 6 (theoretical range: 0–100).
• Producer reputation: A rating assigned to wineries in the wine guide, ranging from 1 to 5.
• Barrique aging: A dummy variable indicating whether the wine has aged in barrique barrels.
• Wine age: The age of the wine at the time the wine guide was published.
• Organic certification: A dummy variable indicating whether the wine is from an organically certified winery.
• Region: The wine-growing region of origin. The dataset includes all 13 German protected designations of origin for wine.
• Vintage: The production year of the wine. The dataset covers the years 2001 to 2022.
As can be seen from the list, the model contains several dummy variables. Typically, reference coding is used for dummy variables in regression analyses; however, this method is not ideal in the current context. The absence of a natural reference category for regions or grape varieties, for instance, results in the arbitrary selection of a reference category. An alternative approach for coding the dummy variables is effect coding. This approach enables the interpretation of the regression coefficients not as a difference from a reference category, but rather as the difference from the grand mean of all categories of the variable (for further details, see Cohen et al., Reference Cohen, Cohen, West and Aiken2015, p.320 et seq.).
To account for potential heteroskedasticity in the data, heteroskedasticity-consistent standard errors were applied in the linear regressions using the vcovHC method. For the quantile regressions, standard errors were adjusted using the “nid” method to ensure robustness against heteroskedasticity as well. The adjusted generalized standard error inflation factor (GVIF(1/(2*Df))) of all considered models was under 1.6Footnote 7 indicating that multicollinearity is not a concern.
The presented study focuses on the differences between FRGVs and non-FRGVs. Therefore, discrepancies in the estimated coefficients were analyzed. For the practical interpretation of dummy variables (as changes in price), particularly when expressing semielasticities, the Halvorsen-Palmquist adjustment has to be applied to correct for the bias inherent in log-linear models (Halvorsen and Palmquist, Reference Halvorsen and Palmquist1980).
IV. Data
Data from the German wine guide “Der Eichelmann” were used to answer the research questions outlined in Section I. A dataset was compiled from the editions spanning 2016 to 2024, covering between 861 and 972 wineries and 8,508 to 10,570 individual wines per year. In total, the dataset included approximately 88,000 wines. These represent, on average 95% of the wines in the respective edition of the wine guide. Losses were due to technical influences that occurred during the process of digitization and data evaluation.
Sparkling wines and wines of Auslese quality level or higher were excluded from the analysis, as they represent a distinct product category and could distort the results. Additionally, wines in special bottle sizes (e.g., 0.375 L or 1.5 L), blended wines, and those priced above €150 were removed. It should be noted that, due to their obscurity, many FRGVs are marketed as blended wines (Richter and Hanf, Reference Richter and Hanf2022). Therefore, it cannot be ruled out that the exclusion of blended wines also excludes some FRGVs. However, there are no precise statistics available, making it difficult to quantify this. Although the quantile regression allows a stronger focus on such extreme values, the number of wines over €150 is so small that a stable regression was no longer possible. Further observations were excluded due to missing values or data errors. After these adjustments, the final dataset comprised approximately 73,800 wines. For descriptive statistics, see Table 1.
Table 1. Descriptive comparison of non-FRGVs and FRGVs in the dataset

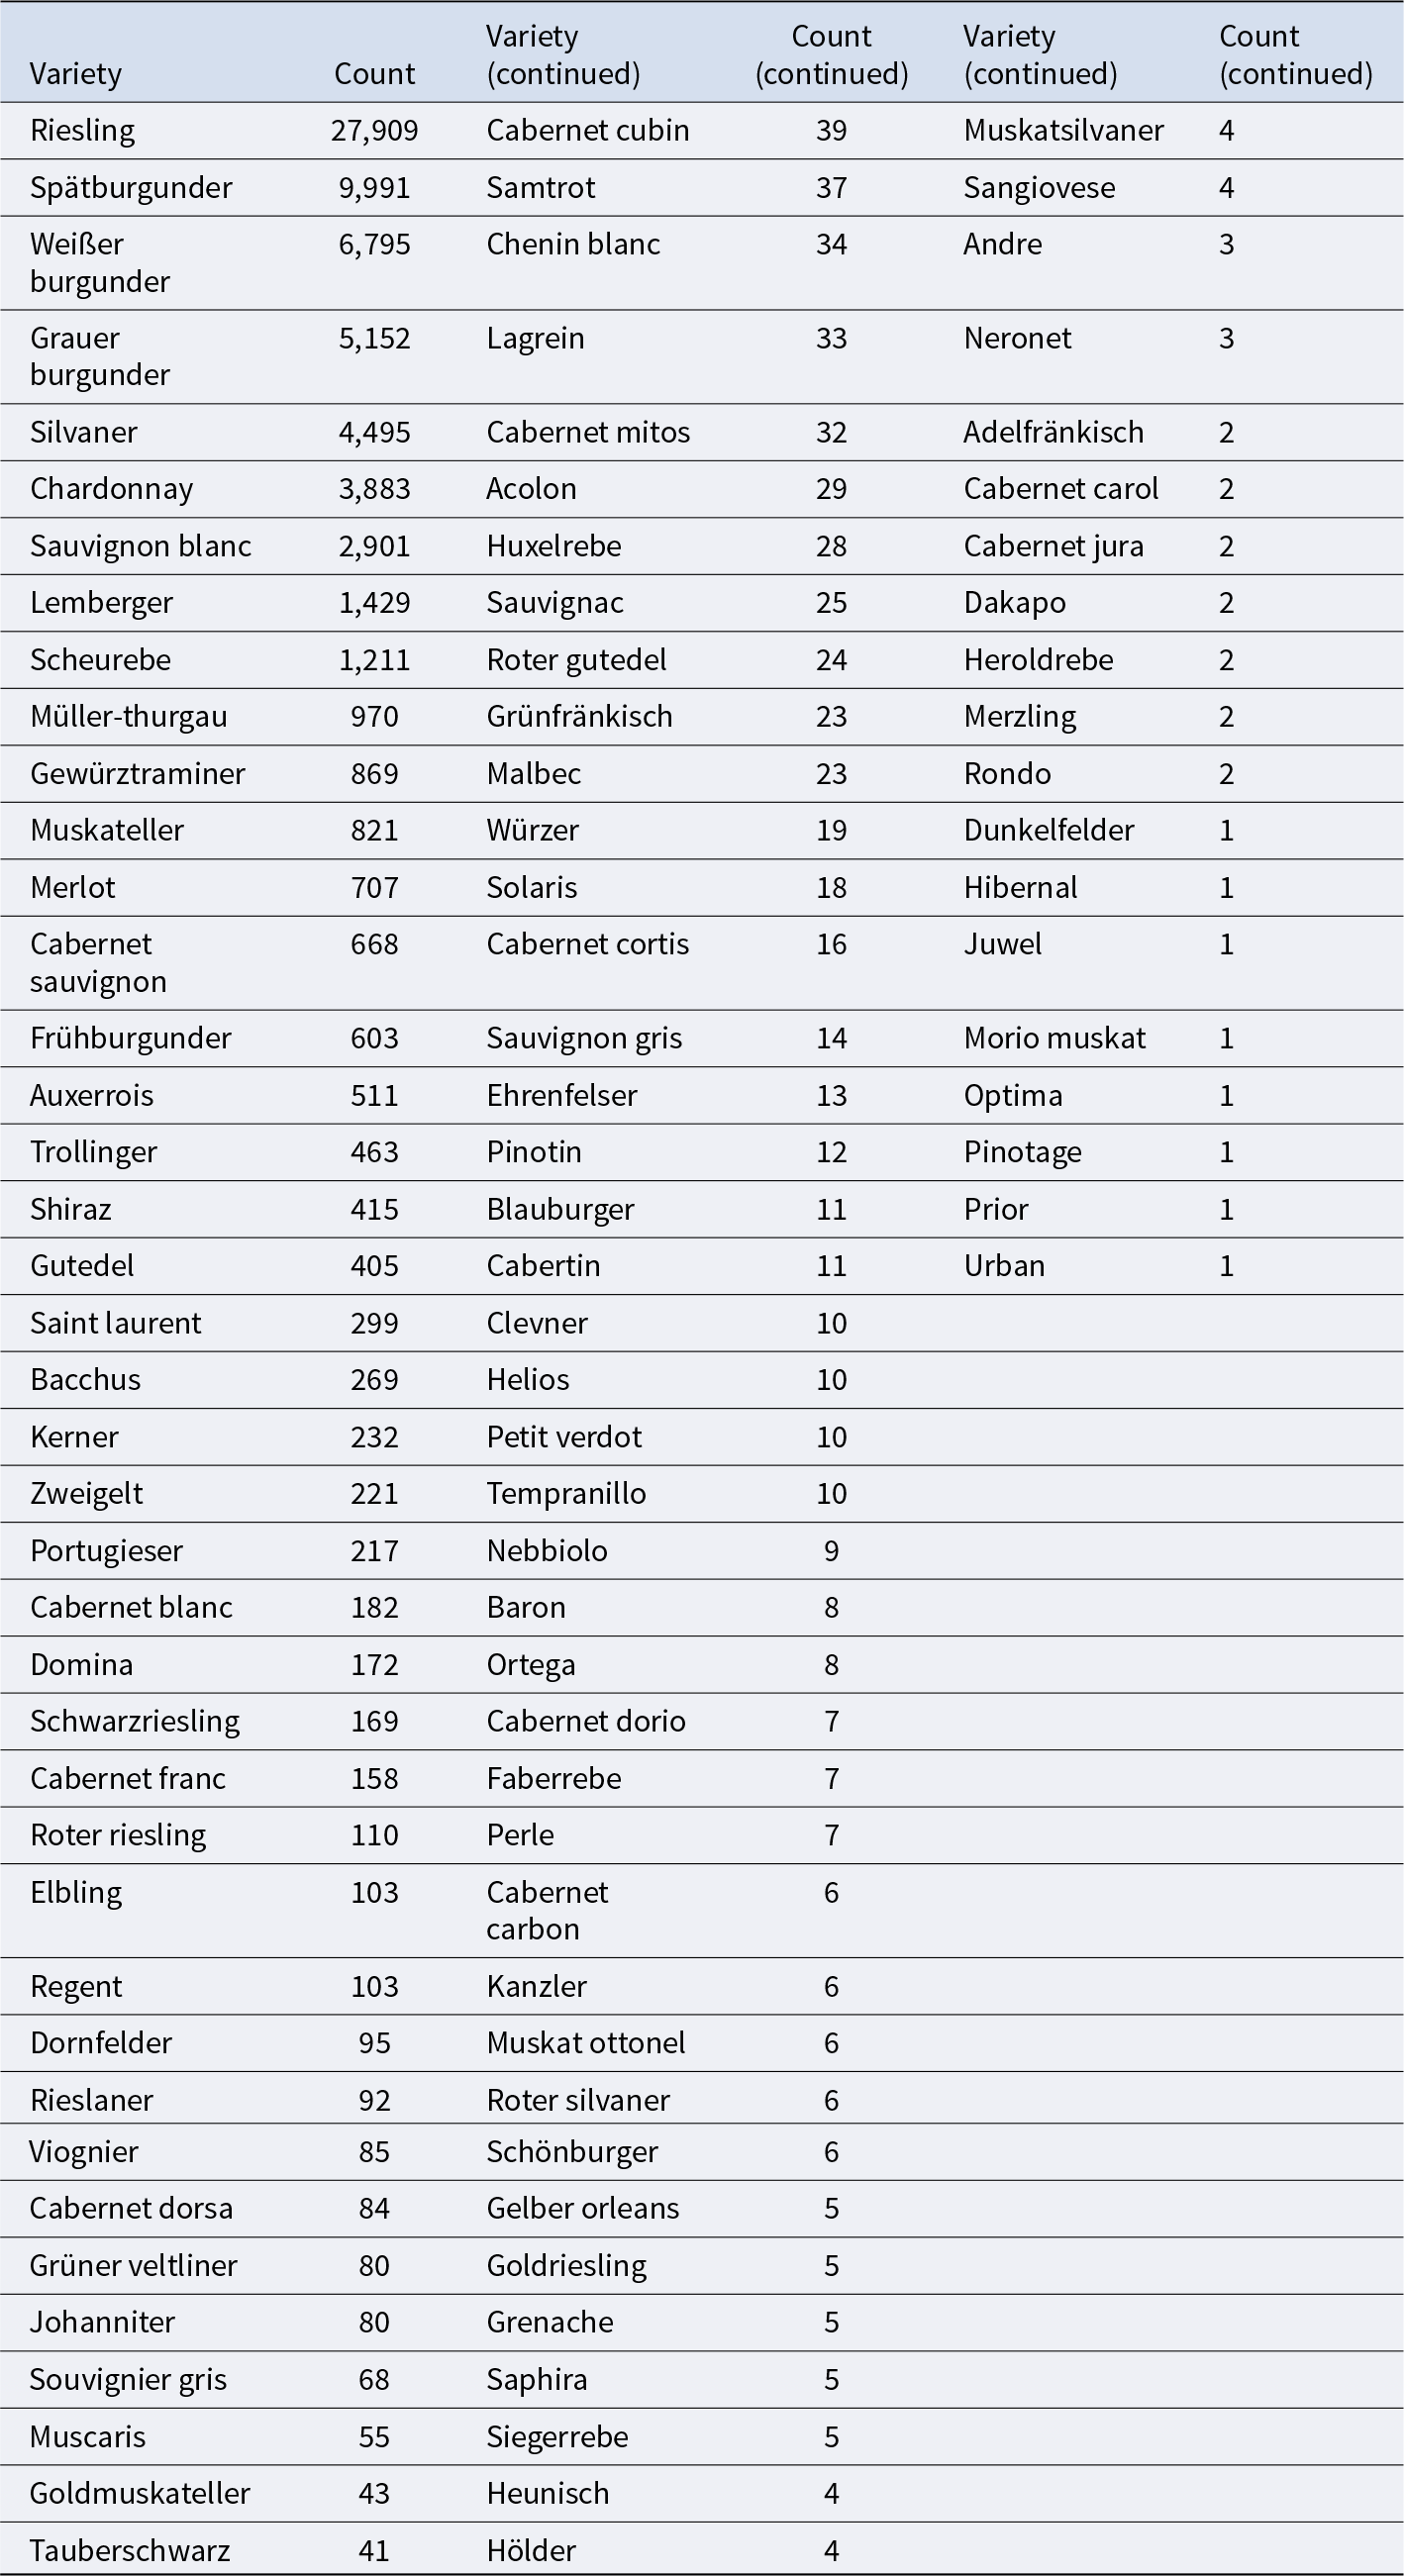
The dataset contained 102 different grape varieties, 20 of which were FRGVs. Some varieties were relatively rare in the dataset. Since small categories can be particularly problematic for quantile regression, varieties that appeared fewer than 30 times were grouped under the category “Other.” A distinction was made between FRGVs and non-FRGVs. After this adjustment, the dataset contained 46 different varieties, including 5 FRGVs and 1 “Other” category for each group. The five FRG varietiesFootnote 8 included in the dataset are the most significant in terms of vineyard area, accounting for 63% of German FRGV cultivation.
V. Results
The descriptive results (Table 1) demonstrate significant disparities between FRGVs and conventional wines. On average, FRGVs have a lower price, are rated lower, and the wineries that produce them have a lower reputation. It is noteworthy that FRGVs are more frequently produced organically. As shown in the right column of Table 1, these differences are mostly statistically significant.
The cultivation of FRGVs in Germany has grown rapidly, doubling the acreage since 2020, reaching approximately 4.3% of the total vineyard area in 2025 (Destatis 2025, own calculations). However, this development is not fully reflected in the dataset: while in 2016 only 0.54% of the wines in the dataset were FRGVs, the share increased to 1.01% in the 2024 wine guide edition, with the highest proportion observed in 2023 at 1.42%.
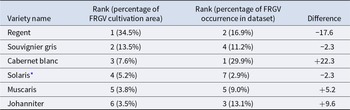
Not only does the overall presence of FRGVs deviate from expectations based on their share of the total vineyard area, but the shares of individual FRGVs also show discrepancies from their share of the total FRGV acreage. In particular, Regent—the most widely cultivated FRGV by a large margin—appears infrequently in the dataset (see Table 2). In contrast, Cabernet blanc is disproportionately overrepresented. Such shifts also occur for conventional varieties, but to a much lesser extent. Here, it is mainly varieties grown for the lower-quality segment (e.g., Müller-Thurgau or Dornfelder) that are underrepresented in the guide. Of the 36 FRGVs approved for planting in Germany (Bundessortenamt (BSA), 2024), 20 are observed in the wine guide, but only 5 are meaningful in terms of quantity on the (premium) wine market.
Table 2. Comparison between the cultivation of FRGVs and their occurrence in the dataset

* Later, these varieties were subsumed under “Other FRGV” due to their rare occurrence.
a. OLS regression results
In the following section, the results of the three OLS regressions are presented, with particular emphasis on the differences between the FRGV model and that of conventional varieties. Table 3 presents a selected overview of the regression coefficients, while Table A in the Appendix provides the full set of model coefficients.
Table 3. Main results of the OLS regressions

*** Note: Significance levels: p < 0.001 = ***; p < 0.01 = **; p < 0.05 = *; p < 0.1 = .; p > 0.1 = n.s.
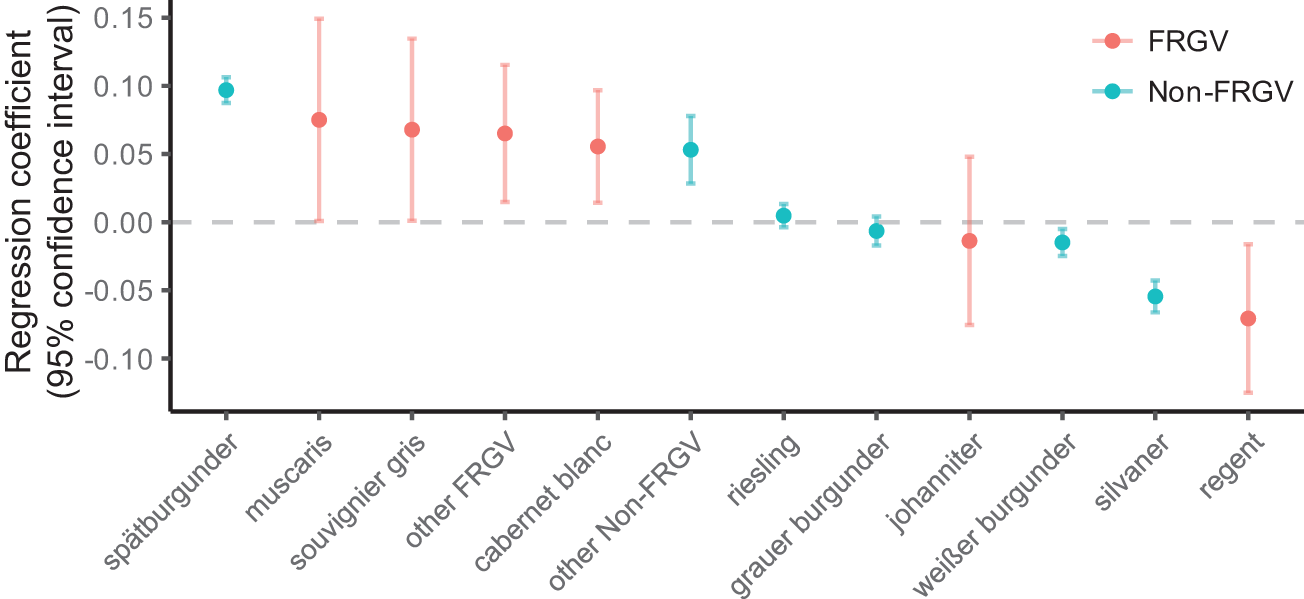
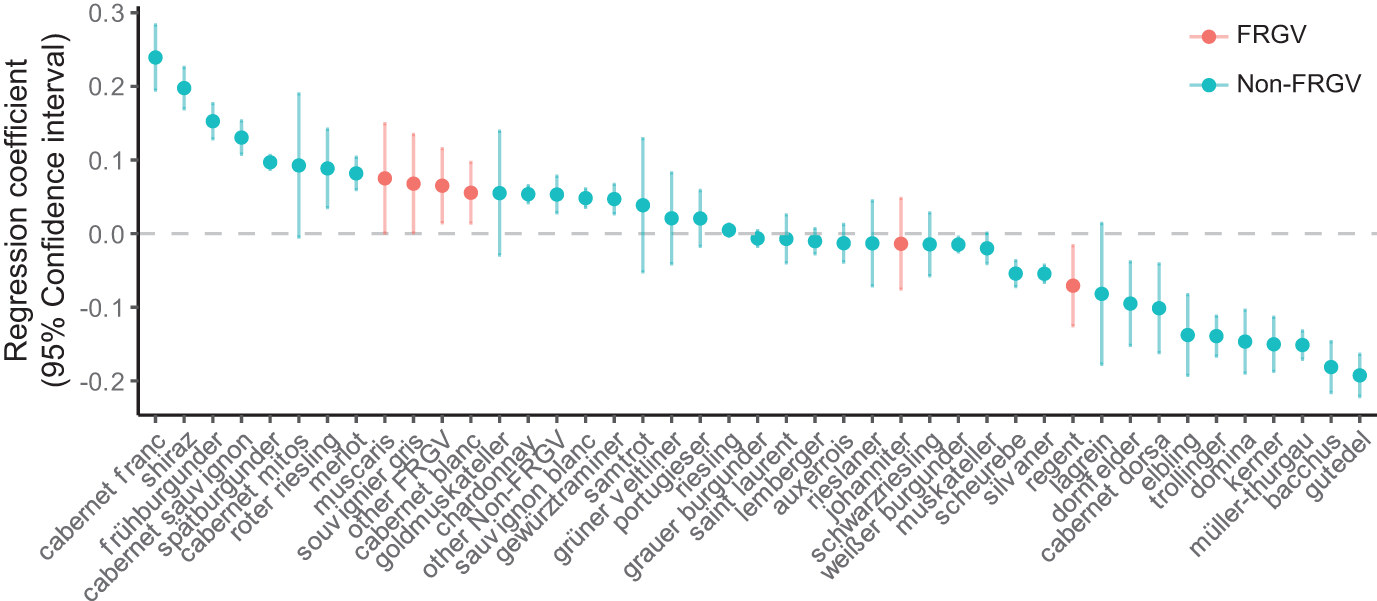
Variety-specific differences are of particular interest. Figure 1 illustrates the coefficients for the five most common FRGVs and non-FRGVs, while a complete visualization of all grape varieties is provided in the Appendix. Notably, FRGVs are prominently positioned at the top of the chart. In contrast, Regent—the most widely cultivated FRGV—appears at the lower end of the ranking across all analyzed grape varieties, including both FRGVs and conventional types. Nevertheless, ceteris paribus, most FRGVs exhibit above-average PPs compared to conventional varieties. Moreover, FRGVs appear to form a relatively homogeneous group in terms of their price effects. With the exception of Johanniter, the FRGVs show statistically significant PPs against the global average. However, it should be noted that the confidence intervals—driven by the smaller number of FRGVs—are larger than for the conventional varieties. Due to the number of 46 different varieties, we chose not to perform pairwise statistical tests. In quantitative terms, the variety-specific PPs compared to the global average are presented in Table 4.

Figure 1. OLS regression coefficients for the five most frequent FRGVs and non-FRGVs.
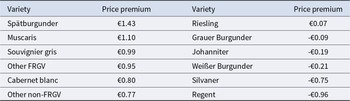
Table 4. Variety-specific price premiums based on OLS regression

The differences between FRGVs and non-FRGVs are evident not only in the PPs associated with grape variety but also in other price-determining factors. Compared to conventional wines, FRGV wines receive significantly lower expert ratings (Wilcoxon test: p < 0.001). The regression results show that wine ratings exert a strong influence on prices for both FRGV and conventional wines; however, this effect is significantly weaker in the case of FRGVs (Z-value = −8.226; p-value < 0.001).
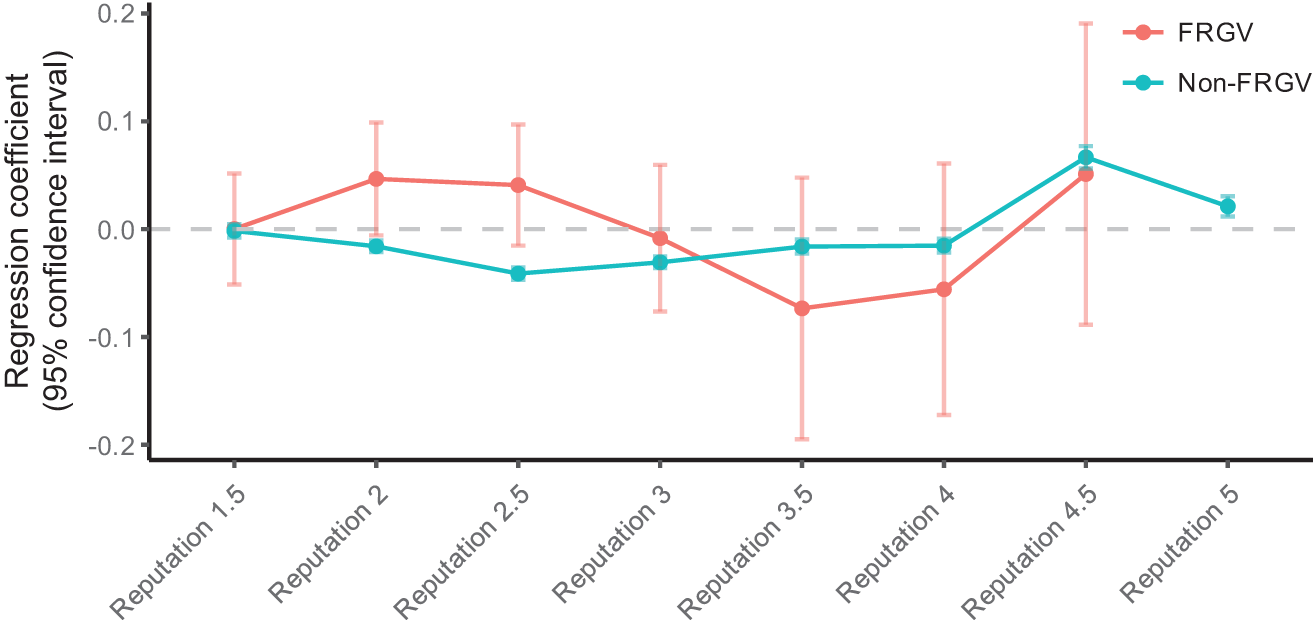
In addition, the influence of winery reputation on wine pricing differs between the two groups. For wineries with lower reputation scores, the estimated coefficients show divergent patterns (see Figure 2). In this context, FRGV wines achieve above-average PPs. Conventional varieties only surpass FRGV wines once the reputation score reaches 3.5 or higher.

Figure 2. Regression coefficients of FRGV and non-FRGV wines across different winery reputation levels.
As shown in Table 1, the proportion of organic wines is significantly higher among FRGVs. The regression results further indicate that the implicit prices associated with organic certification are substantially higher for FRGV wines (€0.87) compared to those from conventional grape varieties (€0.39; Z-value = 2.093; p-value = 0.036). In addition, both barrique aging (€3.27 for FRGV vs. €0.53 for conventional; Z-value = −3.429; p-value < 0.001) and wine aging (€1.52 vs. €1.42; Z-value = −2.093; p-value = 0.036) are associated with significantly higher market prices for FRGV wines compared to conventional varieties.
The region of origin also exerts a significant influence on wine pricing. While the differences in regional price effects between FRGVs and non-FRGVs are not statistically significant overall, the estimated coefficients tend to be lower for FRGVs. However, exceptions exist: FRGV wines from Saale-Unstrut, Nahe, and Württemberg exhibit relatively high regional PPs.
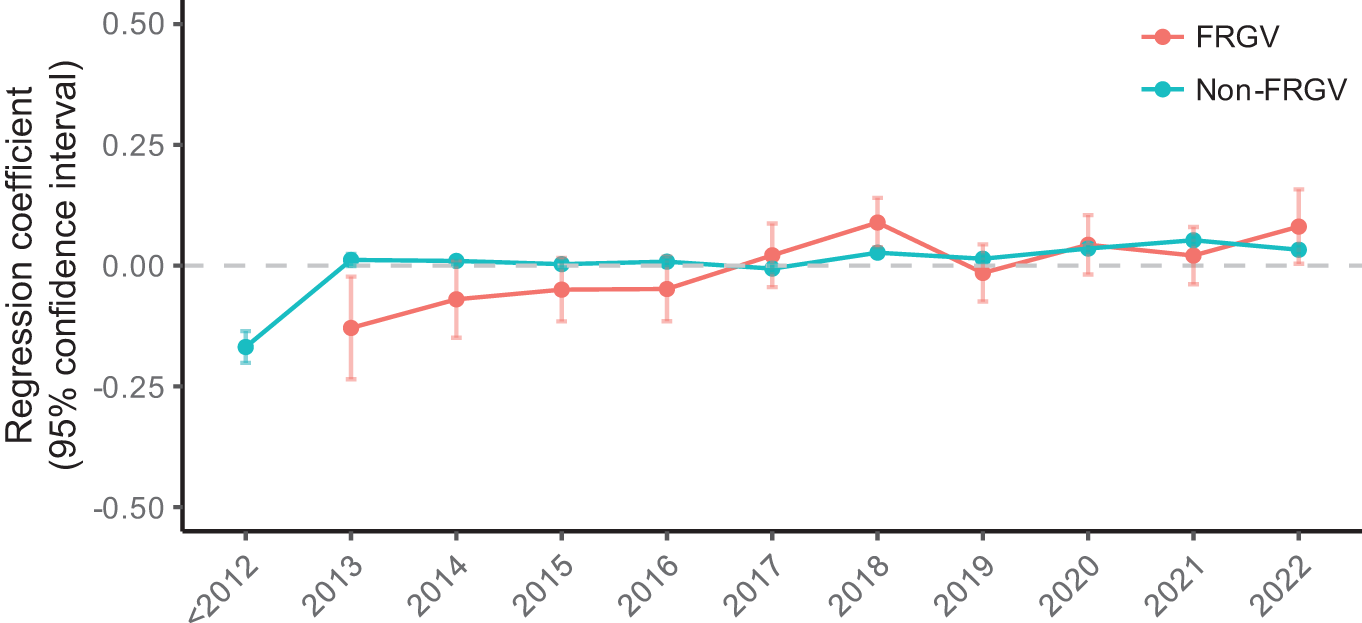
The influence of vintage varies across the observed years (see Figure 3). While PPs for conventional wines remain relatively stable over time, a distinct trend emerges for FRGVs: vintages up to and including 2016 are associated with lower coefficients, whereas from 2017 onward FRGV wines tend to exhibit higher or comparable PPs. However, this trend is not significant and could also be caused by inflation.

Figure 3. Regression coefficients of the vintage variable in FRGV and non-FRGV wines.
b. Quantile regression results
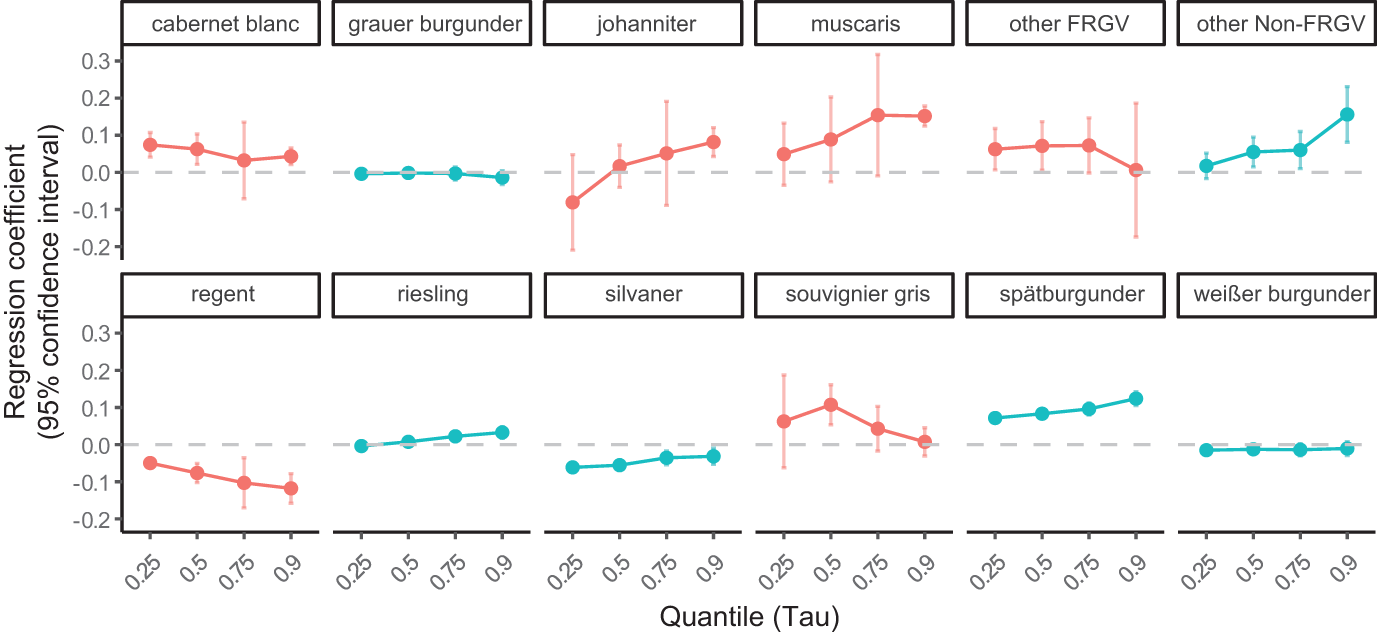
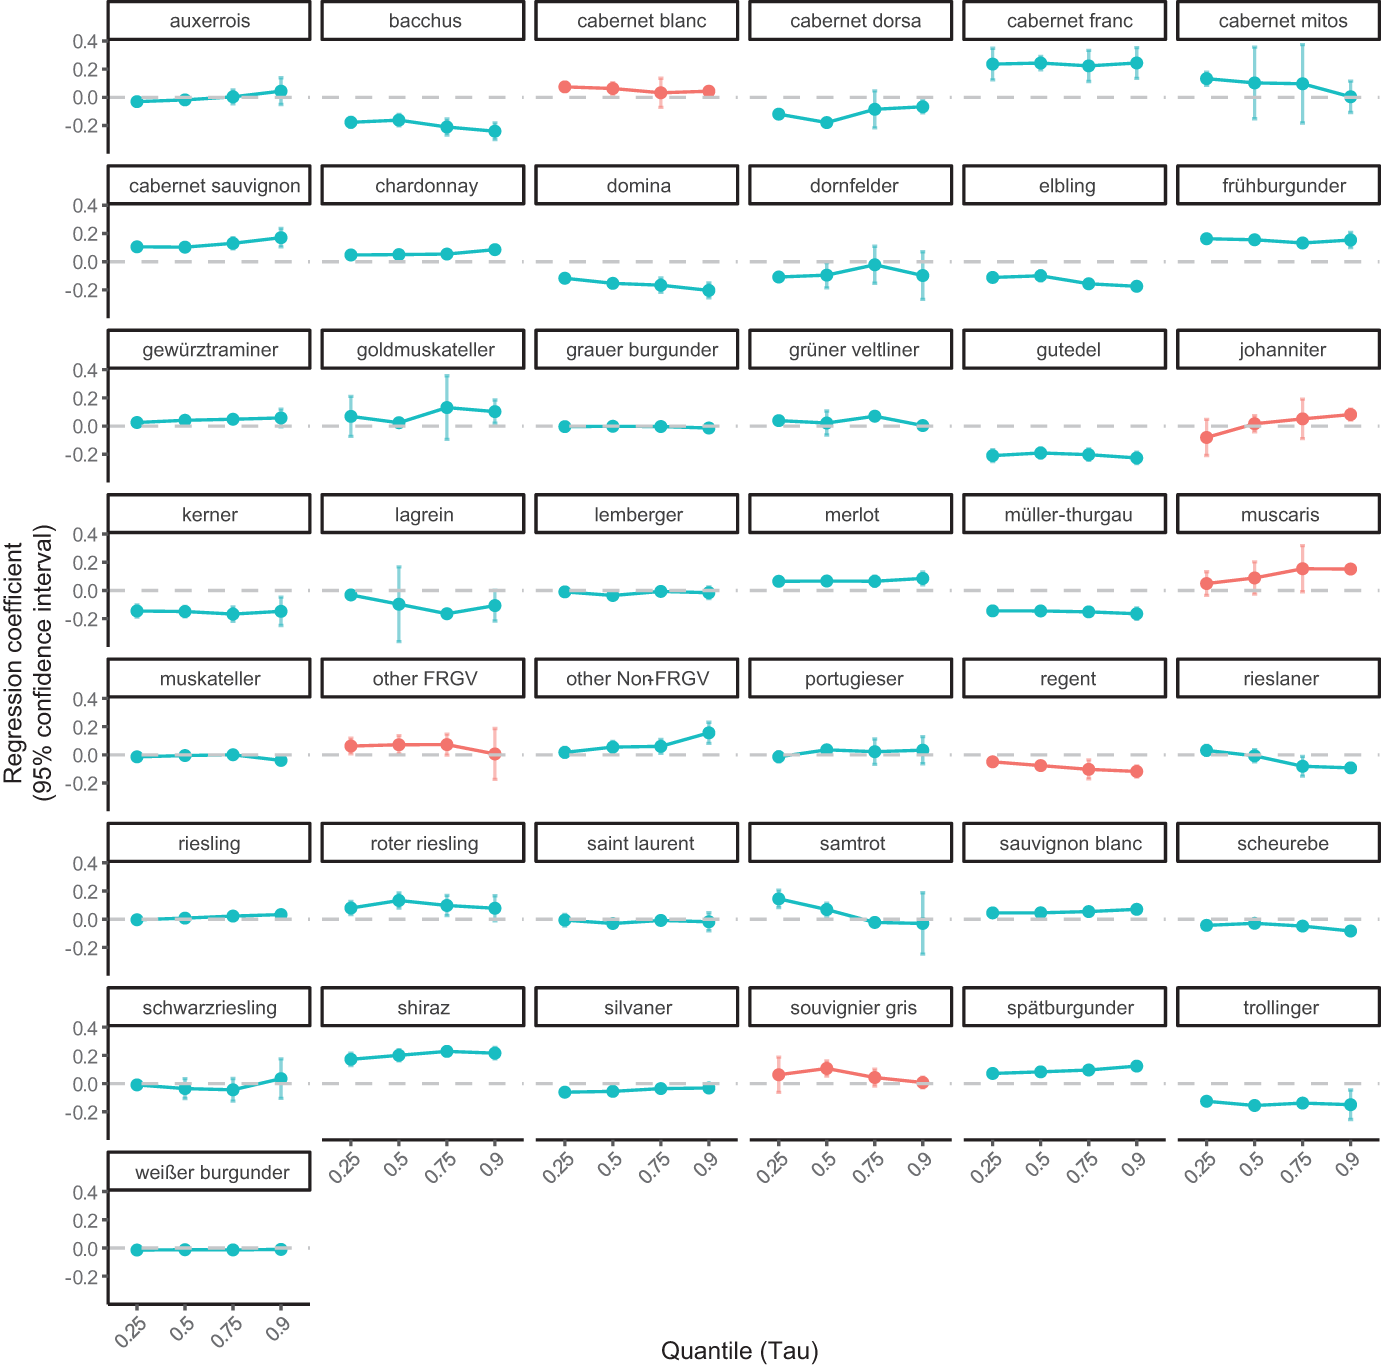
The following section examines the development of selected variables across price quantiles: 0.25 (€8.0), 0.5 (€10.8), 0.75 (€16.6), and 0.9 (€25.0). The regression results are reported in the Appendix (Table B). It is important to note that differences between FRGVs and non-FRGVs can only be assessed with respect to grape variety effects. Figure 4 illustrates the quantile regression coefficients for the five most prevalent FRGVs and non-FRGVsFootnote 9, analogous to those presented in Figure 1. The quantile regressions confirm that FRGVs tend to exhibit higher PPs, particularly in the upper quantiles. Once again, the Regent variety stands out with consistently low coefficients, especially at higher price levels. Overall, the differences between quantiles appear more pronounced for FRGVs; however, the direction of the price-quantile–PP relationship varies across varieties. Carbone et al. (Reference Carbone, Quici and Cacchiarelli2023) in Italy showed that the implicit prices change depending on the grape variety and price quantile.

Figure 4. Quantile regression coefficients for the five most frequent FRGVs and non-FRGVs.
The influence of expert ratings on price remains relatively stable across quantiles, with a slight upward trend. This pattern is consistent with other studies (Amédée-Manesme et al., Reference Amédée-Manesme, Faye and Le Fur2020; Carbone et al., Reference Carbone, Quici and Cacchiarelli2023; Delmond and McCluskey, Reference Delmond and McCluskey2025). Regarding winery reputation, wineries with medium ratings (2.5–3.5) show negative price effects in the upper quantiles. In contrast, highly reputable wineries (ratings of 4.5 and 5) tend to achieve positive PPs at the upper end of the distribution. Wineries with low reputation scores (1.5 and 2) remain close to the average across all quantiles.
The effect of organic certification on wine price remains largely stable across the price distribution, with a notable decrease only in the top quantile. In contrast, the impact of barrique aging and wine age varies considerably: while the effect of wine age increases in higher quantiles, the influence of barrique aging diminishes as price rises.
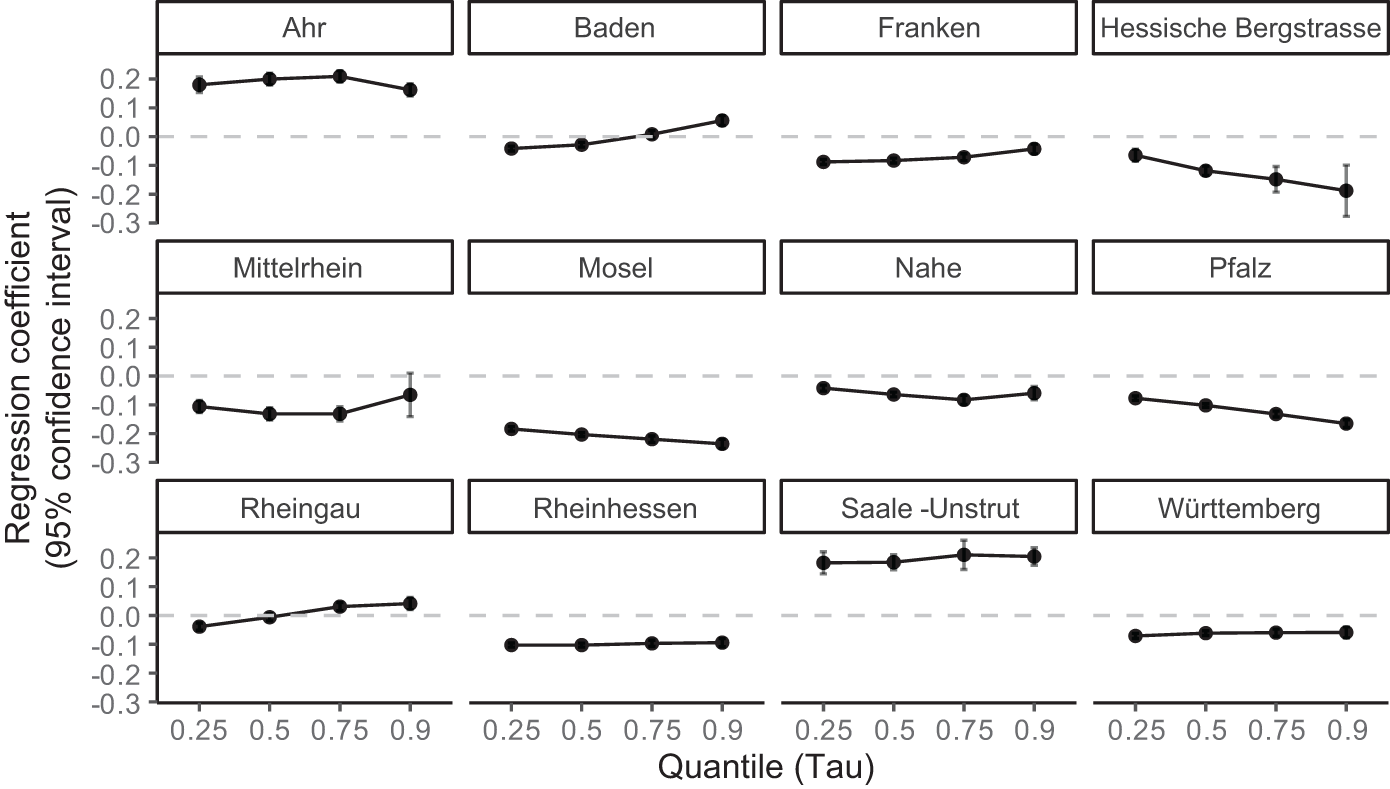
The effects of regional origin on the price also vary considerably (see Figure 5). Up to the 0.75 quantile, most regional coefficients remain constant or show a declining trend. Exceptions include the Rheingau and Baden regions, which demonstrate increasing coefficients. The Mittelrhein and Nahe regions exhibit a U-shaped pattern. In contrast, the vintage coefficients remain largely stable at a low level across all quantiles.

Figure 5. Quantile regression coefficients by region of origin.
VI. Discussion
In summary, our research questions can be answered as follows:
(1) Wines produced from the most FRGVs can achieve PPs compared to conventional varieties. However, this is not the case with the most widely cultivated FRGV, Regent.
(2) The value-giving attributes of FRGVs and non-FRGVs differ significantly. For instance, organic certification has been demonstrated to result in more elevated PPs for FRGVs in comparison to non-FRGVs.
Our results show that FRGV wines remain underrepresented in the wine guide, although their share has generally increased—except in the 2024 wine guide edition. Notably, there is a partial alignment between PPs and representation: varieties that achieve high premiums in the upper price quantiles, such as Johanniter and MuscarisFootnote 10, also appear more frequently in the dataset. Johanniter, for instance, shows strong price effects in the upper quantiles and rises in dataset prominence. Conversely, Regent—despite being the most widely cultivated FRGV—consistently performs poorly across quantiles and is underrepresented relative to its vineyard share.
A general pattern emerges: in the upper quantiles, FRGVs with higher PPs are more frequently included in the wine guide. This suggests that economic success may influence the selection of varieties for submission, reinforcing the visibility of top-performing FRGVs in premium segments.
Nonetheless, it remains evident that FRGVs are only represented to a limited extent in the wine guide, as reflected in the number of wines listed. The question regarding the extent to which FRGVs have already penetrated the premium wine market can therefore be answered as follows: at present, their market penetration remains minimal. Currently, 36 FRGV varieties are authorized for cultivation in Germany (Bundessortenamt (BSA), 2024). However, in the 9 editions of the wine guide, only 5 of these varieties appear more than 30 times. This finding indicates that the observed diversification of FRGVs does not yet align with market realities. In this context, concerns regarding elevated search costs and potential consumer dissatisfaction appear particularly relevant (Böcker and Brodersen, Reference Böcker and Brodersen1997).
However, it can be stated that both in the OLS regression and in the quantile regression, the FRGVs (except for Regent) demonstrate PPs in comparison to non-FRGVs. Consequently, the subsequent inquiry concerning the capacity of producers to demand PPs for FRGVs can be resolved, indicating that while the implicit prices of these varieties are elevated, the actual mean market prices of the wines are not. The reasons for this phenomenon can be attributed to the other, additional value-added characteristics of wines. Of particular relevance is the observation that the practice of offering FRGVs is predominantly exhibited by wineries with a lower reputation. A higher wine rating for FRGVs also results in a lower PP compared to conventional wines. Conversely, organic certification, more mature vintages, and aging in barriques have a stronger positive influence on price. Consequently, the second research question can be answered in the affirmative, indicating that there are significant differences in the value-giving characteristics of FRGVs and non-FRGVs.
Producers with lower reputations can potentially achieve significant PPs for FRGVs compared to conventional varieties (see Figure 2). The cultivation and marketing of FRGVs can provide these wineries the opportunity to differentiate themselves by developing new flavor profiles (Kiefer and Szolnoki, Reference Kiefer and Szolnoki2024a). In contrast to highly reputable wineries, those with lower reputations appear to rely more heavily on the comparative advantages of FRGVs. As a result, they cultivate a broader range of these varieties and can position their wines at higher price points within niche markets. Reputation can be seen as the quality perceived by the consumer over time (Núñez et al., Reference Núñez, Martín‐Barroso and Velázquez2024). This means that reputation needs time to build up. Since FRGVs are still a comparatively new phenomenon, the producers must first establish a reputation for being FRGV specialists.
One of the primary motivations for cultivating and purchasing FRGVs lies in their sustainability potential (Kiefer and Szolnoki, Reference Kiefer and Szolnoki2024a, Reference Kiefer and Szolnoki2024c; Nesselhauf et al., Reference Nesselhauf, Fleuchaus and Theuvsen2019; Zachmann et al., Reference Zachmann, McCallum and Finger2024). However, given the limited consumer awareness of these varieties, effective communication strategies are essential to build credibility and trust (Kiefer and Szolnoki, Reference Kiefer and Szolnoki2024c; Nesselhauf et al., Reference Nesselhauf, Fleuchaus and Theuvsen2019). In this context, organic certification has been shown to generate significantly higher PPs for FRGVs than for conventional grape varieties, underscoring the importance of sustainability-oriented signaling in the marketplace. Organic winegrowers also see the cultivation of FRGVs as a logical next step in their organic way of working (Kiefer and Szolnoki, Reference Kiefer and Szolnoki2024a). This together could lead to FRGVs having greater potential to spread on organic farms in the future.
We evaluated wine ratings as a metric variable. This results in relatively high coefficients (i.e., a PP for an average non-FRGV of €2.09 per rating point). This is due to the very high price influence of high ratings. An evaluation of the rating variable as a dummy, as we did for the winery’s reputation, was not possible for the quantile regression due to the large number of categories. Also, our focus was on differences between FRGVs and non-FRGVs.
The presented study is not without its limitations. The wine guide takes care to represent the whole range of the products from a given winery, but the selection of wines for evaluation by the wine guide is determined by the wineries themselves, resulting in a nonrandom sample and a potential self-selection bias. Due to the unfamiliarity of FRGVs among consumers, wineries may be less inclined to submit FRGVs to the wine guide. Furthermore, the dataset exclusively covers the high-priced segment of the German wine market, which limits the generalizability of the findings to other market segments, such as the mass market or entry-level wines. A key constraint is the significantly smaller sample size of FRGVs compared to conventional varieties. This discrepancy restricts the statistical power of the analysis and, for example, made it impossible to estimate the quantile regression models for FRGVs alone. The small sample size also limits the comparison between varieties. Consequently, it is recommended that the study be repeated when a more extensive dataset for FRGVs is available. This would facilitate a more profound and nuanced analysis through the implementation of quantile regression for FRGVs.
Additionally, the analysis is based solely on offer-side data, that is, listed prices in a wine guide, which may not fully reflect actual sales performance or consumer demand. The theoretical basis of hedonic price models assumes a market equilibrium between supply and demand. This equilibrium may not yet exist, particularly for a new product such as FRGVs. Future research should therefore include real sales data and expand to other distribution channels such as discounters and supermarkets, where different market dynamics and consumer behavior may prevail. Broadening the database in these directions would provide a more comprehensive picture of the market potential and price positioning of FRGVs.
VII. Conclusion
Our research demonstrates that the value-adding characteristics of FRGV wines differ notably from those of wines made from conventional grape varieties. This insight underscores the need for a targeted marketing strategy. In particular, the positive environmental attributes of FRGVs must be clearly communicated to effectively position them in the market. For wineries with lower visibility or reputation, FRGVs offer the opportunity to enter niche markets and realize higher price points. However, to further strengthen the perception of quality in the premium segment, it is crucial that leading, reputable wineries actively promote and market FRGVs. Such strategic engagement can help dissociate FRGVs from their lingering image as lower-quality wines.
FRGVs could present a valuable opportunity for lesser-known producers to differentiate themselves and appeal to consumer segments willing to pay a premium for organic and sustainable products. However, due to the relative unfamiliarity of these varieties, greater marketing efforts are required—efforts that often involve increased costs. This challenge is compounded by the sheer number of different FRGVs, which may overwhelm consumers and hinder recognition. To address this, it is recommended that the industry concentrate on a limited set of well-promoted “flagship varieties” to build familiarity, streamline communication, and enhance market penetration.
FRGVs offer companies in the wine industry the opportunity to generate both economic and ecological benefits. The results obtained demonstrate a gradual rise in the presence of these varieties within the premium wine segment. The findings of this study demonstrate that the potential of these varieties has yet to be fully realized. It is therefore recommended that the industry consider implementing targeted marketing measures to further explore and exploit this potential. Furthermore, future research should investigate how targeted subsidies can further support the spread of FRGVs. These could be applied in the area of cultivation but also in marketing.
Acknowledgements
We would like to thank the two anonymous reviewers, the journal’s coeditor Bradley Rickard, together with Karl Storchmann for their helpful and thoughtful comments. AI was used to generate code in R and for spell checking.
Competing interests
The author(s) declare none.
Appendix
Table A. Results of the OLS regressions

*** Note: Significance levels: p < 0.001 = ***; p < 0.01 = **; p < 0.05 = *; p < 0.1 = .; p > 0.1 = n.s.
Table B. Results of the quantile regression

*** Note: Significance levels: p < 0.001 = ***; p < 0.01 = **; p < 0.05 = *; p < 0.1 = .; p > 0.1 = n.s.

Figure A. OLS regression coefficients for all varieties.

Figure B. Quantile regression coefficients for all varieties.
Table C. Number of wines per variety before aggregation


 Open access