


Introduction
Dementia is a collective term for various diseases that impair cognitive function and the ability to perform daily activities, and has profound physical, psychological, social and economic impacts on patients, their families and society on multiple levels(1). Ageing is a major risk factor for dementia. As of 2024, the global population aged 65 years and over is estimated to exceed 760 million, with projections suggesting it could reach 2·2 billion by 2080(2). Currently, more than 55 million people worldwide are living with dementia, and nearly 10 million new cases are diagnosed annually(1). By 2050, the number of people with dementia among those aged 60 years or older is projected to increase to 130 million(Reference Prince, Wimon, Guerchet, Ali, Wu and Rina3). Current treatments can temporarily alleviate symptoms or slow the progression of dementia but cannot reverse existing brain damage(Reference Huang, Chao and Hu4). Furthermore, given that the trajectory of dementia progression exhibits substantial variation among individuals(Reference Kelaiditi, Cesari, Canevelli, van Kan, Ousset and Gillette-Guyonnet5), identifying effective preventive factors to mitigate the risk of dementia can be a successful strategy to promote healthy brain ageing(Reference Reuben, Kremen and Maust6,Reference Long, Benoist and Weidner7) .
The World Health Organization (WHO) guidelines (2019)(Reference Reuben, Kremen and Maust6,8) and the Lancet Commission (2020) have emphasised several modifiable risk factors such as smoking, drinking, physical inactivity, obesity, hypertension and diabetes, which collectively account for approximately 40% of dementia risk globally(Reference Reuben, Kremen and Maust6,Reference Livingston, Huntley, Sommerlad, Ames, Ballard and Banerjee9) . Among these, dietary factors can be broadly categorised as (1) nutrients and other bioactive food components, (2) specific foods or food groups, (3) dietary patterns reflecting habitual dietary quality – collectively considered as dietary intake factors – and (4) objective biomarkers that reflect dietary exposure. These dietary factors – including specific nutrients (e.g. vitamin E, flavonols, B-vitamins and n-3 fatty acids) and nutrient-rich foods such as vegetables, berries and seafood(Reference Morris10–Reference Huang, Tao, Chen, Chen, Shen and Zhao13); dietary patterns such as Mediterranean-DASH Intervention for Neurodegenerative Delay (MIND) diets(Reference Chen, Dhana, Huang, Huang, Tao and Liu12,Reference Huang, Tao, Chen, Chen, Shen and Zhao13) ; and dietary biomarkers (e.g. plasma fatty acids, carotenoids, vitamin E and choline)(Reference Zwilling, Wu and Barbey14) – have been recognised for their potential cognitive benefits. However, findings have not been entirely consistent. While observational studies, including those on the MIND diet, have suggested protective associations with cognitive decline and dementia(Reference Chen, Dhana, Huang, Huang, Tao and Liu12,Reference Huang, Tao, Chen, Chen, Shen and Zhao13) , randomised controlled trials (RCTs) targeting older adults, including interventions focusing on the Mediterranean diet(Reference Valls-Pedret, Sala-Vila, Serra-Mir, Corella, de la Torre and Martinez-Gonzalez15), exercise(Reference Sink, Espeland, Castro, Church, Cohen and Dodson16) and hypertension reduction(Reference Williamson, Launer, Bryan, Coker, Lazar and Gerstein17), have shown limited efficacy in mitigating cognitive decline. This may be because of the irreversible nature of sub-clinical organ damage accumulated over the lifespan(Reference Finch and Crimmins18,Reference Gillman19) . Therefore, it is increasingly important to identify markers that can capture early-stage brain alterations before the onset of overt cognitive symptoms when preventive interventions are likely to be more effective.
Cognitive impairment is commonly assessed using short neuropsychological tools, such as the Mini-Mental State Examination (MMSE), which classify individuals by applying a numerical threshold for dementia diagnosis(Reference Tucker-Drob, Brandmaier and Lindenberger20). However, these conventional assessments tend to cognitive decline only after functional deficits have emerged, making them insufficient for capturing early, pre-clinical brain changes(Reference Elliott21). Consequently, novel biomarkers that capture sub-clinical changes in biology and cognition have been explored(Reference Niedernhofer, Kirkland and Ladiges22). Magnetic resonance imaging (MRI)-based biomarkers, which directly measure degradation of the brain, the only organ responsible for cognition, memory and intellectual function, are proposed as sensitive indicators of accelerated brain aging during midlife (defined as 40–64 years) and subtle changes that may not be detectable through cognitive tests alone(Reference Elliott21,Reference Drouka, Mamalaki, Karavasilis, Scarmeas and Yannakoulia23) . However, previous systematic reviews investigating the associations between dietary factors and MRI biomarkers have been limited(Reference Drouka, Mamalaki, Karavasilis, Scarmeas and Yannakoulia23–Reference Jensen, Leoni, Klein-Flugge, Ebmeier and Suri25). Two focused exclusively on dietary and nutrient patterns(Reference Drouka, Mamalaki, Karavasilis, Scarmeas and Yannakoulia23,Reference Arnoldy, Gauci, Young, Marx, Macpherson and Pipingas24) . The other review summarised evidence on the associations between comprehensive dietary factors and MRI-based brain outcomes(Reference Jensen, Leoni, Klein-Flugge, Ebmeier and Suri25). However, it categorised some cross-sectional analyses, where MRI biomarkers were measured only once at the follow-up visit after dietary assessments, as longitudinal studies. In addition, it used blood lipid profiles (e.g. HDL cholesterol and triacylglycerols), rather than nutrient biomarkers (e.g. folate and carotenoids), as dietary biomarkers(Reference Jensen, Leoni, Klein-Flugge, Ebmeier and Suri25).
This systematic review aims to comprehensively summarise the relationships between dietary factors – including nutrients and other bioactive food components, foods, dietary patterns and nutrient biomarkers – and MRI-based structural and non-structural biomarkers in general populations. The review included findings from intervention studies and prospective cohort studies, including both longitudinal analyses and cross-sectional analyses derived from cohorts in which dietary assessments were conducted prior to MRI measurements. To reduce the risk of reverse causation, cross-sectional studies that collected dietary and MRI data at the same visit were excluded.
Methods
This systematic review adhered to international guidelines, specifically the Preferred Reporting Items for Systematic Review and Meta-Analysis (PRISMA) 2020 statement(Reference Page, McKenzie, Bossuyt, Boutron, Hoffmann and Mulrow26) (Supplementary Tables S1 and S2).
Eligibility criteria
The inclusion criteria were as follows: (1) original, peer-reviewed articles, including short communications with original data; (2) studies involving human participants from general, middle-aged and older adult populations (typically ≥40 years); (3) studies assessing dietary factors as the primary exposure and MRI-based brain biomarkers as the primary outcome; and (4) studies using either longitudinal designs or cross-sectional analyses derived from cohort studies (i.e. dietary assessments conducted at an earlier visit, with MRI measurements obtained during a subsequent follow-up). These designs allowed for a temporal ordering from exposure to outcome, even though the analyses were cross-sectional and MRI biomarkers at the time of dietary assessment were not available. The exclusion criteria were as follows: non-original articles or short communications without original data involving humans; grey literature not subjected to peer-review; studies conducted exclusively in populations with specific medical or cognitive conditions (e.g. mild cognitive impairment, hypertension or stroke); cross-sectional studies that collected dietary data and MRI measurements at the same visit, which were excluded to minimise the risk of reverse causation; studies including only young adults aged 20–40 years; and articles not published in English. For studies generating multiple publications, all articles were included if they assessed different dietary factors or MRI biomarkers. If identical exposures and outcomes were reported across publications, only the most recent or most comprehensive article was retained. Studies were excluded if dietary factors were not the primary exposure, MRI biomarkers were not the outcome or if dietary factors were part of a broader exposure without independent results.
Data sources and search strategy
Original articles published up to 19 July 2024 were identified using a comprehensive search strategy in three databases: PubMed (https://www.ncbi.nlm.nih.gov/pubmed/), Ovid-Embase (https://ovidsp.tx.ovid.com) and PsycInfo (https://www.proquest.com/psycinfo). Detailed search index terms are listed in Supplementary Table S3. Study design filters were provided by the University of Texas (https://libguides.sph.uth.tmc.edu/search_filters). Among observational studies, cross-sectional studies using dietary data and MRI biomarkers measured at the same visit were excluded after reviewing the full text.
Study selection and data extraction
Two researchers independently performed a blinded screening of titles and abstracts using the Rayyan platform. Rayyan is a free, web-based tool developed by the Qatar Computing Research Institute (https://www.rayyan.ai/) to facilitate systematic review screening and study selection through semi-automatic duplicate detection, keyword highlighting and blinded collaboration among multiple reviewers. When consensus on eligibility could not be reached, a third investigator determined relevance. The extracted data were general characteristics (author, year and country), study design (type of study and duration/follow-up period), population characteristics (sample size, age or age range and sex and race distributions), dietary factors (dietary intake and biomarkers, assessment methods), MRI biomarkers and covariates. In addition, we extracted the direction of associations or effects – depending on study design – from the most fully adjusted models and summarised the findings narratively, owing to substantial heterogeneity in exposures, outcomes and analytical methods. Given the large number of associations examined across studies, effect size estimates (r, β and OR) were reported only for statistically significant findings, when such estimates were explicitly reported (e.g. as many voxel-based analyses do not report explicit effect size maps). Results were synthesised on the basis of four dietary factors across cross-sectional and longitudinal analyses from prospective cohort studies: nutrients, foods, dietary patterns (including quality indices) and blood biomarkers from specimens. For intervention studies, only the first three of the above dietary factors were analysed.
The five MRI biomarkers (categorised into structural and functional measures) were as follows for structural MRI biomarkers: (1) macrostructural measures, such as whole and regional brain volumes and cortical thickness; (2) microstructural measures, such as white matter integrity (WMI); (3) lesion measures, such as white matter hyperintensity (WMH) and infarcts. For functional MRI biomarkers: (1) perfusion measures such as cerebral blood flow (CBF) and cerebral blood volume (CBV) and (2) functional measures, such as functional activity and connectivity. The following methods were used to measure MRI biomarkers(Reference Jensen, Leoni, Klein-Flugge, Ebmeier and Suri25): First, macrostructural measures, including total brain volume (TBV), grey matter volume (GMV) and white matter volume (WMV), regional volumes and cortical thickness were measured using T1-weighted MRI scans. Second, microstructural measures, including diffusion tensor imaging (DTI) was utilised to examine WMI by detecting the directional diffusion of water in the brain, and by quantifying its anisotropic diffusion. Key metrics of fractional anisotropy (FA), mean diffusivity (MD), axial diffusivity (AD) and radial diffusivity (RD) were used. Brain regions with high FA and low MD were assumed to have well organised axon arrays and better myelin integrity(Reference Bennett and Madden27,Reference Reddan, Macpherson, White, Choley and Pipingas28) . Third, lesion measures, such as WMH, which reflect pathophysiological structural changes, were assessed using T2-weighted (T2) and fluid attenuated inversion recovery (FLAIR) MRI sequences. WMHs represent altered interstitial fluid mobility and increased water. Fourth, perfusion measures were evaluated using perfusion imaging. CBF, measured by arterial spin labelling (ASL), typically decreases with age and reflects cerebral perfusion status. Fifth, functional connectivity was mainly assessed using resting-state functional MRI (rs-fMRI), which measures the temporal correlation of blood oxygenation level-dependent (BOLD) signals between brain regions. In addition, brain activation was investigated with task-based fMRI (t-fMRI), which identifies brain regions that show a significant change in BOLD signal during a specific task. Owing to the limited number of articles addressing identical dietary factors and MRI biomarkers, a meta-analysis was not feasible.
Quality assessment
Study quality was assessed using the Newcastle–Ottawa scale (NOS) for non-randomised studies(Reference McPheeters, Kripalani, Peterson, Idowu, Jerome and Potter29) and the Cochrane Risk-of-Bias (RoB2) tool, version 2.0, for parallel and cross-over randomised trials(Reference Sterne, Savovic, Page, Elbers, Blencowe and Boutron30). The NOS evaluated selection, comparability and outcome domains through nine specific questions, while the RoB 2 tool examined the five domains of randomisation, intervention, missing outcome, measurement of outcome and result selection. Two investigators independently rated study quality (‘good’, ‘fair’ or ‘poor’ for cross-sectional analyses and longitudinal analyses) and risk of bias (‘low’, ‘some concerns’ or ‘high’ for randomised trials), resolving any discrepancies through discussion.
Results
Study selection
A total of 4523 articles (1992 from PubMed, 1803 from Embase and 728 from PsycInfo) were initially identified (Supplementary Fig. S1). After removing 904 duplicates, 3619 articles were screened on the basis of the titles and abstracts. From these, 3456 articles were excluded on the basis of title and abstract screening for irrelevance or ineligible design. However, cross-sectional studies were not excluded at this stage to distinguish cohort-based cross-sectional analyses from conventional cross-sectional studies during full-text screening, on the basis of the timing of dietary assessment and MRI measurement. Full-text screening was conducted on 163 articles, comprising 122 observational studies and 41 intervention studies. Of these, 112 were excluded owing to various reasons, such as not being peer-reviewed (e.g. conference abstracts), focusing on participants younger than 40 years, involving non-general populations or not including MRI biomarkers. During this process, thirty-one cross-sectional studies and two articles on altered mineral content were excluded because they were outside the review scope. Ultimately, thirty-eight observational studies (twenty-three cross-sectional and fifteen longitudinal analyses) and thirteen interventional studies were included in the systematic review.
Study characteristics
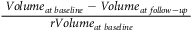
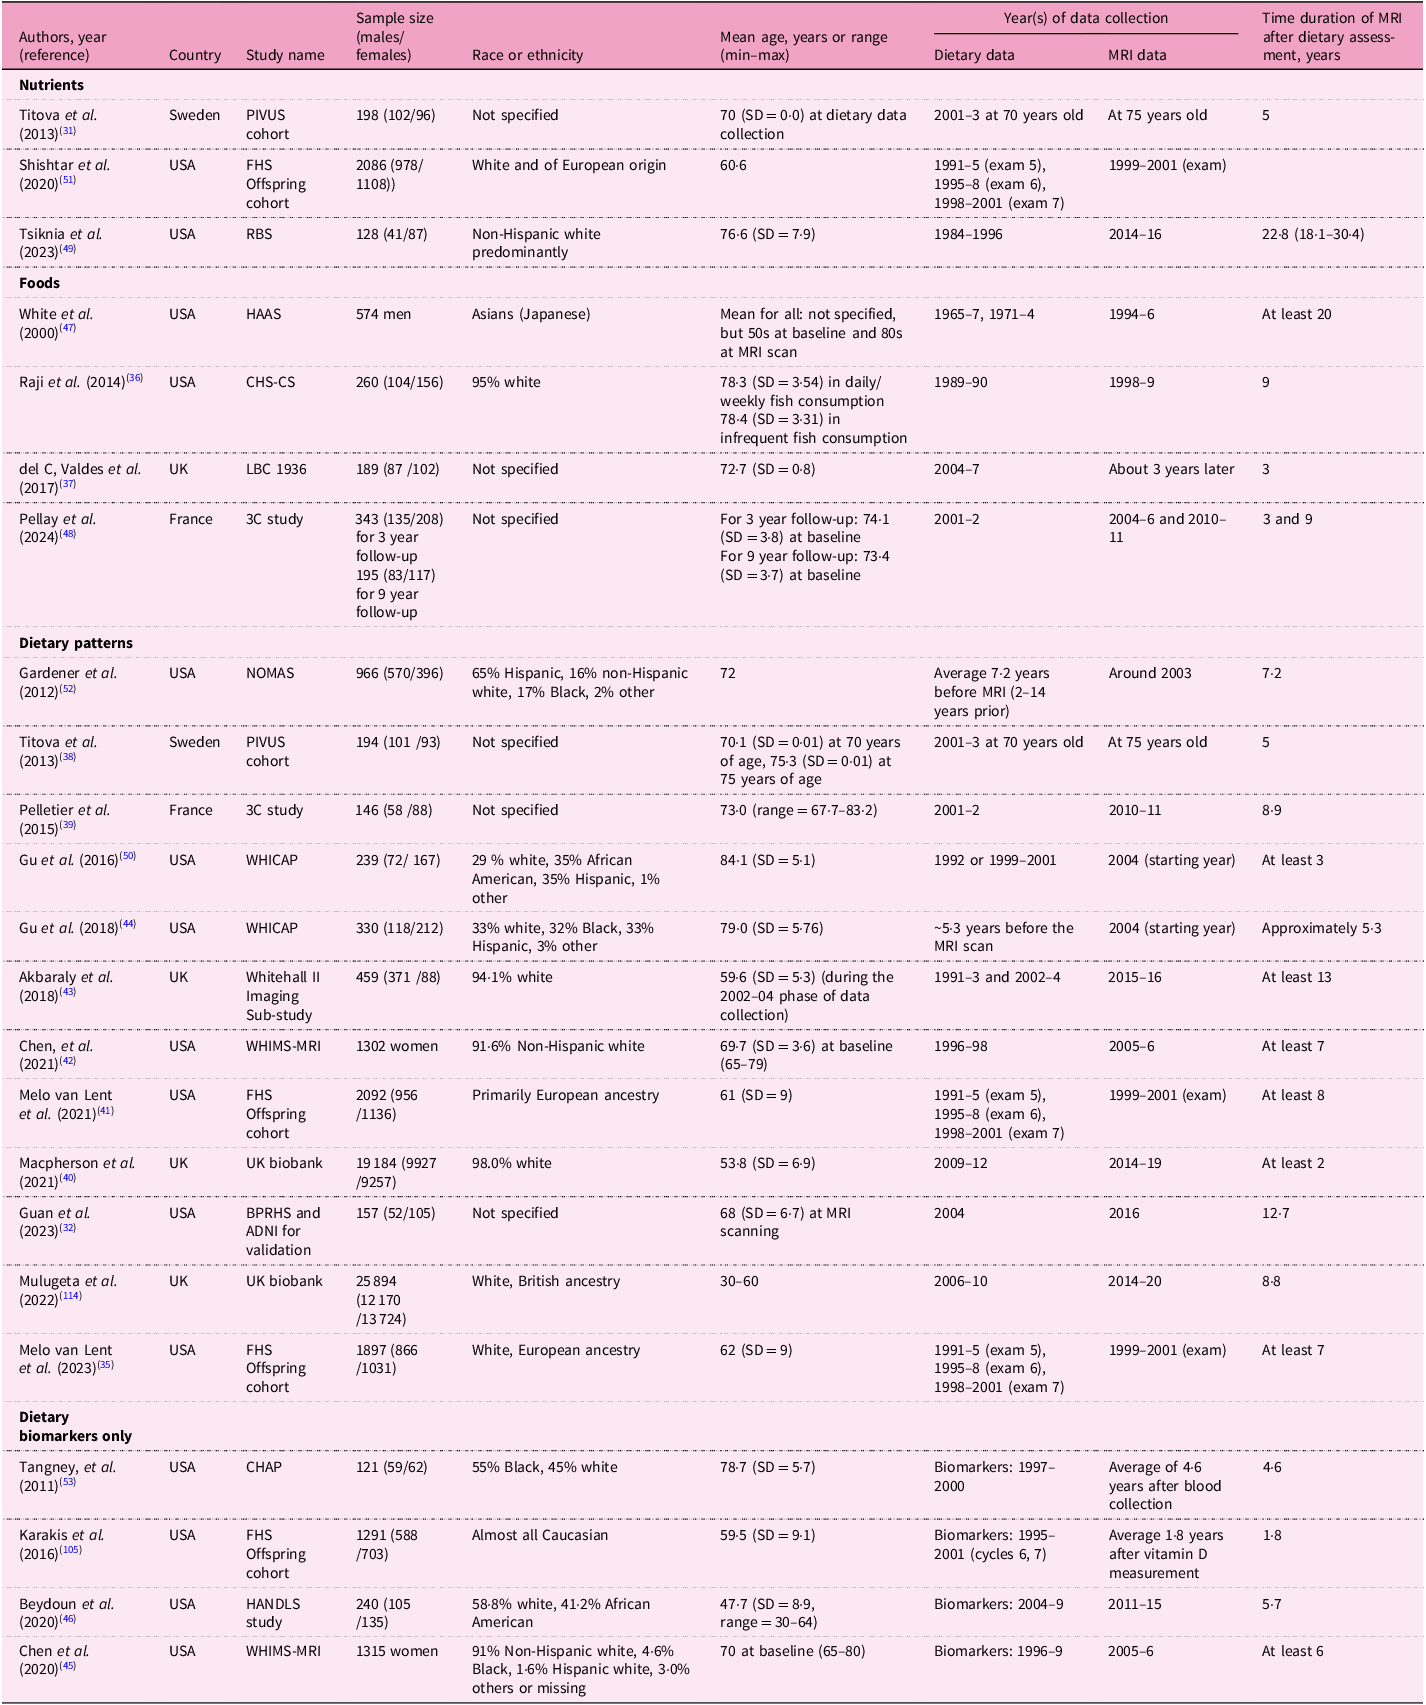
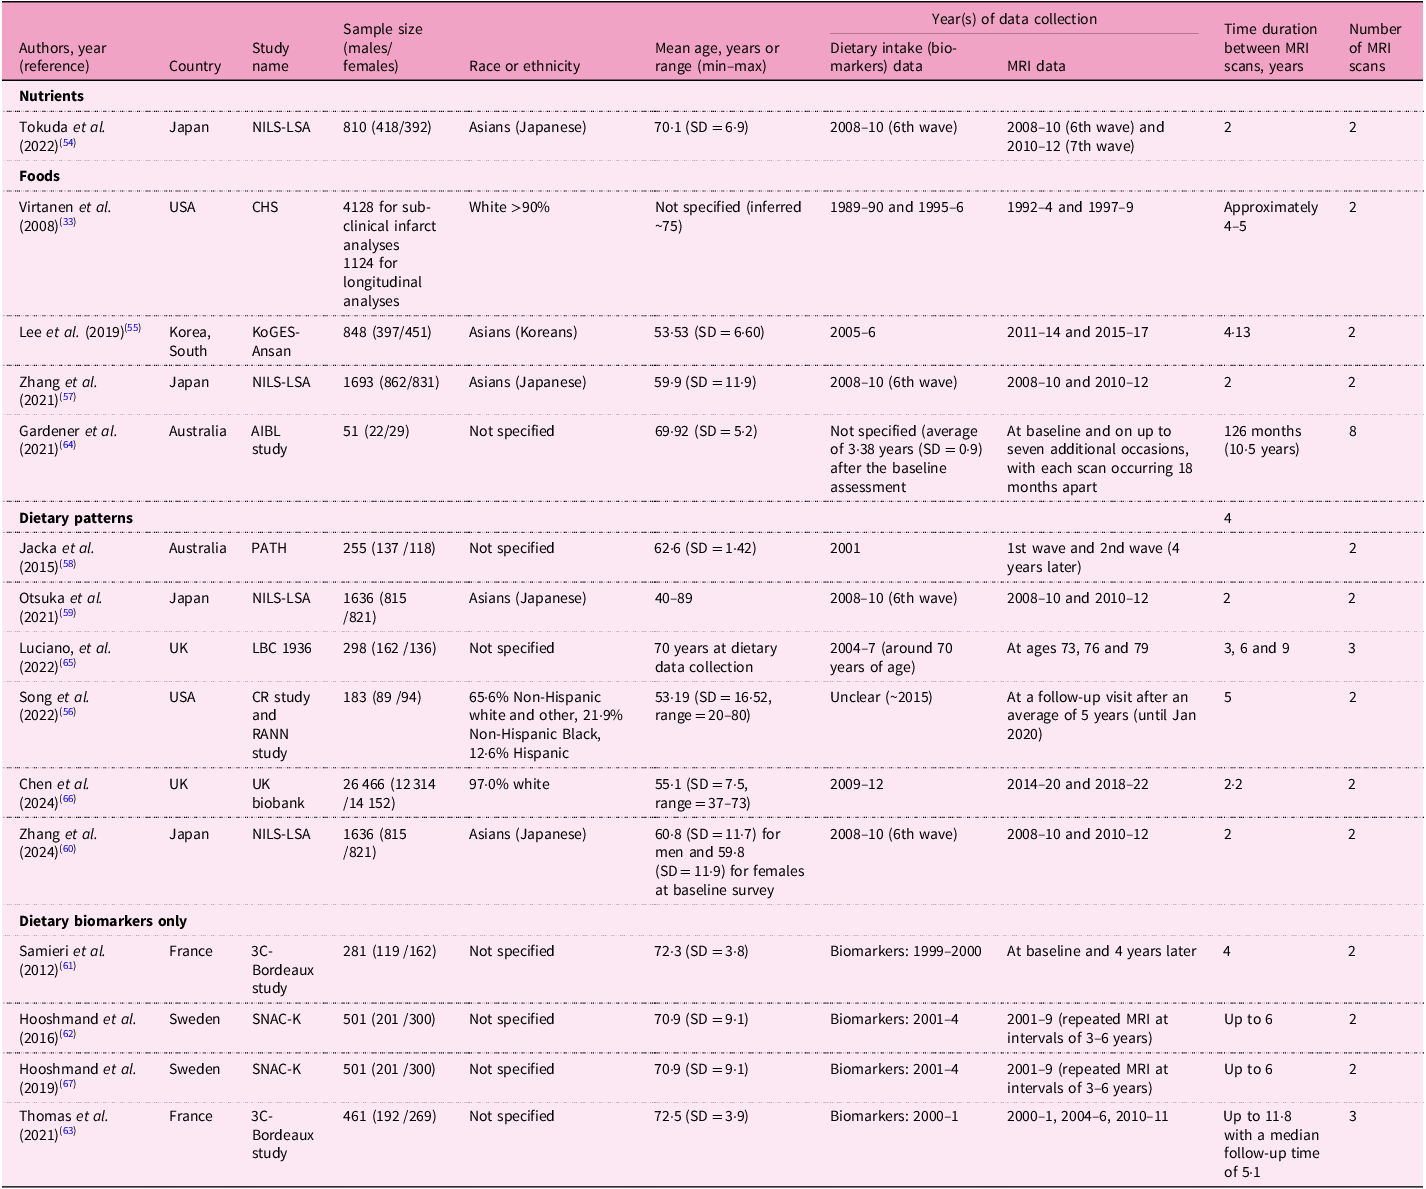
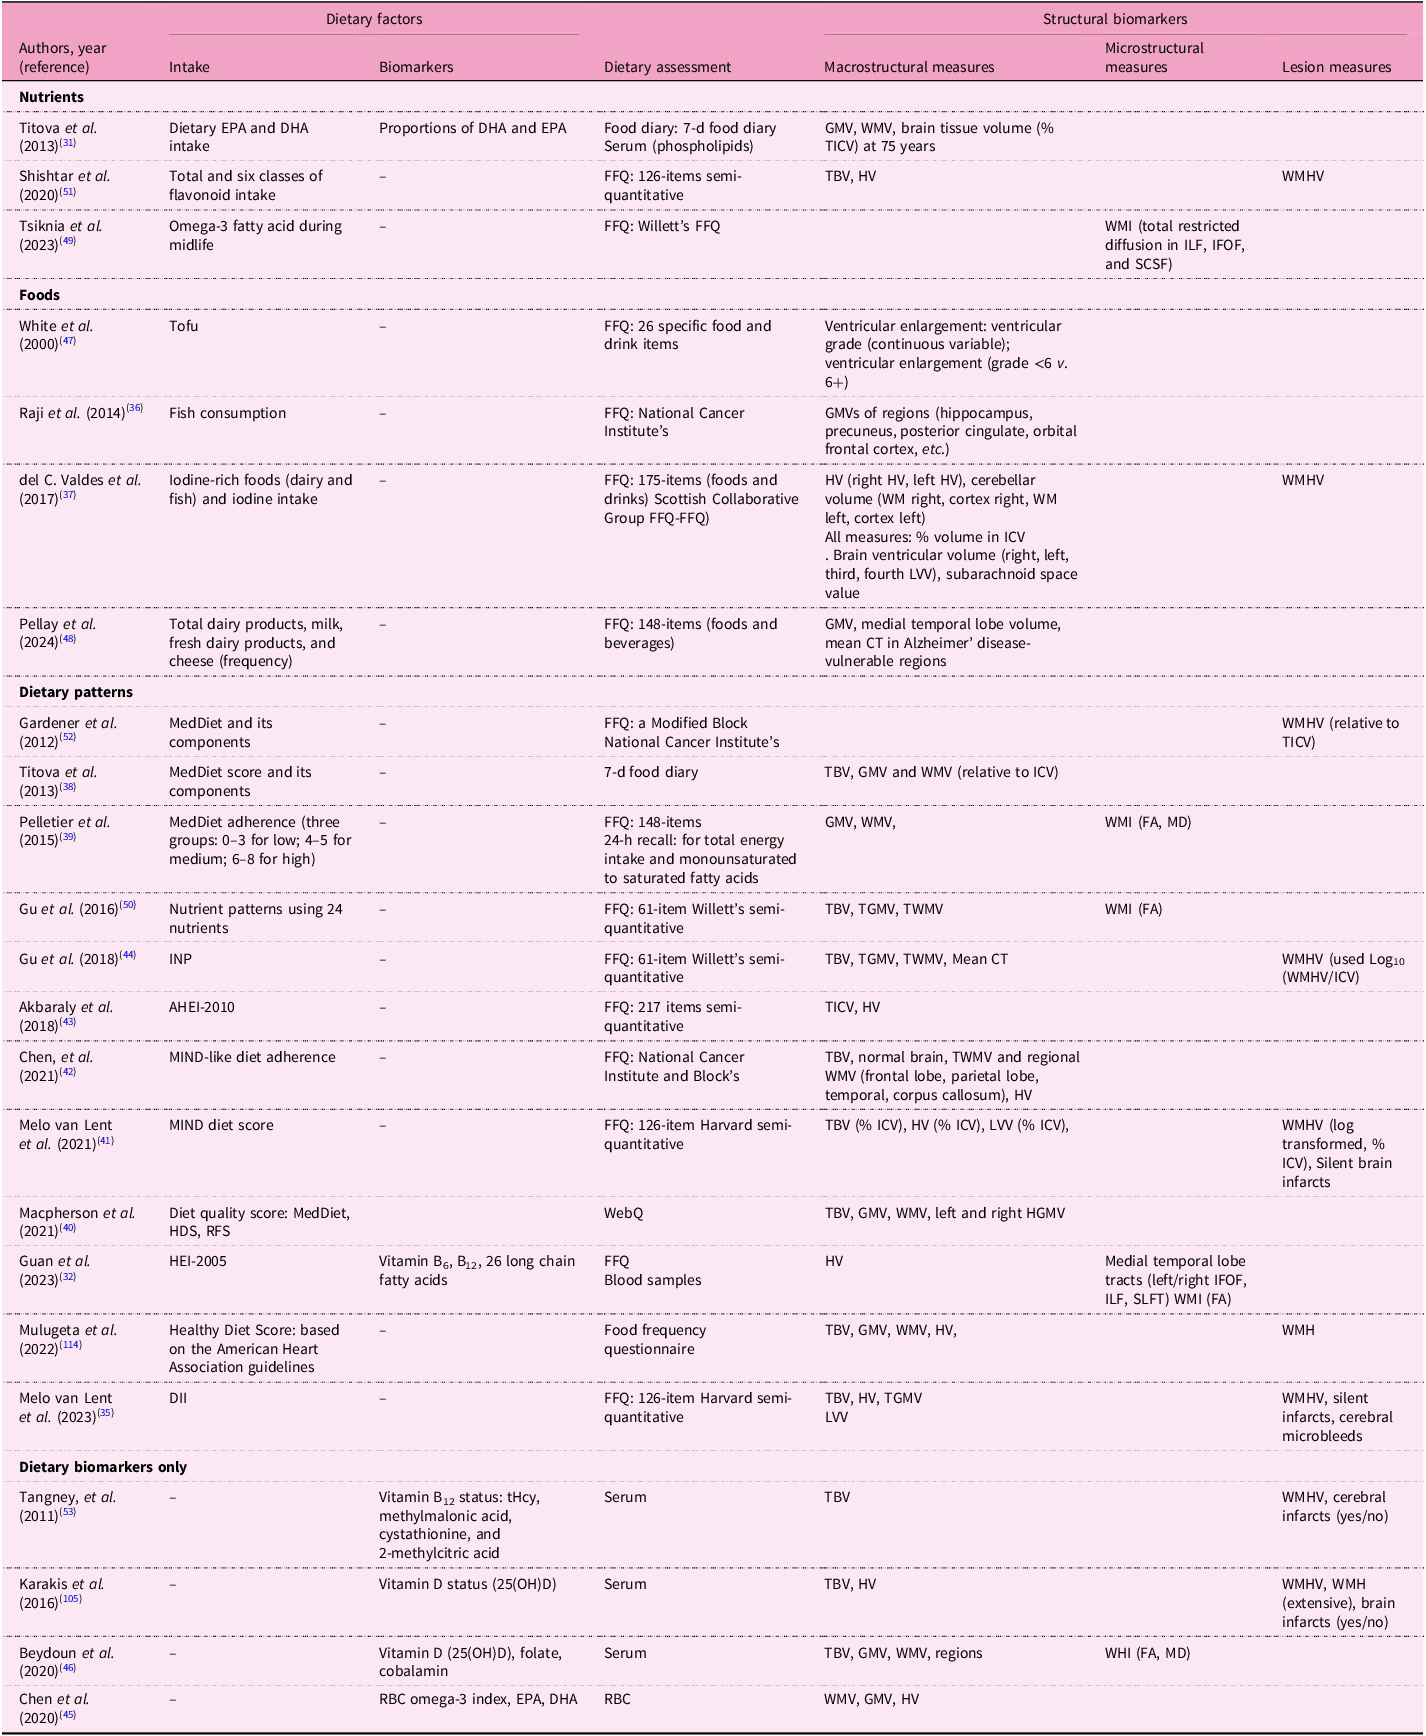
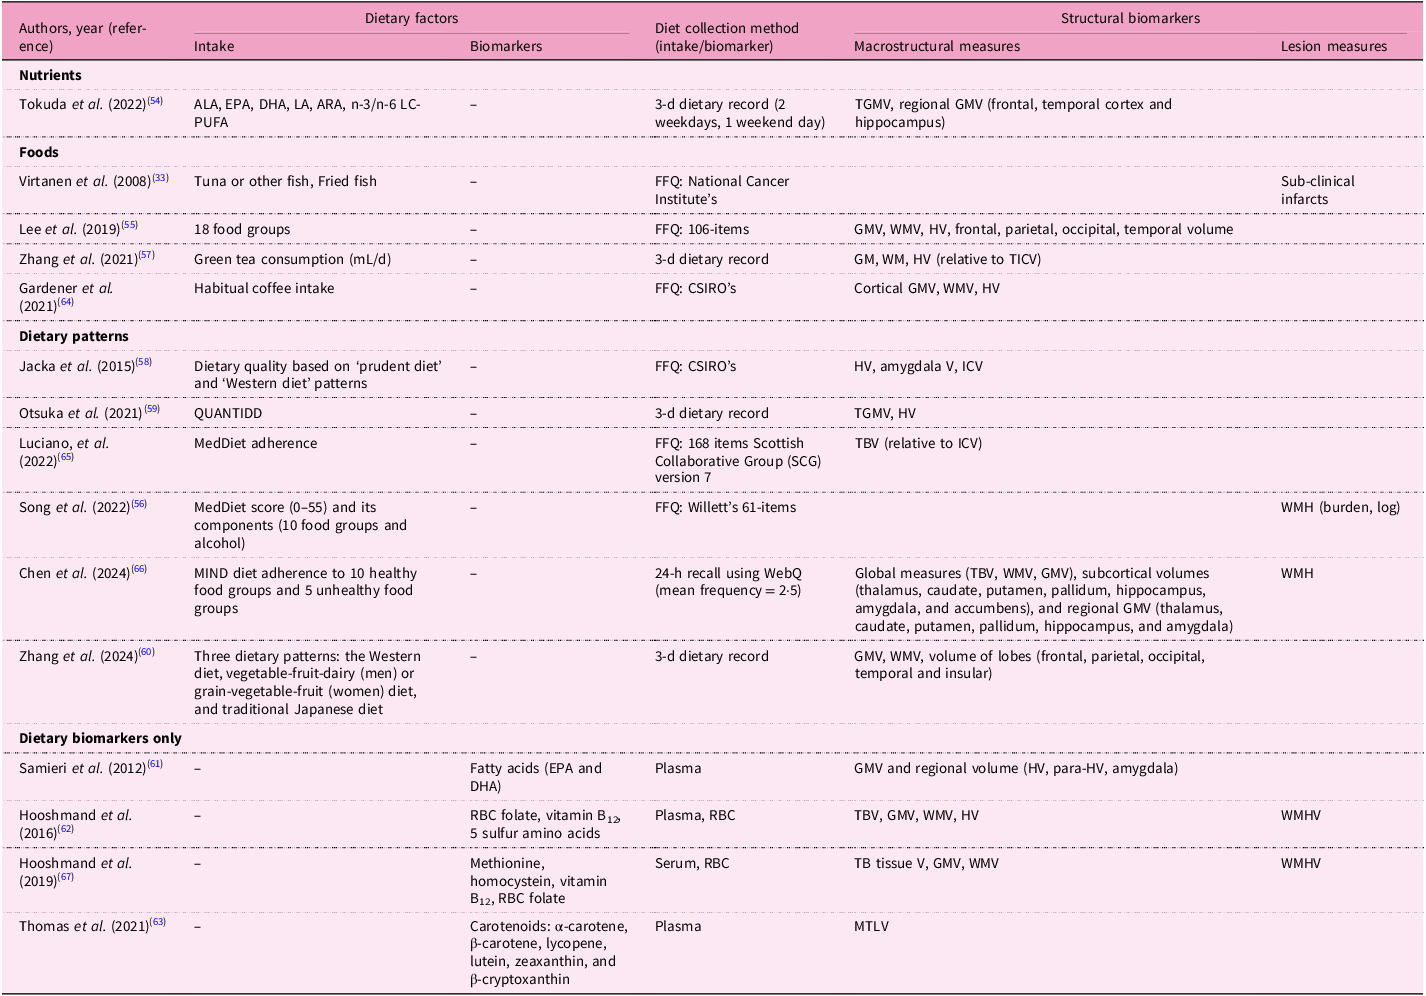
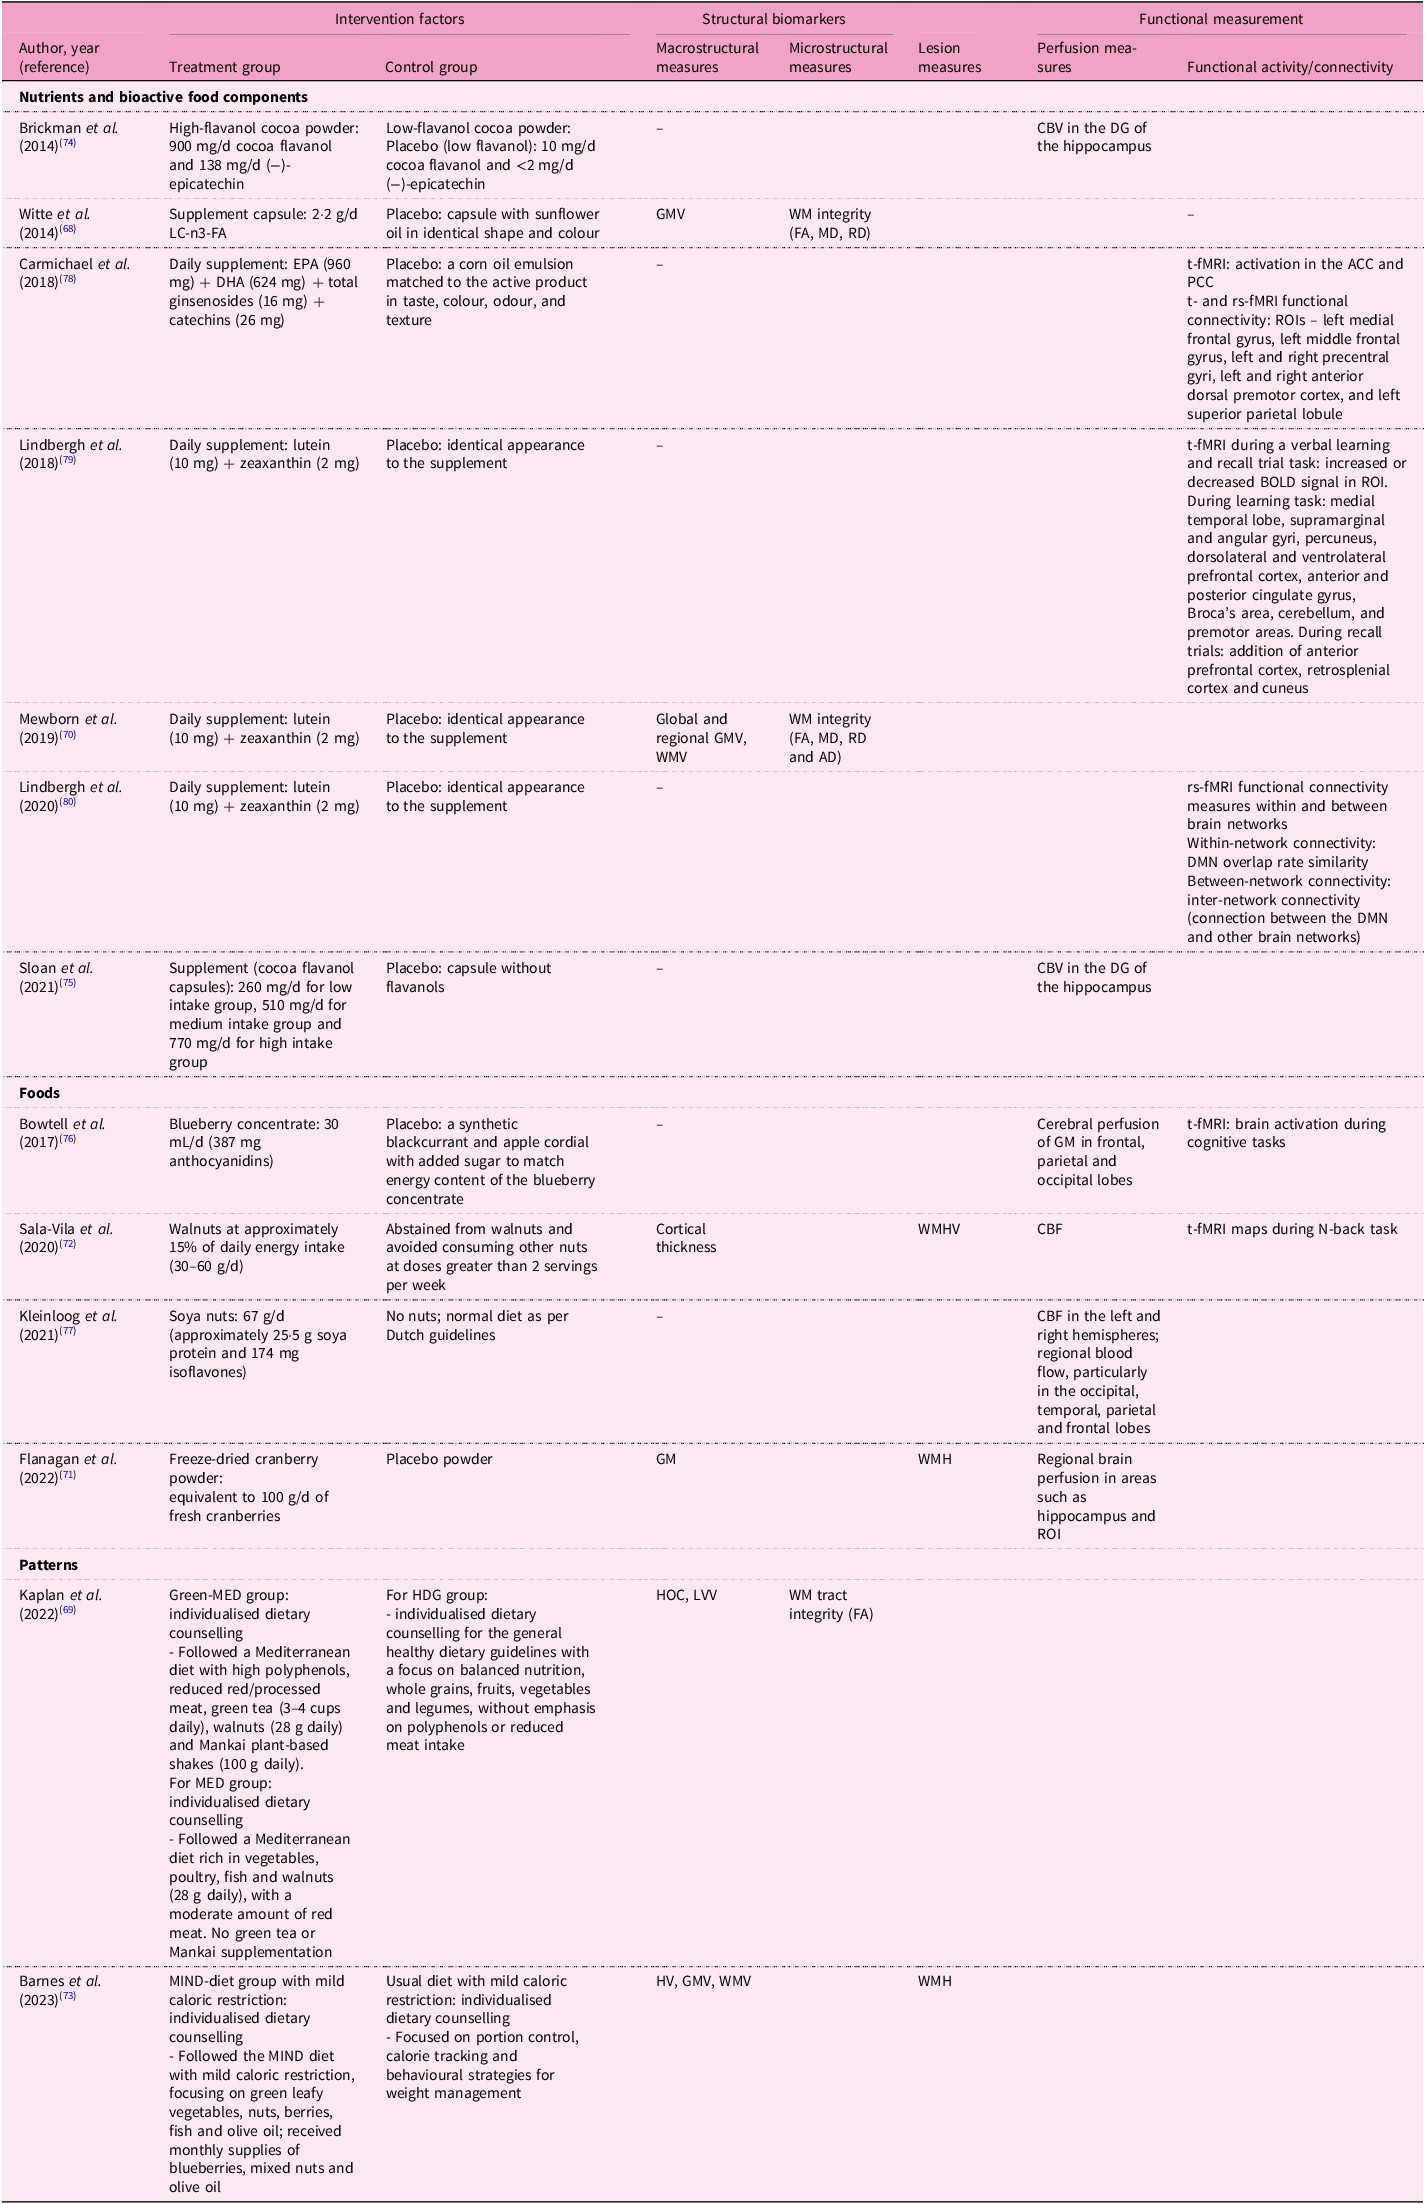
The twenty-three cross-sectional analyses were derived from fifteen specific cohorts (Table 1). Dietary factors investigated in these studies were nutrients (n = 3), foods (n = 4), dietary and nutrient patterns (n = 12) and dietary biomarkers (n = 4 using biomarkers only). Two studies assessed both dietary intake and circulating biomarkers(Reference Titova, Sjogren, Brooks, Kullberg, Ax and Kilander31,Reference Guan, Cheng, Bellomo, Narain, Bigornia and Garelnabi32) ; only one of these reported an association with MRI biomarkers(Reference Guan, Cheng, Bellomo, Narain, Bigornia and Garelnabi32). The most common dietary assessment method was a food frequency questionnaire (n = 22), followed by multiple food diary or recall method (n = 8). Most studies (n = 15) were conducted in the USA, with sample sizes ranging from fewer than 500 participants (n = 12) to more than 10 000 participants (n = 3). The time interval between dietary assessments and MRI measurements varied significantly, ranging from 1·8 years to more than 20 years. Fifteen longitudinal studies were derived from ten unique cohorts, including the National Institute for Longevity Sciences–Longitudinal Study of Aging (NILS-LSA), which reported results from four individual studies (Table 2). These studies assessed dietary factors of nutrients (n = 1), foods (n = 4), dietary patterns (n = 6) and dietary biomarkers measured in serum, plasma or erythrocytes (n = 4). The populations varied geographically, including studies from Japan (n = 4), the USA (n = 2), Australia (n = 2), the UK (n = 2), France (n = 2), Sweden (n = 2) and Korea (n = 1). Six studies had fewer than 500 participants, while one study included more than 10 000 participants. The average follow-up interval for MRI scans ranged from 2 to 10·5 years. Table 3 shows thirteen interventional studies that assessed nutrients (n = 7), foods (n = 4) and dietary patterns (n = 2). Eight of these studies were conducted in the USA, with intervention durations varying between 26 d to 3 years. The most common duration was 12 weeks, observed in five studies.
Table 1. Study characteristics: cross-sectional analyses in the prospective cohort studies

PIVUS, Prospective Investigation of the Vasculature in Uppsala Seniors; SD, standard deviation; FHS, Framingham Heart Study; RBS, Rancho Bernardo Study of Healthy Aging; HAAS, Honolulu-Asia Aging Study; CHS-CS, Cardiovascular Health Study Cognition Study; LBC, Lothian Birth Cohort; 3C, Three-City; NOMAS, Northern Manhattan Study; WHICAP, Washington Heights/Hamilton Heights Inwood Columbia Aging Project; WHIMS-MRI, Women’s Health Initiative Memory Study-MRI sub-study; BPRHS, Boston Puerto Rican Health Study; ADNI, Alzheimer’s Disease Neuroimaging Initiative; CHAP, Chicago Health and Aging Project; HANDLS, Healthy Aging in Neighborhoods of Diversity across the Life Span.
Table 2. Study characteristics: longitudinal analyses in the prospective cohort studies

NILS-LSA, National Institute for Longevity Sciences-Longitudinal Study of Aging; SD, standard deviation; CHS, Cardiovascular Health Study; KoGES-Ansan, the Korean Genomic and Epidemiology Study-Ansan cohort; AIBL, Australian Imaging, Biomarkers, and Lifestyle; PATH, Personality and Total Health Through Life Study; LBC, Lothian Birth Cohort; CR study, Cognitive Reserve study; RANN, Reference Ability Neural Network; 3C, Three-city; SNAC-K, Swedish National Study on Aging and Care in Kungsholmen.
Table 3. Characteristics of the intervention studies included in the systematic review

RCT, randomised clinical trial; Med, Mediterranean diet; HDG, healthy dietary guidelines.
Dietary factors and MRI measurements
Tables 4, 5 and 6 summarise dietary factors and MRI biomarkers. Regardless of study design, dietary factors examined in this review encompassed eleven nutrients, twelve foods, twenty dietary patterns and nine dietary biomarkers. Frequently studied dietary patterns included the MedDiet and the MIND diet. Common nutrients investigated were omega-3 fatty acids, antioxidant vitamins and flavonoids, while foods such as soya nuts, nuts, dairy, fish, tea, coffee and berries were also studied. Dietary biomarkers comprised carotenoids, vitamin B and D levels and omega-3 fatty acid profiles. Most studies used validated dietary assessment methods, including 24-h dietary recalls and food frequency questionnaire (FFQ). MRI scans were predominantly conducted at field strengths of 1·5T or 3T. Observational studies primarily used T1-weighted sequences to measure macrostructural measures such as brain volume and cortical thickness, including regions such as the hippocampus (Supplementary Table S4). Additional imaging sequences included DTI for evaluating white matter integrity (WMI) and FLAIR for assessing white matter hyperintensity (WMH). Abnormal signal intensity (≥3 mm)(Reference Virtanen, Siscovick, Longstreth, Kuller and Mozaffarian33) or Standards for Reporting Vascular Changes on Neuroimaging (STRIVE) criteria(Reference Wardlaw, Smith, Biessels, Cordonnier, Fazekas and Frayne34,Reference Melo Van Lent, Gokingco, Short, Yuan, Jacques and Romero35) were used to define subclinical brain infarcts. In contrast, intervention studies utilised a broader array of imaging techniques including functional imaging methods (rest-state and task-based fMRI) (Table 6). Cerebrovascular markers, including cerebral blood flow (CBF), were frequently assessed in these trials using ASL.
Table 4. Dietary factors and MRI biomarkers in the cross-sectional analyses from the prospective cohort studies

EPA, eicosapentaenoic acid; DHA, docosahexaenoic acid; GM(V), grey matter (volume); WM(V), white matter (volume); (T)ICV, total intracranial volume; FFQ, food frequency questionnaire; TBV, total brain volume; HV, hippocampal volume; WMH(V), white matter hyperintensity (volume); WMI, white matter integrity; ILF, inferior longitudinal fasciculus; IFOF, inferior frontal occipital fasciculus; SCSF, superior cortico-striatal fasciculus; LVV, lateral ventricular volume; CT, cortical thickness; MedDiet, Mediterranean diet; FA, fractional anisotropy; MD, mean diffusivity; INP, inflammation-related nutrient pattern; MIND, Mediterranean-DASH Intervention for Neurodegenerative Delay; HDS, Healthy Diet Score; RFS, Recommended Food Score; WebQ, validated web-based 24-h dietary recall questionnaire; HGMV, hippocampal grey matter volume; HEI, Healthy Eating Index; SLFT, superior longitudinal fasciculus; DII, Dietary Inflammatory Index; tHcy, total homocysteine; 25(OH)D, 25-hydroxyvitamin D; WHI, white matter integrity; LC, long-chain; RBC, erythrocytes.
Table 5. Dietary factors and change of MRI biomarkers in the longitudinal analyses from the prospective cohort studies

ALA, alpha-linolenic acid; EPA, eicosapentaenoic acid; DHA, docosahexaenoic acid; LA, linoleic acid; ARA, arachidonic acid; LC-PUFA, long-chain polyunsaturated fatty acid; (T)GM(V), total grey matter volume; FFQ, food frequency questionnaire; WM(V), white matter (volume); HV, hippocampal volume; (T)ICV, (total) intracranial volume; CSIRO, Commonwealth Scientific and Industrial Research Organisation; QUANTIDD, Quantitative Index for Dietary Diversity including 13 food groups; MedDiet, Mediterranean diet; WMH(V), white matter hyperintensity (volume); MIND, Mediterranean-DASH Intervention for Neurodegenerative Delay; WebQ, validated web-based 24-h dietary recall questionnaire; RBC, erythrocyte; TBV, total brain volume; MTLV, medial temporal lobe volume.
Table 6. Dietary factors and MRI biomarkers in the interventional studies included in the systematic review

CBV, cerebral blood volume; DG, dentate gyrus; LC-n3-FA, long chain-n3-fatty acid; GMV, grey matter volume; WM, white matter; FA, fractional aniosotropy; MD, mean diffusivity; RD, radial diffusivity; PCC, posterior cingulate cortex; EPA, eicosapentaenoic acid; DHA, docosahexaenoic acid; ACC, anterior cingulate cortex; PCC, posterior cingulate cortex; BOLD, blood oxygenation level-dependent; ROIs, regions of interest; WMV, white matter volume; AD, axial diffusivity; DMN, Default Mode Network; CBF, cerebral blood flow; WMHV, white matter hyperintensity volume; MeD, Mediterranean diet; HDG, healthy dietary guidelines; HOC, hippocampal occupancy score; LVV, lateral ventricular volume; MIND, Mediterranean-DASH Intervention for Neurodegenerative Delay; HV, hippocampal volume.
Associations between dietary factors and MRI biomarkers
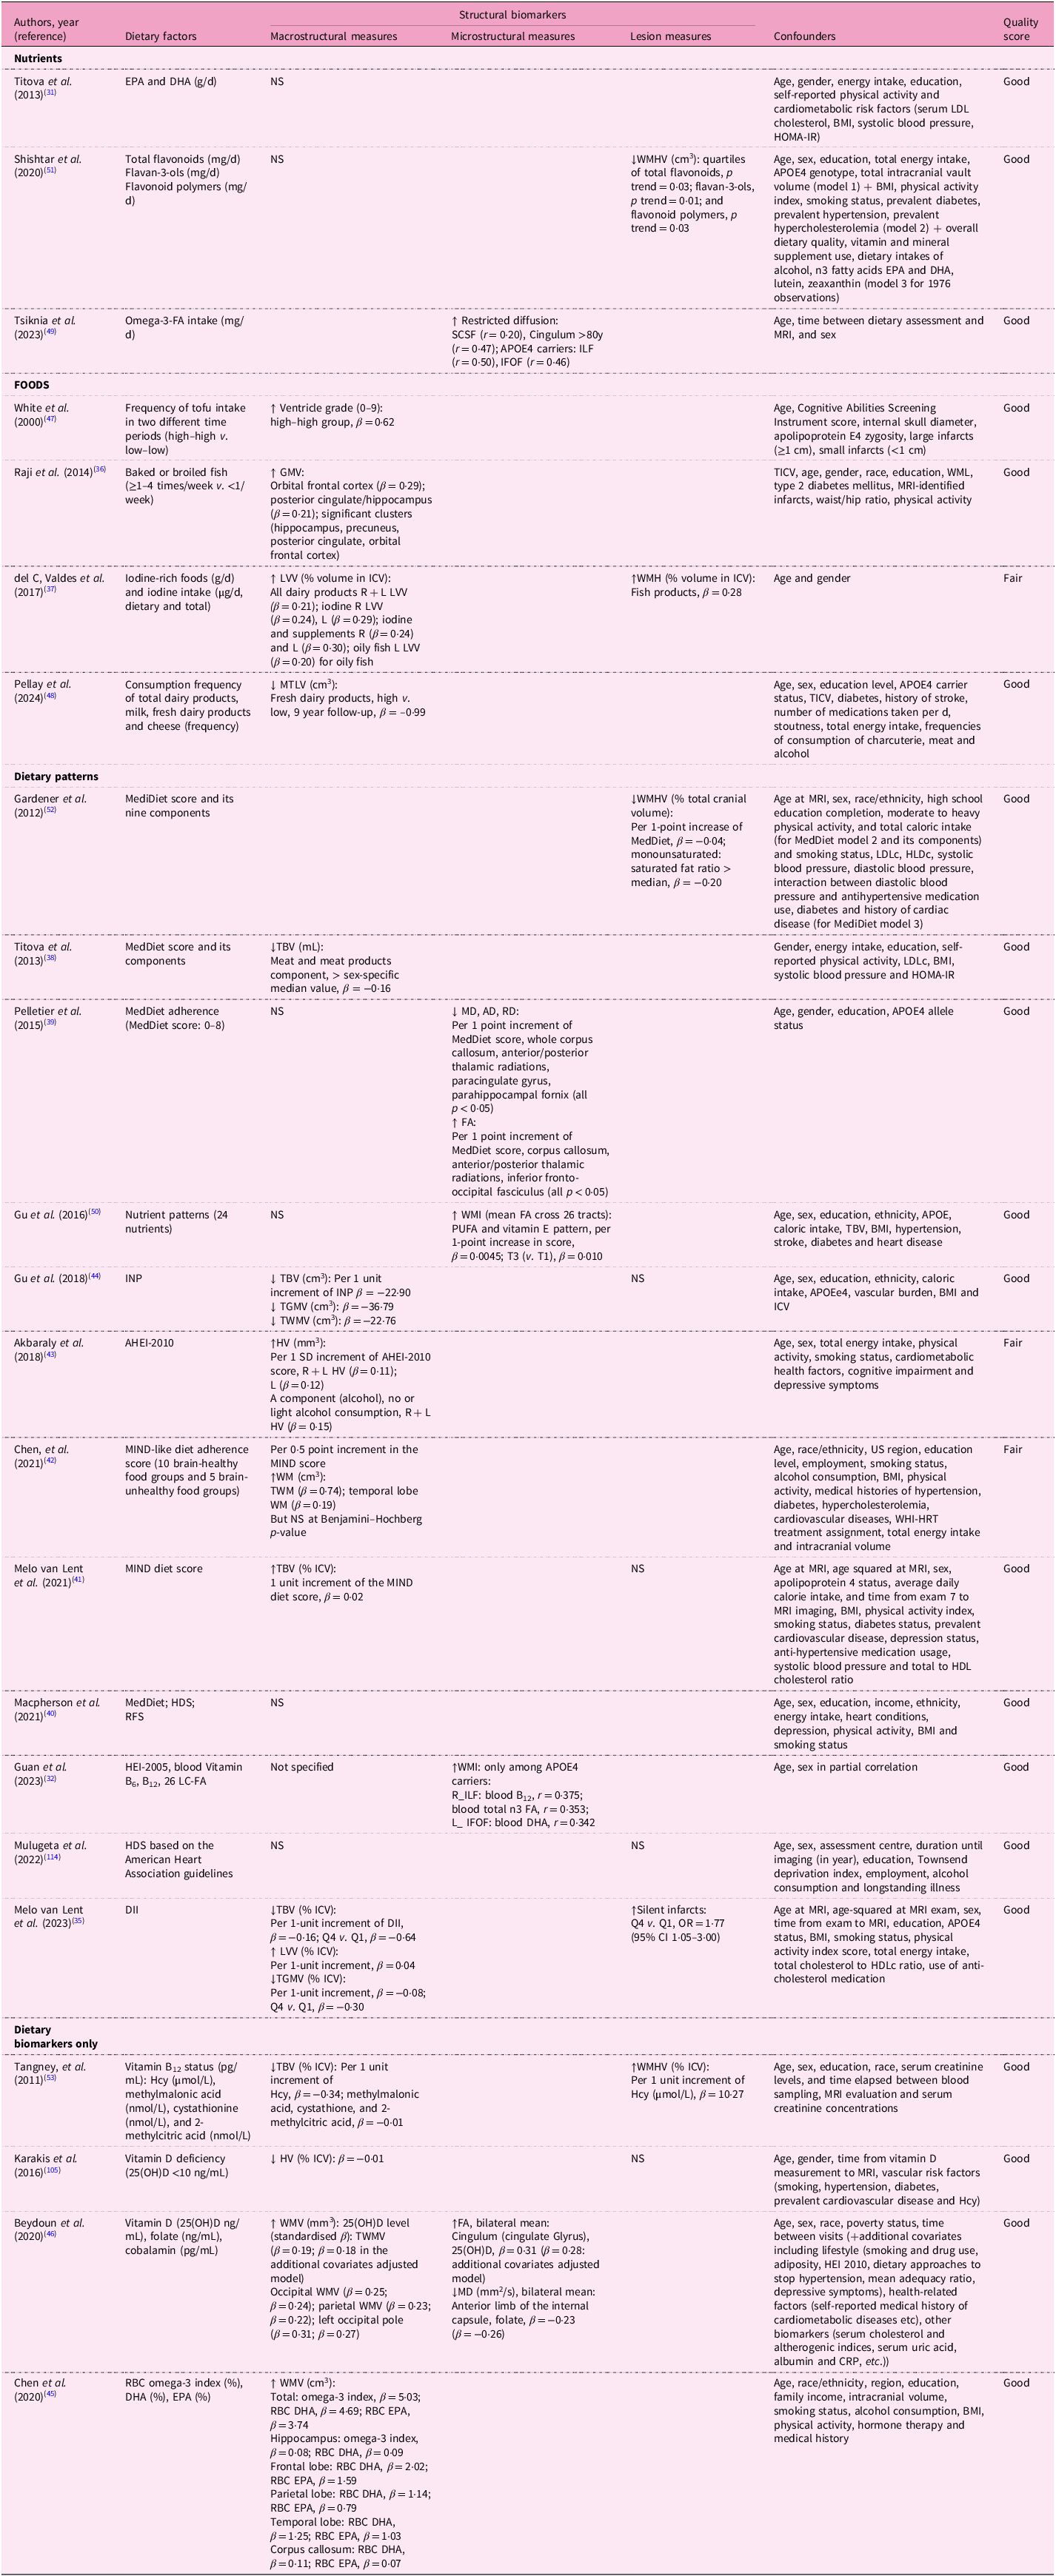
Across cross-sectional analyses, several dietary factors showed beneficial associations with MRI biomarkers; however, findings were inconsistent across studies or biomarkers, with some reporting opposite-direction associations (Table 7). Fish consumption showed mixed results for macrostructural measures: baked or broiled fish consumption (≥1–4 times/week v. <1/week) was beneficially associated with GMVs in regions such as hippocampus volume (standardised β = 0·21)(Reference Raji, Erickson, Lopez, Kuller, Gach and Thompson36), while oily fish was positively associated with lateral ventricular volume (LVV)(Reference del C. Valdes Hernandez, Kyle, Allan, Allerhand, Clark and Munoz Manieg37). Dietary patterns demonstrated variable associations with macrostructural measures. Within the MedDiet, higher consumption of meat and meat products was inversely associated with total brain volume (TBV)(Reference Titova, Ax, Brooks, Sjogren, Cederholm and Kilander38), yet overall MedDiet scores showed no significant associations in some studies(Reference Pelletier, Barul, Feart, Helmer, Bernard and Periot39,Reference Macpherson, McNaughton, Lamb and Milte40) . The MIND diet study showed positive associations [e.g. per 1-unit increase, TBV % intracranial volume (ICV), β = 0·02](Reference Melo van Lent, O’Donnell, Beiser, Vasan, DeCarli and Scarmeas41), though another MIND-like score yielded non-significant outcomes for white matter measures (total white matter, β = 0·74; temporal WM, β = 0·19) after Benjamini–Hochberg correction(Reference Chen, Hayden, Kaufman, Espeland, Whitsel and Serre42). The alternative Healthy Eating Index (AHEI)-2010 correlated positively with hippocampal volume (HV)(Reference Akbaraly, Sexton, Zsoldos, Mahmood, Filippini and Kerleau43), whereas inflammatory patterns (inflammation-related nutrient pattern (INP)(Reference Gu, Manly, Mayeux and Brickman44) and dietary inflammatory index (DII)(Reference Melo Van Lent, Gokingco, Short, Yuan, Jacques and Romero35)) were inversely associated with brain volumes. Blood biomarkers showed selective associations: omega-3 fatty acid levels correlated positively with white matter volume (WMV)(Reference Chen, Xun, Kaufman, Hayden, Espeland and Whitsel45), homocysteine (Hcy) negatively with TBV, while vitamin B12 showed no associations(Reference Beydoun, Shaked, Hossain, Beydoun, Katzel and Davatzikos46). Unexpectedly, tofu consumption correlated with increased ventricular enlargement(Reference White, Petrovitch, Ross, Masaki, Hardman and Nelson47), and dairy products with larger LVV(Reference del C. Valdes Hernandez, Kyle, Allan, Allerhand, Clark and Munoz Manieg37) and smaller medial temporal lobe volume (MTLV)(Reference Pellay, Baillet, Helmer, Catheline, Marmonier and Samieri48). For microstructural measures, omega-3 fatty acids intake enhanced total restricted diffusion(Reference Tsiknia, Bergstrom and Reas49) and MedDiet score(Reference Pelletier, Barul, Feart, Helmer, Bernard and Periot39), while PUFA and vitamin E pattern(Reference Gu, Vorburger, Gazes, Habeck, Stern and Luchsinger50) and HEI-2005(Reference Guan, Cheng, Bellomo, Narain, Bigornia and Garelnabi32) similarly improved white matter integrity (WMI). Blood vitamin D(Reference Beydoun, Shaked, Hossain, Beydoun, Katzel and Davatzikos46) and folate(Reference Beydoun, Shaked, Hossain, Beydoun, Katzel and Davatzikos46) were also beneficially associated with WMI. Lesion measures revealed mixed patterns: flavonoids(Reference Shishtar, Rogers, Blumberg, Au, Decarli and Jacques51) and MediDiet reduced lesions(Reference Gardener, Scarmeas, Gu, Boden-Albala, Elkind and Sacco52), whereas homocysteine (Hcy)(Reference Tangney, Aggarwal, Li, Wilson, Decarli and Evans53) and fish products(Reference del C. Valdes Hernandez, Kyle, Allan, Allerhand, Clark and Munoz Manieg37) were associated with increased white matter hyperintensity volume (WMHV). The MIND diet showed no significant associations(Reference Melo van Lent, O’Donnell, Beiser, Vasan, DeCarli and Scarmeas41), while DII was positively associated with silent infarcts (OR = 1·77, 95% CI 1·05–3·00 in Q4 v. Q1)(Reference Melo Van Lent, Gokingco, Short, Yuan, Jacques and Romero35).
Table 7. Associations between dietary factors and MRI biomarkers in the cross-sectional analyses from the prospective cohort studies

↑ indicates positive association (greater volume, higher integrity or lower lesion burden); ↓ indicates negative association (smaller volume, lower integrity or greater lesion burden). Effect sizes are presented as standardised regression coefficients (β), correlation coefficients (r), odd ratios (OR) or p for trend values, as reported in each study.
EPA, eicosapentaenoic acid; DHA, docosahexaenoic acid; NS, not significant; LDL(c), low density lipoprotein (cholesterol); BMI, body mass index; HOMA-IR, homeostatic model assessment of insulin resistance; HV, hippocampal volume; WMH(V), white matter hyperintensity (volume); APOE4, apolipoprotein E4; omega-3-FA, omega-3 fatty acid; SCSF, superior cortico-striatal fasciculus; ILF, inferior longitudinal fasciculus; IFOF, inferior frontal occipital fasciculus; (T)GM(V), (total) grey matter (volume); (T)ICV, (total) intracranial volume; WMLs, white matter lesions; LVV, lateral ventricular volume; R, right; L, left; MTLV, medial temporal lobe volume; MedDiet, Mediterranean diet; HDL(c), high density lipoprotein (cholesterol); TBV, total brain volume; (T)WM(V), (total) white matter (volume); MD, mean diffusivity; AD, axial diffusivity; RD, radial diffusivity; FA, fractional anisotrophy; PUFA, polyunsaturated fatty acid; INP, inflammation-related nutrient pattern; (A)HEI, Alternative Healthy Eating Index; WHI-HRT, Women’s Health Initiative Hormone Replacement Therapy trial; MIND, Mediterranean-DASH Intervention for Neurodegenerative Delay; HDS, healthy diet score; RFS, recommended food score; SLFT, superior longitudinal fasciculus; ILF, inferior longitudinal fasciculus; DII, Dietary Inflammatory Index; Q, quartile; Hcy, homocysteine; 25(OH)D, 25-hydroxy vitamin D; LC, long chain; RBC, erythrocytes.
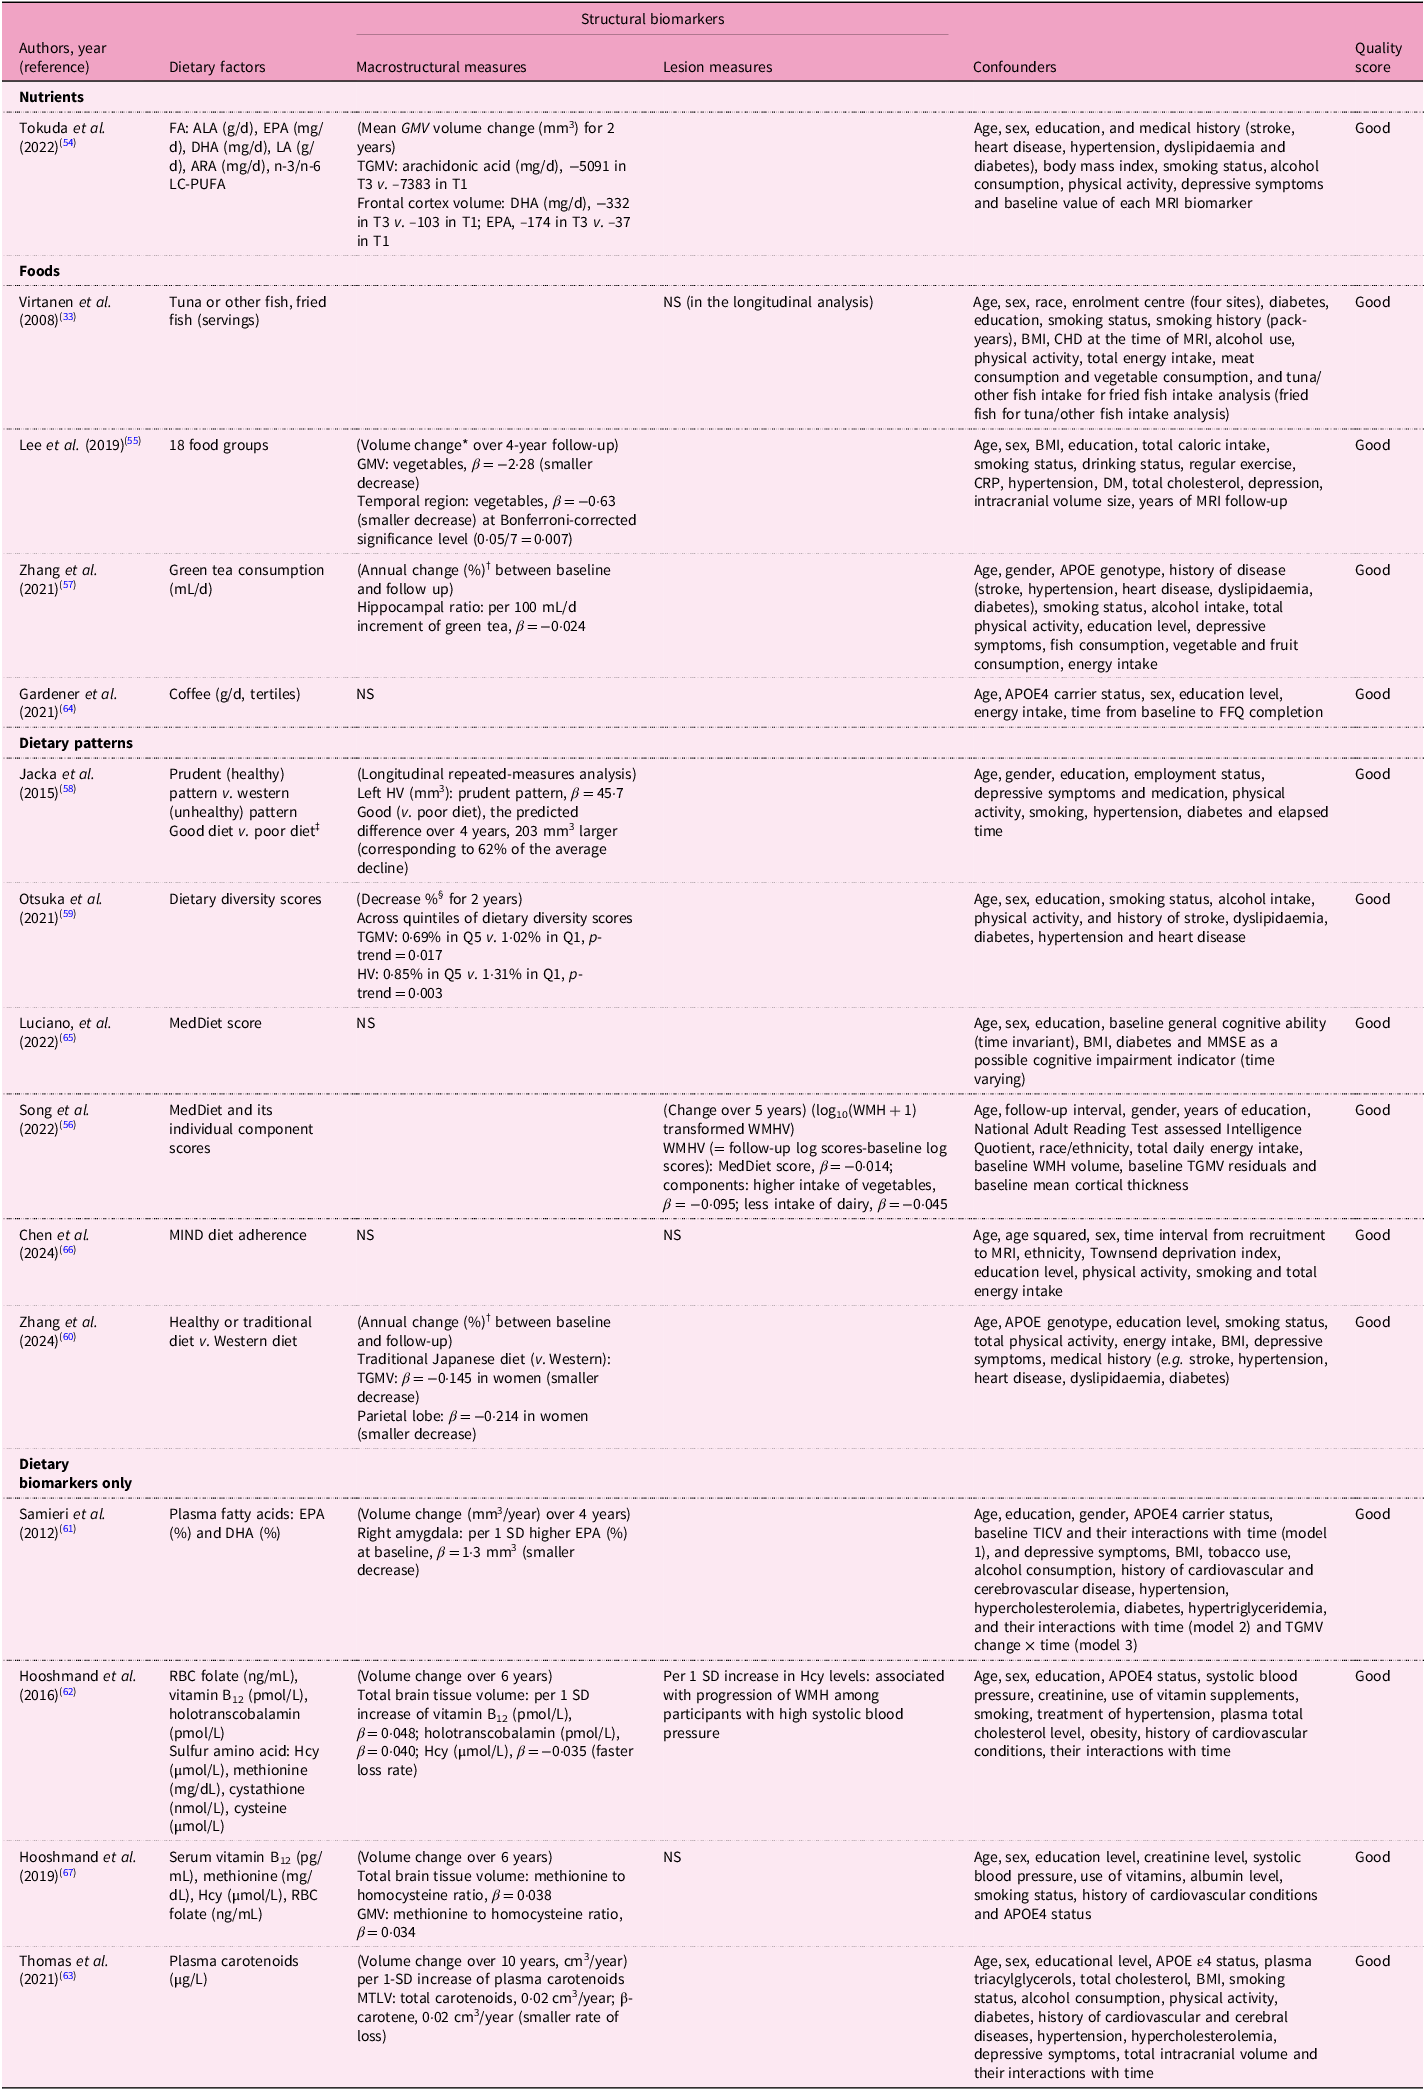
Table 8 presents findings from longitudinal studies between dietary factors and MRI biomarkers, including macrostructural and lesion measures. Protective dietary factors demonstrated consistent associations with brain preservation. Fatty acids (arachidonic acid, DHA and EPA)(Reference Tokuda, Horikawa, Nishita, Nakamura, Kato and Kaneda54), vegetables(Reference Lee, Kim and Shin55,Reference Song, Gaynor, Cruz, Lee, Gazes and Habeck56) , green tea(Reference Zhang, Otsuka, Nishita, Nakamura, Kato and Iwata57), prudent (healthy) dietary patterns(Reference Jacka, Cherbuin, Anstey, Sachdev and Butterworth58), dietary diversity(Reference Otsuka, Nishita, Nakamura, Kato, Iwata and Tange59) and healthy dietary patterns(Reference Zhang, Sala, Nakamura, Kato, Furuya and Shimokata60) all correlated with structural preservation across TBV, GMV and HV. Blood biomarkers similarly showed protective effects: EPA and DHA(Reference Samieri, Maillard, Crivello, Proust-Lima, Peuchant and Helmer61), vitamins B12 and E(Reference Hooshmand, Mangialasche, Kalpouzos, Solomon, Kareholt and Smith62), and carotenoids(Reference Thomas, Proust-Lima, Baillet, Helmer, Delcourt and Foubert-Samier63) were associated with reduced atrophy rates in TBV, GMV, amygdala and MTLV. Notably, green tea consumption (+100 mL/d) showed slower hippocampal atrophy (annual percentage change in hippocampal volume ratio, β = −0·024)(Reference Zhang, Otsuka, Nishita, Nakamura, Kato and Iwata57), while healthier dietary patterns (‘prudent’) preserved left hippocampal volume (β = 45·7 mm3), with good v. poor diet showing +203 mm3 difference over 4 years – equivalent to 62% of the average decline(Reference Jacka, Cherbuin, Anstey, Sachdev and Butterworth58). Higher plasma carotenoids and β-carotene (per one standard deviation (SD) increase) reduced the rate of medial temporal lobe volume (MTLV) loss by 0·02 cm3/year(Reference Thomas, Proust-Lima, Baillet, Helmer, Delcourt and Foubert-Samier63). For lesion measures, vegetables reduced WMH progression(Reference Song, Gaynor, Cruz, Lee, Gazes and Habeck56), while elevated Hcy was associated with increased lesion burden among hypertensive participants(Reference Hooshmand, Mangialasche, Kalpouzos, Solomon, Kareholt and Smith62). Conversely, dairy products were positively associated with WMHV(Reference Song, Gaynor, Cruz, Lee, Gazes and Habeck56). However, several longitudinal studies reported null findings: tuna or fish(Reference Virtanen, Siscovick, Longstreth, Kuller and Mozaffarian33), coffee(Reference Gardener, Rainey-Smith, Villemagne, Fripp, Dore and Bourgeat64), MedDiet(Reference Luciano, Corley, Hernandez, Craig, McNeill and Bastin65), MIND diet(Reference Chen, Dunk, Wang, Zhao, Shen and Zong66), blood folate(Reference Hooshmand, Mangialasche, Kalpouzos, Solomon, Kareholt and Smith62) and vitamin B12 (Reference Hooshmand, Refsum, Smith, Kalpouzos, Mangialasche and von Arnim67), consistent with cross-sectional study heterogeneity.
Table 8. Associations between dietary factors and MRI biomarkers in the longitudinal analyses from the prospective cohort studies

*The volume changes were calculated from brain-region-specific volumes at baseline subtracted by that at follow-up.
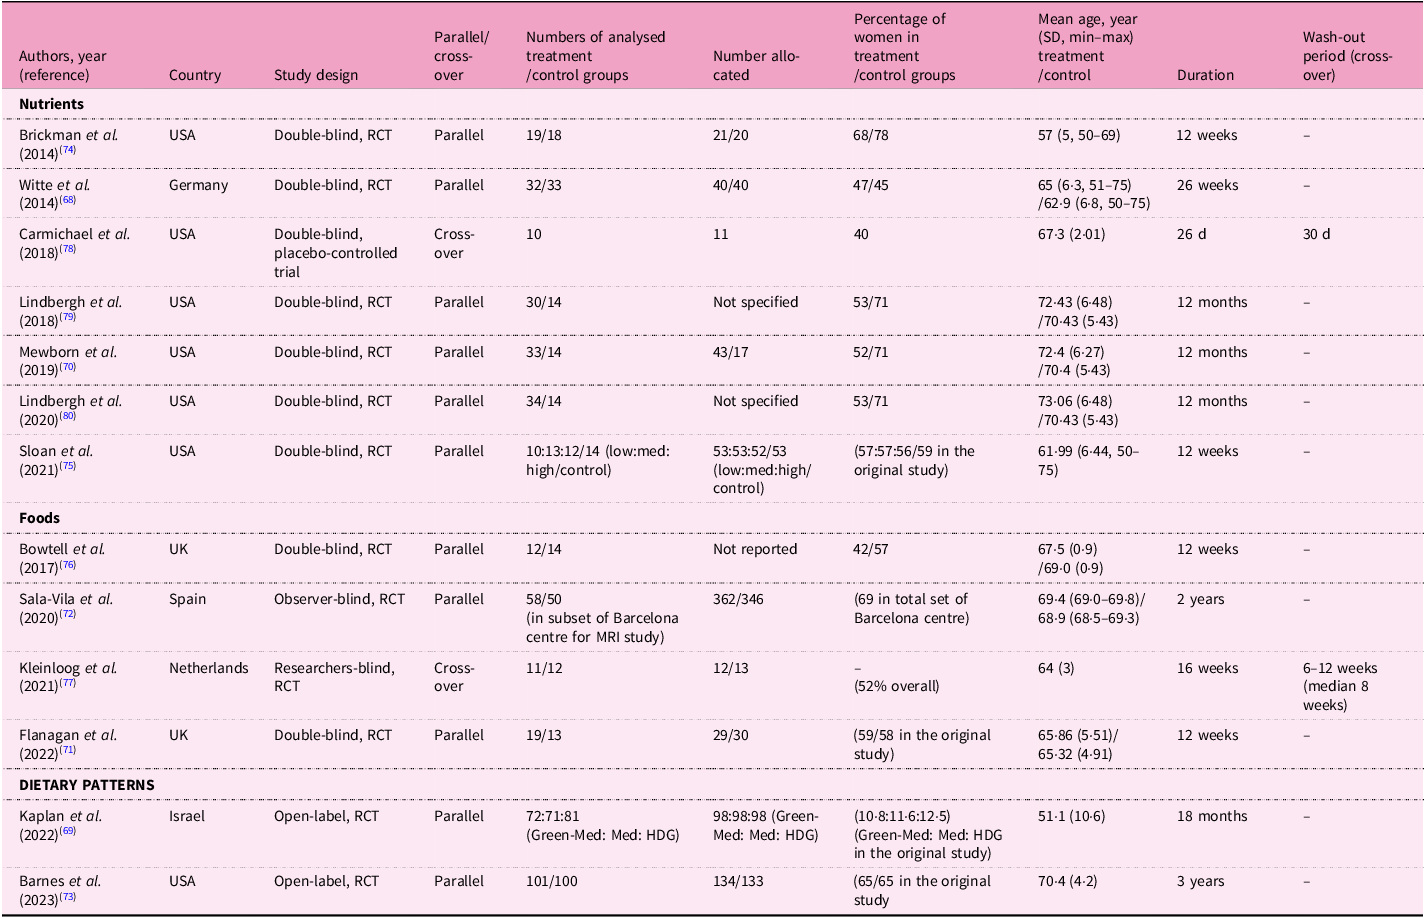
†Annual change of region of interest (ROI) (%) =
 $$[\left( {{{relative\;volume\;(or\;ratio)\;of\;RO{I_{at\;baseline}} - relative\;volume\;(or\;ratio)\;of\;RO{I_{at\;follow - up}}} \over {relative\;volume\;(or\;ratio)\;of\;RO{I_{at\;baseline}}}}} \right) \div \left( {{{follow - up\;time\;(days)} \over {365.25}}} \right)]$$
× 100%. Relative volume (or ratio) of ROI = ROI volume (mm3)/total intracranial volume (mm3).
$$[\left( {{{relative\;volume\;(or\;ratio)\;of\;RO{I_{at\;baseline}} - relative\;volume\;(or\;ratio)\;of\;RO{I_{at\;follow - up}}} \over {relative\;volume\;(or\;ratio)\;of\;RO{I_{at\;baseline}}}}} \right) \div \left( {{{follow - up\;time\;(days)} \over {365.25}}} \right)]$$
× 100%. Relative volume (or ratio) of ROI = ROI volume (mm3)/total intracranial volume (mm3).
‡Poor diet was defined as one SD below mean on prudent and 1 SD above mean on Western dietary factor scores. Good diet was defined as one SD above mean on prudent and one SD below on Western dietary factor scores.
§
Decrease % = ${{{{\;Volum}}{{{e}}_{{{at\;baseline\;}}}} - {{\;Volum}}{{{e}}_{{{at\;follow}} - {{up\;}}}}}}\over{{{{rVolum}}{{{e}}_{{{at\;baseline\;}}}}}}\;\;$
× 100%.
${{{{\;Volum}}{{{e}}_{{{at\;baseline\;}}}} - {{\;Volum}}{{{e}}_{{{at\;follow}} - {{up\;}}}}}}\over{{{{rVolum}}{{{e}}_{{{at\;baseline\;}}}}}}\;\;$
× 100%.
FA, fatty acid; ALA, alpha-linolenic acid; EPA, eicosapentaenoic acids; DHA, docosahexaenoic acid; LA, linoleic acid; ARA, arachidonic acid; LC-PUFA, long-chain polyunsaturated fatty acid; T, tertile; (T)GM(V), (total) grey matter (volume); NS, not significant; BMI, body mass index, CHD, coronary heart disease; HV, hippocampal volume; WM(V), white matter (volume); CRP, C-reactive protein; DM, diabetes mellitus; APOE, apolipoprotein E, FFQ, food frequency questionnaire; MedDiet, Mediterranean diet; MMSE, Mini-Mental State Examination; WMH(V), white matter hyperintensity (volume); MIND, Mediterranean-DASH Intervention for Neurodegenerative Delay; SD, standard deviation; TICV, total intracranial volume; RBC, erythrocyte; Hcy, homocysteine; MTLV, medial temporal lobe volume.
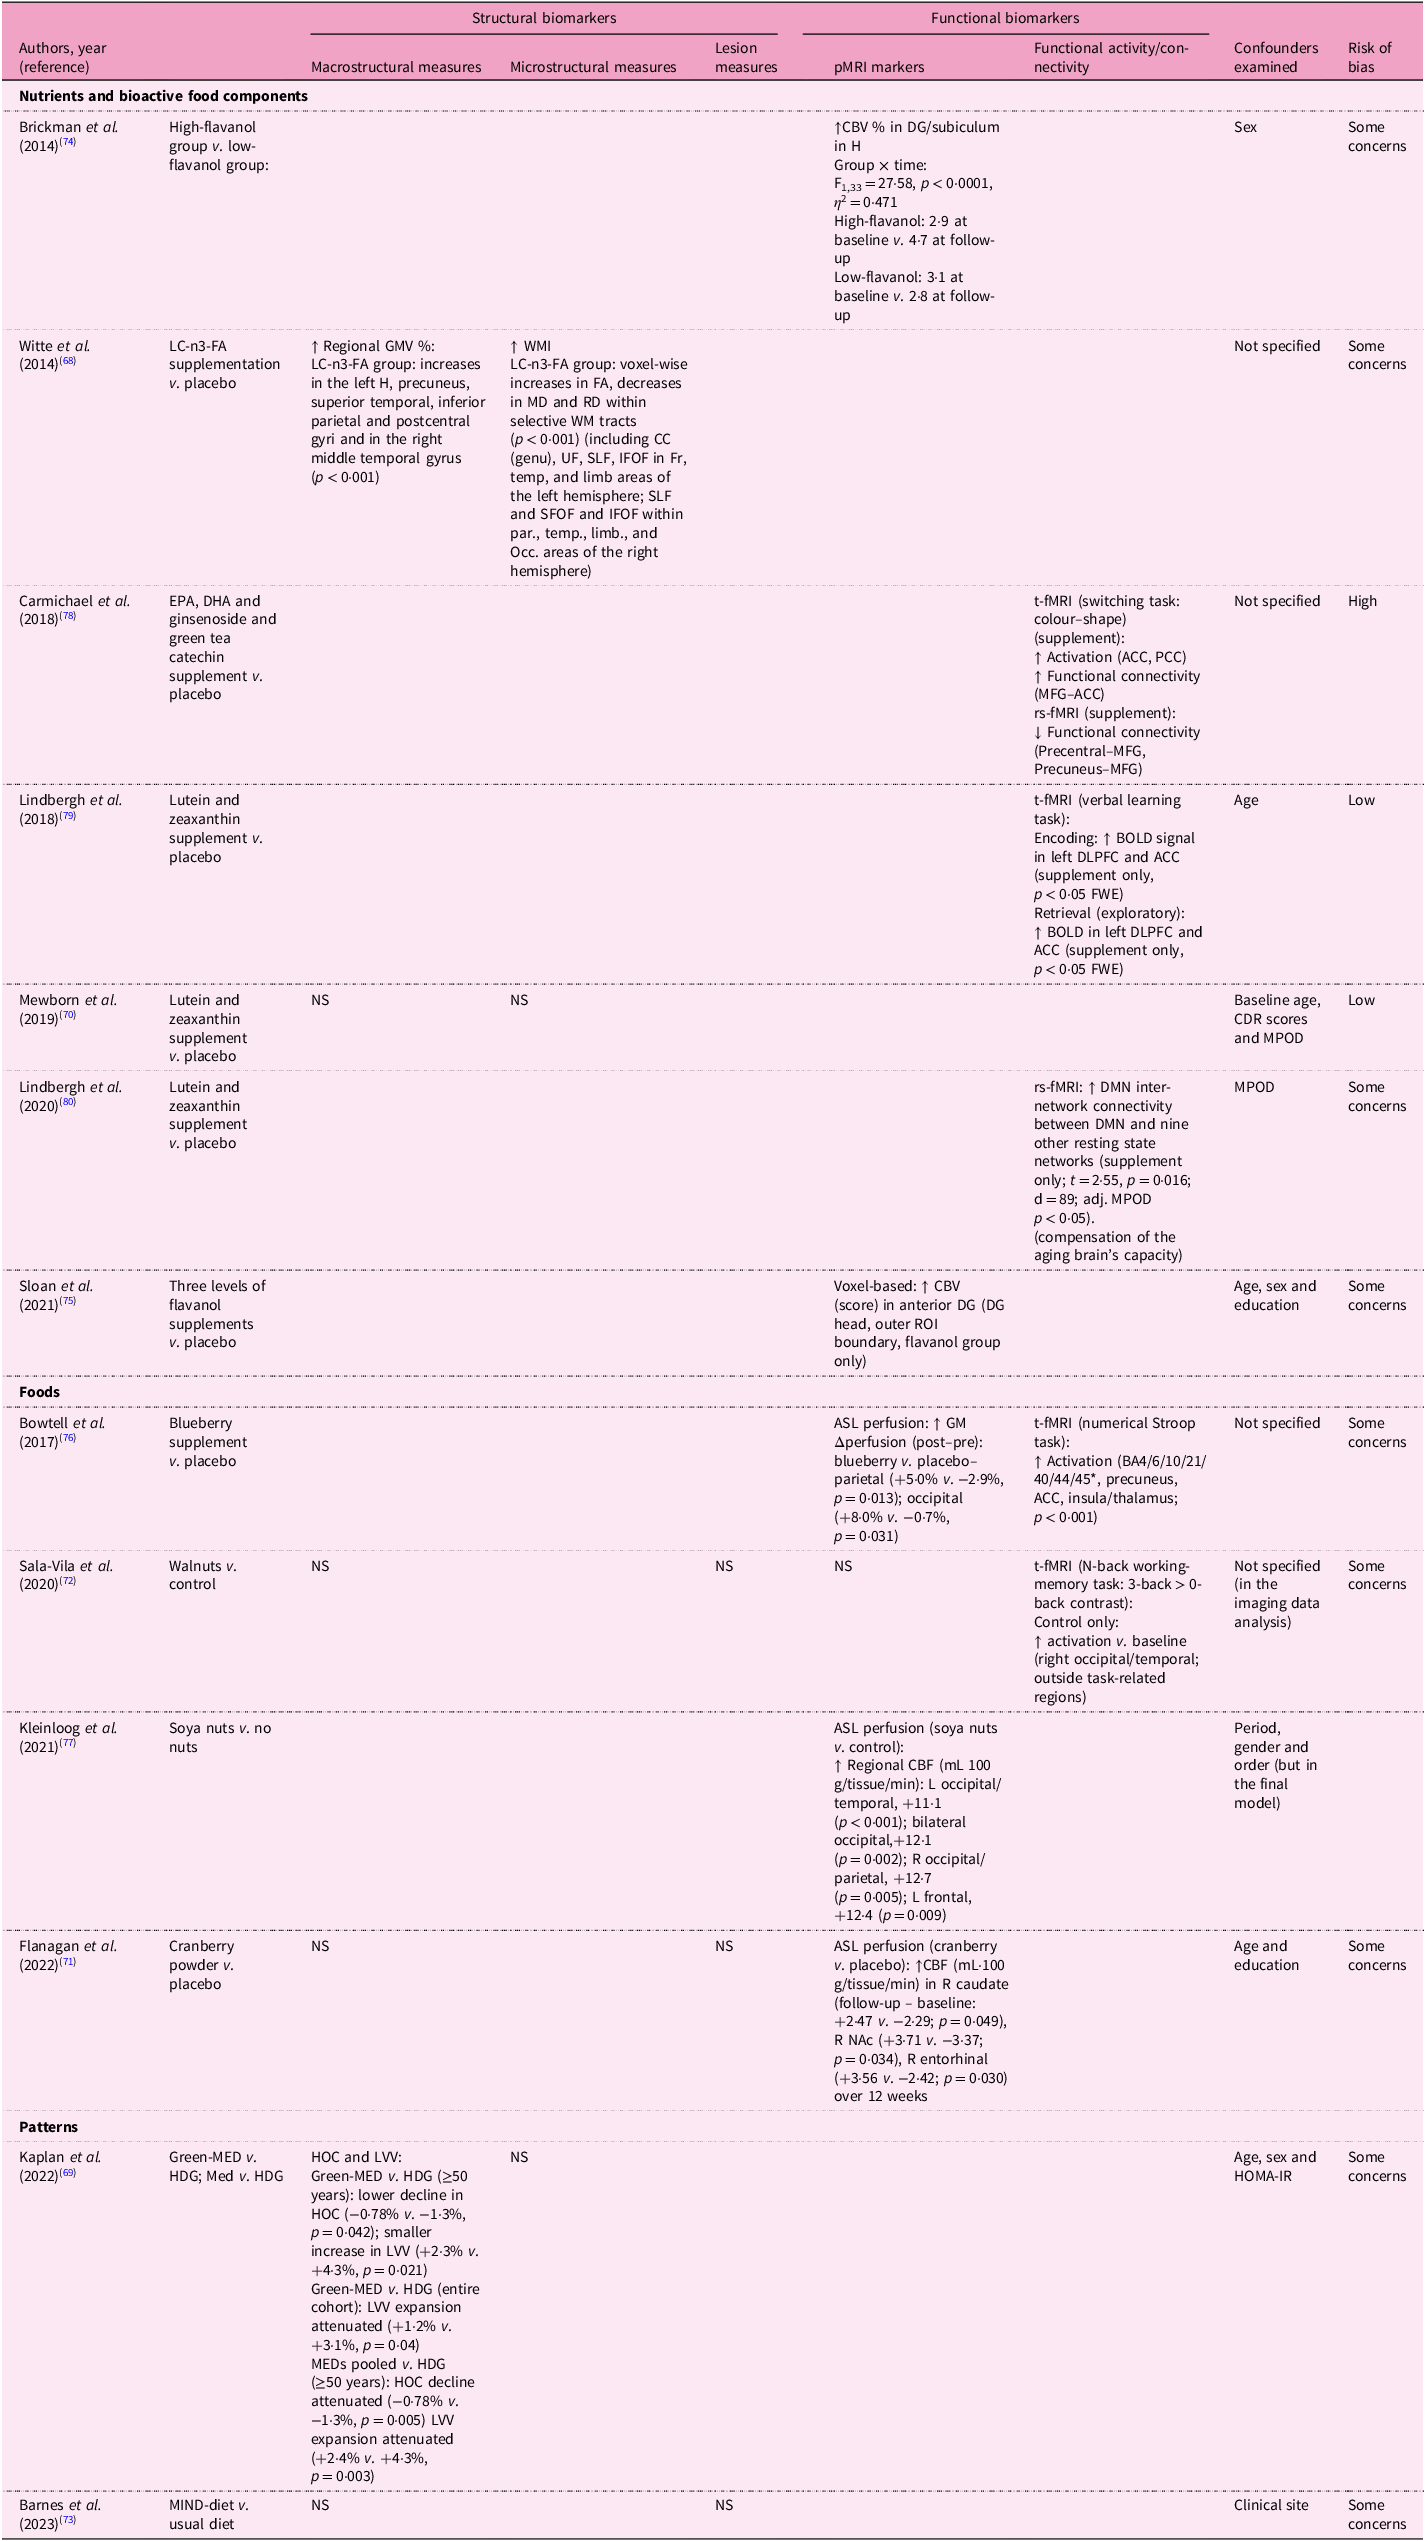
Table 9 demonstrates the effects of dietary interventions on structural MRI biomarkers. For macrostructural measures, only two of six studies showed beneficial associations: omega-3 fatty acids supplementation enhanced regional GMV(Reference Witte, Kerti, Hermannstadter, Fiebach, Schreiber and Schuchardt68), while the Green-MedDiet and pooled MedDiet improved hippocampal occupancy scores and reduced LVV expansion(Reference Kaplan, Zelicha, Yaskolka Meir, Rinott, Tsaban and Levakov69). Similarly, omega-3 supplementation was the sole intervention benefiting WMI among omega-3 and carotenoid studies(Reference Witte, Kerti, Hermannstadter, Fiebach, Schreiber and Schuchardt68,Reference Mewborn, Lindbergh, Hammond, Renzi-Hammond and Miller70) . No dietary interventions affected lesion measures(Reference Flanagan, Cameron, Sobhan, Wong, Pontifex and Tosi71–Reference Barnes, Dhana, Liu, Carey, Ventrelle and Johnson73). Cerebral perfusion showed more consistent improvements. High-flavanol cocoa enhanced hippocampal cerebral blood volume, particularly in the dentate gyrus (DG)(Reference Brickman, Khan, Provenzano, Yeung, Suzuki and Schroeter74,Reference Sloan, Wall, Yeung, Feng, Feng and Provenzano75) . Blueberry(Reference Bowtell, Aboo-Bakkar, Conway, Adlam and Fulford76), cranberry powder(Reference Flanagan, Cameron, Sobhan, Wong, Pontifex and Tosi71) and soya nut(Reference Kleinloog, Tischmann, Mensink, Adam and Joris77) supplementation enhanced regional blood flow. However, the MIND diet showed no significant effects on either CBV or structural measures(Reference Barnes, Dhana, Liu, Carey, Ventrelle and Johnson73). Functional connectivity demonstrated selective improvements. EPA/DHA/ginsenoside/green tea catechin supplementation increased activation in the anterior and posterior cingulate cortices and enhanced functional connectivity in the medial frontal gyrus (MFG) and anterior cingulate cortex during tasks(Reference Carmichael, Pillai, Shankapal, McLellan, Kay and Gold78), while lutein and zeaxanthin supplementation enhanced BOLD signals in the left dorsolateral prefrontal cortex and anterior cingulate cortex, as viewed on t-fMRI scans(Reference Lindbergh, Renzi-Hammond, Hammond, Terry, Mewborn and Puente79), and increased inter-network connectivity between DMN and other resting state networks on rs-fMRI scans(Reference Lindbergh, Lv, Zhao, Mewborn, Puente and Terry80) Similarly, blueberry and walnut supplementation enhanced functional activation in task-associated regions(Reference Sala-Vila, Valls-Pedret, Rajaram, Coll-Padros, Cofan and Serra-Mir72,Reference Bowtell, Aboo-Bakkar, Conway, Adlam and Fulford76) .
Table 9. Effects of dietary factors on MRI biomarkers in the interventional studies included in the systematic review

↑ indicates positive association; ↓ indicates negative association.
*BA stands for Brodmann area: BA4 (primary motor cortex), BA6 (premotor/supplementary motor area), BA10 (anterior prefrontal cortex), BA21 (middle temporal gyrus), BA40 (inferior parietal lobule) and BA44/45 (inferior frontal gyrus, Broca’s area).
pMRI, perfusion magnetic resonance imaging; fMRI, functional magnetic resonance imaging; CBV, cerebral blood volume; DG, dentate gyrus; H, hippocampus; LC-n3 FA, long chain-n3 fatty acid; GM(V), grey matter (volume); WM(I), white matter (integrity); FA, fractional anisotropy; MD, mean diffusivity; RD, radial diffusivity; CC (genu), corpus callosum, genu (anterior corpus callosum); UF, uncinate fasciculus; SLF, superior longitudinal fasciculus; SFOF, superior fronto-occipital fasciculus; IFOF, inferior fronto-occipital fasciculus; ILF, inferior longitudinal fasciculus; Fr, frontal lobe; Temp, temporal lobe; Par, parietal lobe; Limb, limbic areas; Occ, occipital lobe; t-fMRI, task-based fMRI; rs-fMRI, resting state-fMRI; ACC, anterior cingulate cortex; PCC, posterior cingulate cortex; MFG, medial frontal gyrus; ROIs, regions of interest; DMN, default mode network; BOLD, blood oxygenation level-dependent; NS, not significant; DLPFC, dorsolateral prefrontal cortex; FWE, family-wise error rate; CDR, clinical dementia rating scale; MPOD, macular pigment optical density; WMH, white matter hyperintensity; CBF, cerebral blood flow; L, left; R, right; NAc, nucleus accumbens; MED, Mediterranean diet; HDG, healthy dietary guidelines; HOC, hippocampal occupancy score; LVV, lateral ventricular volume; HOMA-IR, homeostasis model assessment of insulin resistance; MIND, Mediterranean-DASH Intervention for Neurodegenerative Delay.
Risk of bias
Most observational studies scored ‘good’ (n = 19 cross-sectional and n = 14 longitudinal analyses) or ‘fair’ (n = 3 cross-sectional) on quality assessment scales. A common limitation was not explicitly reporting the exclusion of critical conditions related to outcomes, such as stroke. Among intervention trials, even in double-blinded RCTs(Reference Witte, Kerti, Hermannstadter, Fiebach, Schreiber and Schuchardt68,Reference Flanagan, Cameron, Sobhan, Wong, Pontifex and Tosi71,Reference Brickman, Khan, Provenzano, Yeung, Suzuki and Schroeter74–Reference Bowtell, Aboo-Bakkar, Conway, Adlam and Fulford76,Reference Carmichael, Pillai, Shankapal, McLellan, Kay and Gold78) , all but three(Reference Mewborn, Lindbergh, Hammond, Renzi-Hammond and Miller70,Reference Lindbergh, Renzi-Hammond, Hammond, Terry, Mewborn and Puente79,Reference Lindbergh, Lv, Zhao, Mewborn, Puente and Terry80) raised concerns owing to a lack of clear descriptions of random number generation and allocation concealment.
Discussion
In this systematic review evaluating thirty-eight prospective cohort studies (twenty-three cross-sectional and fifteen longitudinal analyses) and thirteen interventional studies investigating associations between dietary factors (including blood dietary biomarkers) and brain MRI biomarkers in general populations, diet–MRI associations were heterogeneous. Across cross-sectional analyses, several dietary factors showed beneficial associations with MRI biomarkers; however, results were inconsistent and some opposite-direction signals were observed – for example, baked/broiled fish aligned with larger GM volumes (e.g. in hippocampus, β = 0·21), whereas oily fish/fish products were related to greater LVV and WMH, dairy products were linked to larger LVV and smaller MTLV, and tofu to higher ventricular grade. For dietary patterns, pro-inflammatory patterns were linked to smaller volumes and more silent infarcts (DII Q4 v. Q1, OR = 1·77), whereas diet-quality indices tended to favour larger volumes and lower lesion burden. However, the findings for MedDiet/MIND were mixed, circulating vitamin B12 showed no macrostructural associations, whereas homocysteine showed an adverse association. Longitudinal analyses demonstrated more consistent protective associations: though null results were common across multiple factors. Healthier patterns (e.g. vegetable-rich/prudent, greater diversity), green tea, specific fatty acids and higher plasma carotenoids/omega-3s were linked to structural preservation (slower atrophy): +100 mL/d green tea was related to a 0·024%/year slower decline in hippocampal volume ratio, a prudent pattern predicted a +203 mm3 4-year advantage in left hippocampal volume, and per one SD higher plasma carotenoid level, MTLV loss was 0·02 cm3/year smaller. Interventions showed limited structural benefits [in only two of six studies: long chain-n3-fatty acids (LC-n3); Green-Med/MedDiet], while polyphenol-rich supplements more often improved perfusion/functional metrics. Overall, clinically interpretable magnitudes centre on slower atrophy and fewer lesions with healthier diets/biomarkers, whereas cross-sectional signals require cautious interpretation given partial temporality.
Associations between dietary factors and MRI biomarkers
Overall, healthier exposures generally aligned with structural preservation, whereas pro-inflammatory profiles were associated with smaller brain volumes, greater ventricular enlargement and higher lesion burden, though directions varied by dietary factors and MRI biomarkers. For example, in the cross-sectional analyses, fish consumption showed contrasting results depending on type and preparation: baked/broiled fish was associated with larger GM volumes, including the hippocampus(Reference Raji, Erickson, Lopez, Kuller, Gach and Thompson36), whereas oily fish/fish products(Reference del C. Valdes Hernandez, Kyle, Allan, Allerhand, Clark and Munoz Manieg37), dairy products(Reference Pellay, Baillet, Helmer, Catheline, Marmonier and Samieri48) and tofu(Reference White, Petrovitch, Ross, Masaki, Hardman and Nelson47) were adversely associated with brain structural measures such as LVV, MTLV, ventricular grade and WMH. These findings from cross-sectional analyses of foods can be interpreted on the basis of the following possibilities: First, analyses focusing on individual foods may be problematic owing to the complexity of eating behaviours and inter-relationships among food items. Therefore, dietary pattern analysis has been suggested as a more appropriate approach to address these complexities(Reference Willett81). Second, the differential associations observed between baked/broiled fish (beneficial)(Reference Raji, Erickson, Lopez, Kuller, Gach and Thompson36) and oily fish/fish products (detrimental)(Reference del C. Valdes Hernandez, Kyle, Allan, Allerhand, Clark and Munoz Manieg37) suggest that cooking methods and fish species variability may be more critical determinants than fish consumption per se. Third, the association between dairy products and greater LVV(Reference del C. Valdes Hernandez, Kyle, Allan, Allerhand, Clark and Munoz Manieg37)/WMHV(Reference Song, Gaynor, Cruz, Lee, Gazes and Habeck56) and smaller MTLV(Reference Pellay, Baillet, Helmer, Catheline, Marmonier and Samieri48) requires careful interpretation within the context of population-specific dietary patterns and dairy processing methods. The high fat and saturated fatty acid content of dairy has been suggested as a possible explanation(Reference del C. Valdes Hernandez, Kyle, Allan, Allerhand, Clark and Munoz Manieg37,Reference Pellay, Baillet, Helmer, Catheline, Marmonier and Samieri48) , as these components are known to induce metabolic, inflammatory and microvascular changes(Reference Wang, Norman, Srinivasan and Rutledge82,Reference Woo, Botta, Shi, Paus and Pausova83) . However, beneficial effects of dairy in other regions (WMV and the occipital and temporal volume, all p-values <0.05, although not <0.007 of Bonferroni-corrected significance level)(Reference Lee, Kim and Shin55) indicates that the association of dairy with neural health cannot be conclusively attributed to the influence of fats. Notably, this beneficial association was observed only in Korean populations, whose traditional diet includes little dairy. Thus, the role of dairy products should be interpreted in the context of cultural dietary practices, particularly in populations with traditionally low dairy consumption(Reference Mente, Dehghan, Rangarajan, O’Donnell, Hu and Dagenais84). Fourth, the association between tofu consumption and increased ventricular grade among Japanese men led authors to hypothesise soya isoflavone-mediated pathways involving tyrosine kinase inhibition or oestrogenic interference(Reference White, Petrovitch, Ross, Masaki, Hardman and Nelson47). However, these proposed mechanisms remain speculative, as oestrogen-related pathways are poorly understood in men, and evidence linking endogenous oestrogen to cognitive function is inconsistent. Moreover, the hypothesis of soya-induced hippocampal tyrosine kinase inhibition and impaired long-term potentiation still requires further substantiation(Reference Grodstein, Mayeux and Stampfer85).
Key cognitive regions such the frontal, temporal, hippocampal and parietal cortices are central to executive function, episodic memory and attentional control, and their early vulnerability makes them critical indicators of brain ageing and dementia risk(Reference Kramer, Rosen, Du, Schuff, Hollnagel and Weiner86). Evidence linking omega-3 fatty acids and their source foods such as fish, flavonoids and high-quality dietary patterns (e.g. MedDiet, prudent and AHEI) to greater preservation of these regions(Reference Raji, Erickson, Lopez, Kuller, Gach and Thompson36,Reference Chen, Xun, Kaufman, Hayden, Espeland and Whitsel45,Reference Gardener, Scarmeas, Gu, Boden-Albala, Elkind and Sacco52,Reference Tokuda, Horikawa, Nishita, Nakamura, Kato and Kaneda54–Reference Song, Gaynor, Cruz, Lee, Gazes and Habeck56,Reference Otsuka, Nishita, Nakamura, Kato, Iwata and Tange59,Reference Samieri, Maillard, Crivello, Proust-Lima, Peuchant and Helmer61,Reference Witte, Kerti, Hermannstadter, Fiebach, Schreiber and Schuchardt68) suggests that diet may be directly associated with neural substrates of cognition. Longitudinal findings further highlight clinically meaningful magnitudes – slower hippocampal decline with green tea (∼0·024%/year slower decline in HV ratio per +100 mL/d)(Reference Zhang, Otsuka, Nishita, Nakamura, Kato and Iwata57), hippocampal volume preservation with prudent dietary patterns (+203 mm3 over 4 years in left HV)(Reference Jacka, Cherbuin, Anstey, Sachdev and Butterworth58) and reduced temporal lobe atrophy with higher plasma carotenoids (∼0·02 cm3/year less MTLV loss per one SD)(Reference Thomas, Proust-Lima, Baillet, Helmer, Delcourt and Foubert-Samier63).
Beyond global macrostructural indices, more sensitive MRI biomarkers provide additional insights into how diet influences brain ageing. Microstructural integrity, reflecting WM connectivity, underpins processing speed and executive function; its preservation with MedDiet(Reference Pelletier, Barul, Feart, Helmer, Bernard and Periot39), HEI(Reference Guan, Cheng, Bellomo, Narain, Bigornia and Garelnabi32), ‘PUFA and vitamin E’ pattern(Reference Gu, Vorburger, Gazes, Habeck, Stern and Luchsinger50), and omega-3 fatty acid intake(Reference Tsiknia, Bergstrom and Reas49) and supplementation(Reference Witte, Kerti, Hermannstadter, Fiebach, Schreiber and Schuchardt68) indicated better WM connectivity (increased restricted diffusion: high FA and low MD)(Reference Bennett and Madden27,Reference Reddan, Macpherson, White, Choley and Pipingas28) . Serum vitamin D and folate levels with increased WHI(Reference Beydoun, Shaked, Hossain, Beydoun, Katzel and Davatzikos46) further suggest a protective role against demyelination(Reference Reddan, Macpherson, White, Choley and Pipingas28). Lesion measures, such as WMH and subclinical infarcts, were generally lower in individuals adhering to healthier dietary profiles closely tied to dietary factors. MedDiet and its component (vegetable)(Reference Gardener, Scarmeas, Gu, Boden-Albala, Elkind and Sacco52,Reference Song, Gaynor, Cruz, Lee, Gazes and Habeck56) flavonoids(Reference Shishtar, Rogers, Blumberg, Au, Decarli and Jacques51) were associated with WMH. However, it is noteworthy that no significant associations with structural measures or WMH were observed after a 3-year MIND diet intervention(Reference Barnes, Dhana, Liu, Carey, Ventrelle and Johnson73), despite the MIND diet being a hybrid of the DASH, and the MedDiet and incorporating components that are putatively protective against Alzheimer’s disease(Reference Morris10). Perfusion studies provide mechanistic clues: polyphenol-rich interventions (e.g. high-flavanol cocoa, blueberries and soya) enhanced hippocampal and cortical blood flow(Reference Brickman, Khan, Provenzano, Yeung, Suzuki and Schroeter74,Reference Bowtell, Aboo-Bakkar, Conway, Adlam and Fulford76,Reference Kleinloog, Tischmann, Mensink, Adam and Joris77) , supporting vascular pathways as a mediator of diet–brain links. While structural connectivity refers to the WM pathways between regions, functional connectivity refers to the node-to-node interactions between neurophysiologically active regions(Reference Liu, Tyler, Cam, Davis, Rowe and Tsvetanov87). Functional MRI studies also revealed that dietary interventions with antioxidants could enhance functional connectivity(Reference Sala-Vila, Valls-Pedret, Rajaram, Coll-Padros, Cofan and Serra-Mir72,Reference Bowtell, Aboo-Bakkar, Conway, Adlam and Fulford76,Reference Carmichael, Pillai, Shankapal, McLellan, Kay and Gold78,116) . In some fMRI biomarker studies, findings did not support the initial hypothesis that carotenoids (lutein and zeaxanthin) enhance neural efficiency, which refers to a more efficient allocation of neural resources(Reference Lindbergh, Renzi-Hammond, Hammond, Terry, Mewborn and Puente79,Reference Lindbergh, Lv, Zhao, Mewborn, Puente and Terry80) . Instead, these studies suggest that lutein and zeaxanthin support the ageing brain’s compensatory mechanisms by enhancing integration between neural networks(Reference Lindbergh, Lv, Zhao, Mewborn, Puente and Terry80).
Possible mechanisms
Multiple plausible mechanisms may underlie the associations between dietary factors and MRI biomarkers, including oxidative stress, neuroinflammation, neurogenesis, synaptic plasticity and vascular integrity. The brain’s high metabolic load and high content of polyunsaturated fatty acids in its cell membranes(Reference Esposito, Rotilio, Di Matteo, Di Giulio, Cacchio and Algeri88) make it particularly vulnerable to oxidative stress(Reference Kim, Kim, Rhie and Yoon89,Reference Dash, Bhol, Swain, Samal, Nayak and Raina90) . Oxidative stress contributes to cellular damage, but vitamins C and E, carotenoids, flavonoids (e.g. polyphenols and isoflavones), omega-3 fatty acids, and foods and dietary patterns, such as the MedDiet, with a high antioxidant capacity may neutralise these effects and protect the brain(Reference Durazzo, Mattsson and Weiner91,Reference Lobo, Haase and Brandhorst92) . Neuroinflammation, often triggered by oxidative stress, promotes pathogenic brain changes, including reduced synaptic plasticity and neurogenesis(Reference Lobo, Haase and Brandhorst92–Reference Cutuli95). Dietary factors may also modulate brain health by maintaining mitochondrial function, vascular integrity and membrane permeability.
Omega-3 fatty acids are involved in several neurological mechanisms. In addition to antioxidative effects, they play a critical role through pathways such as axonal myelination, synaptic transmission(Reference Di Miceli, Bosch-Bouju and Laye96) and regulation of microglial function(Reference Laye, Nadjar, Joffre and Bazinet97,Reference Martin, Debenay, Bardinet, Peltier, Pourtau and Gaudout98) , which collectively enhance neurogenesis and hinder neuroinflammation. Moreover, omega-3 fatty acids optimise membrane fluidity and potentiate neurotrophic factors such as brain-derived neurotrophic factor (BDNF)(Reference Sohouli, Rohani, Nasehi and Hekmatdoost99), which promotes neuronal growth in key regions such as the hippocampus(Reference Feher, Juhasz, Rimanoczy, Kalman and Janka100,Reference Berchtold, Chinn, Chou, Kesslak and Cotman101) . Polyphenols similarly enhance synaptic plasticity and hippocampal neurogenesis, protecting against cognitive decline(Reference Kennedy102). The hippocampus, a critical centre for learning, memory and mood regulation, and is notably responsive to environmental factors such as diet(Reference Cutuli95). Green tea rich in epigallo-catechin-3-gallate (a flavan-3-ol) may help suppress hippocampal atrophy, although the mechanisms remain unclear(Reference Zhang, Otsuka, Nishita, Nakamura, Kato and Iwata57). Neurovascular health is also impacted by diet; for instance, polyphenol-rich diets. High flavanol cocoa and blueberry supplementation improved perfusion in regions such as the occipital and parietal lobes, supporting visual and cognitive function(Reference Brickman, Khan, Provenzano, Yeung, Suzuki and Schroeter74,Reference Bowtell, Aboo-Bakkar, Conway, Adlam and Fulford76) . This enhancement of brain perfusion is critical for sustaining cognitive performance in ageing populations as reduced cerebral blood flow (CBF) is an early marker of neurodegeneration(Reference Korte, Nortley and Attwell103). Several vitamins contribute to brain health. Vitamin E attenuates axonal degeneration and promotes remyelination(Reference Pelletier, Barul, Feart, Helmer, Bernard and Periot39,Reference Goudarzvand, Javan, Mirnajafi-Zadeh, Mozafari and Tiraihi104) , while vitamin D influences cognitive function through its role in immune modulation and neuroinflammation(Reference Karakis, Pase, Beiser, Booth, Jacques and Rogers105). Vitamin B12 and folate regulate homocysteine metabolism, and deficiencies in these vitamins are linked to WM damage and brain atrophy via impaired S-adenosymethione(Reference Hooshmand, Solomon, Kareholt, Leiviska, Rusanen and Ahtiluoto106). Conversely, elevated total homocysteine (tHcy) is associated with endothelial dysfunction and increased brain ageing(Reference Hooshmand, Solomon, Kareholt, Leiviska, Rusanen and Ahtiluoto106). High-fat diets rich in saturated and trans-fatty acids may adversely impact brain plasticity and neuroprotection, particularly in the hippocampus, by increasing inflammatory markers and tau phosphorylation(Reference Durazzo, Mattsson and Weiner91,Reference Granholm, Bimonte-Nelson, Moore, Nelson, Freeman and Sambamurti107) . Meat and meat products, major sources of these fatty acids, have been linked to negative effects on brain structure in experimental models(Reference Granholm, Bimonte-Nelson, Moore, Nelson, Freeman and Sambamurti107). These findings highlight the dual role of dietary factors in promoting or impeding brain health depending on the composition and quality of the diet.
Limitations and strengths
This systematic review has several limitations that should be acknowledged. First, most observational studies relied on self-reported dietary assessments, such as FFQs or 24-h recalls, which are inherently prone to recall bias. Error magnitude varies by method: single recalls inadequately capture habitual intake, whereas multiple recalls or validated tools better reflect usual diet(Reference Willett81). To address these limitations, reducing dietary measurement error through calibration, repeated assessments and incorporation of objective biomarkers remains a key priority(Reference Willett81,Reference Gormley, Bai and Brennan108) . Second, substantial methodological heterogeneity was observed across studies, limiting comparability and clinical translation. This heterogeneity encompassed inconsistent ICV adjustment and unit reporting, divergent region of interest (ROI) definitions, non-standardised lesion metrics, variations in MRI field strengths and image-processing pipelines, and multi-site batch effects. Although residual ICV adjustment is generally recommended over raw or proportional methods(109,110), it can be less intuitive and model-dependent. In this review, most studies reported results as %ICV or in clinically interpretable units, such as −0·024%/year HV decline per 100 mL/d green tea(Reference Zhang, Otsuka, Nishita, Nakamura, Kato and Iwata57), +203 mm3 HV preservation over 4 years with a prudent diet(Reference Jacka, Cherbuin, Anstey, Sachdev and Butterworth58), and −0·02 cm3/year MTLV loss per one SD plasma carotenoids(Reference Thomas, Proust-Lima, Baillet, Helmer, Delcourt and Foubert-Samier63). Standardised approaches are also needed for WMH quantification (e.g. STRIVE criteria(Reference Duering, Biessels, Brodtmann, Chen, Cordonnier and de Leeuw111)) and for reporting reproducibility indices such as test–retest reliability and minimal detectable change(Reference Lewis, Myers, Heiser, Kolar, Baird and Stewart112). Third, we attempted to indirectly compare findings from relatively younger cohorts (mean age <60 years, n = 10) with those from older cohorts (≥60 years, n = 41); however, the small number of younger cohorts and substantial heterogeneity across studies limited the feasibility of direct comparisons. In addition, intervention studies were generally short in duration (often <1 year), which may not adequately capture the long-term effects of diet on brain health. Fourth, many studies also lacked transparency in reporting methodological details, such as randomisation procedures, allocation concealment and dropout rates, raising concerns about potential biases and result reliability. In addition, relatively small sample sizes and the absence of formal power calculations limited statistical power and increased the likelihood of type II errors, complicating the interpretation of null results.
Despite these limitations, this systematic review has several notable strengths such as a comprehensive synthesis across dietary factors, MRI biomarkers and study designs, offering a foundation for future standardised and adequately powered investigations.
Recommendations for future research
Future research should aim to address the identified limitations and build upon the findings of this review. First, longitudinal studies with extended follow-up periods and repeated assessments of dietary intake and MRI biomarkers are needed to better capture long-term effects and establish causal relationships. Cohort studies that integrate MRI, dietary patterns and cognitive outcomes over decades will provide a more robust understanding of the temporal dynamics of diet and brain health. Second, the standardisation of dietary assessment tools and MRI protocols is essential. Consistent use of validated dietary measures and harmonised imaging sequences across studies will enhance comparability and improve the reliability of findings. Furthermore, the integration of existing biomarkers – such as serum levels of omega-3 fatty acids, vitamins and flavonoids – can complement self-reported methods and help reduce measurement error(Reference Zwilling, Talukdar, Zamroziewicz and Barbey113), although the number of currently available dietary biomarkers is limited, and suitable objective markers do not exist for many dietary components. Therefore, continued efforts to identify and validate novel biomarkers are warranted to advance the field of nutritional neuroepidemiology. Third, future studies should prioritise diverse and under-represented populations to improve the generalisability of findings. As previously noted(Reference Jensen, Leoni, Klein-Flugge, Ebmeier and Suri25), studies have predominantly focused on the USA and European countries, highlighting the urgent need for research in Asia, where the elderly population is rapidly increasing. Genetic factors, such as the APOE genotype, were not the focus of this review; however, it is likely to modify the impact of dietary factors on brain structure and function. Therefore, gene–diet interactions will provide valuable insights into precision nutrition strategies for brain health. In addition, longer and more personalised intervention trials are needed to evaluate the cumulative effects of dietary changes, focusing on structural, functional and cerebrovascular outcomes.
Conclusions
This systematic review suggests that dietary factors with antioxidant and anti-inflammatory properties, such as omega-3 fatty acids and the Mediterranean diet, may be associated with beneficial brain health outcomes. Longitudinal and intervention studies showed more consistent patterns than cross-sectional analyses. Nevertheless, inconsistent findings highlight the need for further research to confirm these associations and inform preventive strategies for maintaining brain health. At present, the evidence remains insufficient for clinical translation, and findings from cross-sectional analyses – even when derived from prospective cohorts – should be interpreted with caution.
Supplementary material
The supplementary material for this article can be found at https://doi.org/10.1017/S0954422425100267.
Acknowledgements
None.
Financial support
This research received no specific grant from any funding agency in the commercial or not-for-profit sector.
Competing interests
All authors declare no competing interest.
Authorships
Conceptualisation: Kim M.K. and Kwon B.J. Data curation: Hong J.Y., Kim J.E. and Kim H.C. Formal analysis: Kim M.K. and Kwon B.J. Methodology: Kim M.K., Kwon B.J., Kim Y.M., Kim H.C. and Lee J.M. Writing – original draft: Kim M.K. Writing – review and editing: Kwon B.J.


 Open access