


Statement of Research Significance
Research Question(s) or Topic(s): The current study investigated whether a set of proposed triggers (setting, company, effort, activity dissatisfaction, negative affect) and resources (processing speed, fatigue, sleep quality) relate to sensory burden in the daily life of individuals with acquired brain injury. Main Findings: Momentary fluctuations in sensory burden vary in severity and variability across individuals. Negative affect, activity dissatisfaction, high effort, being in company, slower processing speed, and fatigue are associated with sensory burden. Study Contributions: By quantitatively capturing moment-to-moment fluctuations in sensory burden, the study provides evidence for the dynamic nature of these experiences and illustrates a high level of heterogeneity in sensory burden in terms of both severity and frequency. Ultimately, the findings highlight the importance of maintaining a within-person approach to fully capture the complexity of sensory burden following acquired brain injury.
Rationale
Acquired brain injury (ABI) can lead to impairments in a variety of domains, including motor and cognitive functioning (Corrigan et al., Reference Corrigan, Wee and Collins-Praino2023; Einstad et al., Reference Einstad, Saltvedt, Lydersen, Ursin, Munthe-Kaas, Ihle-Hansen, Knapskog, Askim, Beyer, Næss, Seljeseth, Ellekjær and Thingstad2021; Rabinowitz & Levin, Reference Rabinowitz and Levin2014), as well as in the processing of sensory information. In particular, growing attention, clinically and scientifically, is being directed toward sensory hypersensitivity, defined as an increased sensitivity to sensory stimuli, commonly reported in individuals with ABI (Thielen et al., Reference Thielen, Tuts, Welkenhuyzen, Huenges Wajer, Lafosse and Gillebert2022). ABI patients often describe this hypersensitivity as having emerged post-injury, significantly affecting various aspects of their daily lives, such as physical, psychological, and social well-being (De Sain et al., Reference De Sain, Pellikaan, Van Voskuilen, Migdis, Sommers-Spijkerman, Visser-Meily and Huenges Wajer2024). In a systematic review, Thielen et al. (Reference Thielen, Tuts, Welkenhuyzen, Huenges Wajer, Lafosse and Gillebert2022) highlight that sensory hypersensitivity after ABI occurs in relation to a variety of sensory inputs – from auditory, visual, gustatory, olfactory, tactile, vestibular, and multisensory sources – however, with high intra-individual differences. Large heterogeneity can be observed among the severity, contributing factors, and implications of sensory hypersensitivity after ABI (Marzolla et al., Reference Marzolla, Thielen, Hurks, Borghans and Van Heugten2023; Rabinowitz & Fisher, Reference Rabinowitz and Fisher2020; Truong et al., Reference Truong, Ciuffreda, Han and Suchoff2014), mainly due to its dynamic nature. For instance, individuals differ in the extent to which sensory hypersensitivity affects their daily living and which situations trigger it. To investigate this further, insight into the momentary experience of sensory hypersensitivity is needed. There is currently no standardized English terminology for this phenomenon (in the Dutch language, framed as “Overprikkeling” or “Last van prikkels”). Therefore, in the current study, we propose to utilize the term “sensory burden,” reflecting a negative connotation or “burden” in the momentary presence of sensory stimuli.
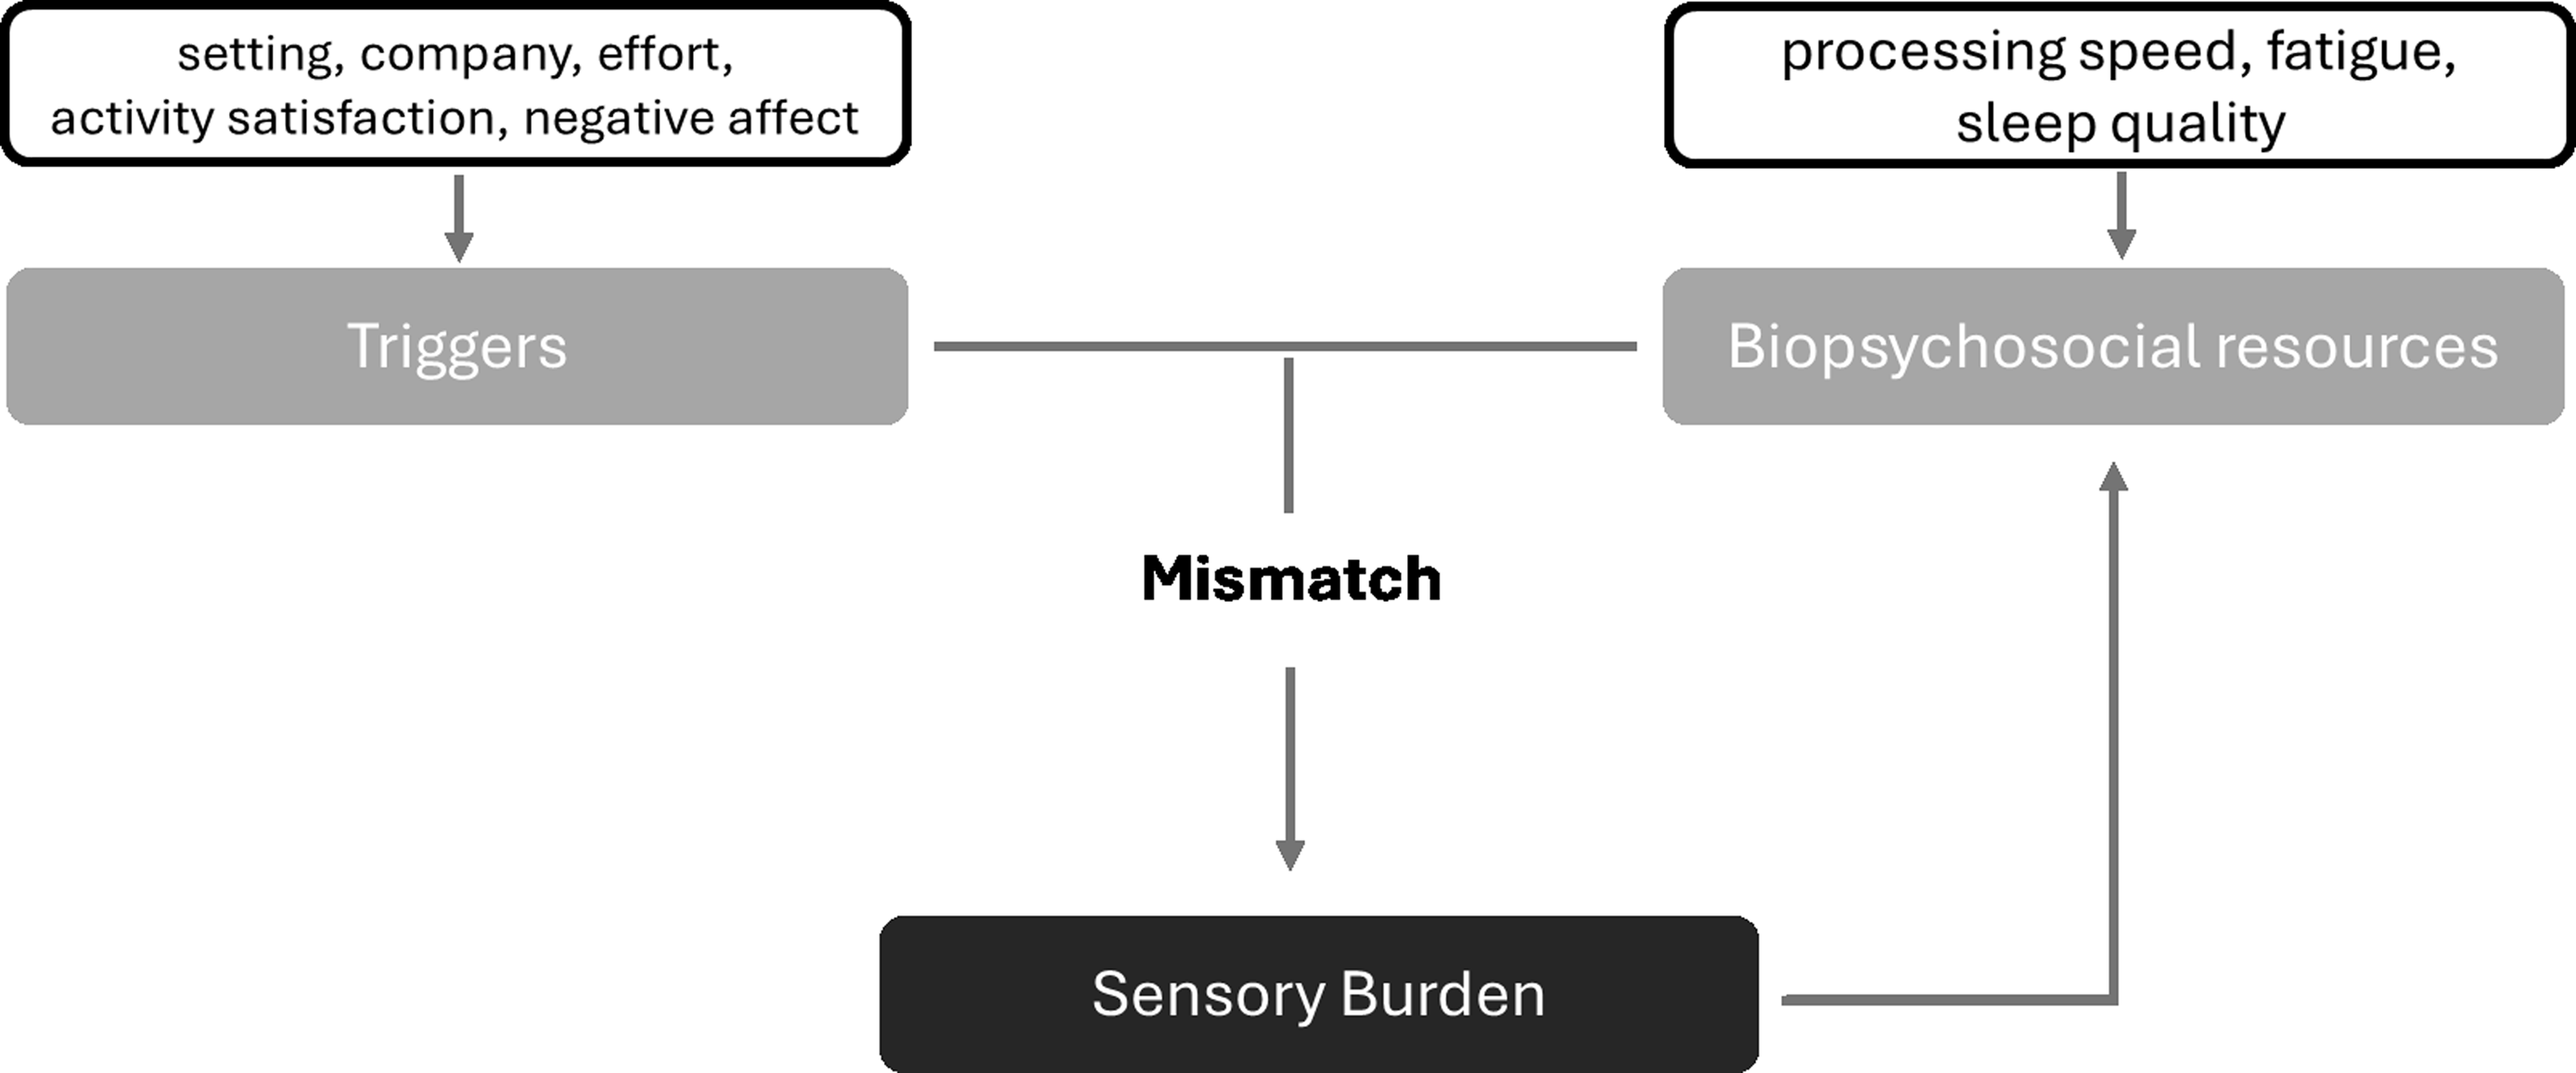
Based on interviews with ABI patients, Marzolla et al. (Reference Marzolla, Thielen, Hurks, Borghans and Van Heugten2023) described sensory burden as a two-fold problem and developed a theoretical model that conceptualizes it as a dynamic interaction between situational triggers and an individual’s available biopsychosocial resources (Figure 1).

Figure 1. A theoretical model for the underlying mechanism of sensory burden. Note. Adapted for the current study from Marzolla et al. (Reference Marzolla, Thielen, Hurks, Borghans and Van Heugten2023).
These interviews revealed how ABI patients experience moments of sensory hypersensitivity as a mismatch between internal triggers (such as stress and pain) and external triggers (such as multisensory environments) on the one hand and a deficit of resources (such as energy levels) on the other hand, also shown in other literature (Aron & Aron, Reference Aron and Aron1997; Bas et al., Reference Bas, Kaandorp, De Kleijn, Braaksma, Bakx and Greven2021; Costa-López et al., Reference Costa-López, Ferrer-Cascales, Ruiz-Robledillo, Albaladejo-Blázquez and Baryła-Matejczuk2021; Paunović et al., Reference Paunović, Jakovljević and Belojević2009; Scheydt et al., Reference Scheydt, Müller Staub, Frauenfelder, Nielsen, Behrens and Needham2017). As explained by the theoretical model, these situational triggers demand varying levels of resources, and sensory burden may occur when an individual’s resources are insufficient to meet them. The presence or absence of sufficient biopsychosocial resources may protect an individual from situations leading to sensory burden or, contrarily, induce them (De Sain et al., Reference De Sain, Pellikaan, Van Voskuilen, Migdis, Sommers-Spijkerman, Visser-Meily and Huenges Wajer2024; Landon et al., Reference Landon, Shepherd, Stuart, Theadom and Freundlich2012). Specifically, lower energy levels (e.g., due to higher fatigue) could lead to heightened experienced sensory burden by depleting biopsychosocial resources (De Sain et al., Reference De Sain, Pellikaan, Van Voskuilen, Migdis, Sommers-Spijkerman, Visser-Meily and Huenges Wajer2024; Faber et al., Reference Faber, Maurits and Lorist2012; Marzolla et al., Reference Marzolla, Thielen, Hurks, Borghans and Van Heugten2023).
While there have been numerous studies investigating the consequences of sensory burden, or more broadly, sensory hypersensitivity (for a review, see Thielen et al., (Reference Thielen, Tuts, Welkenhuyzen, Huenges Wajer, Lafosse and Gillebert2022)), to date, there is very little information about the effects of specific triggers. In an experimental set-up, Marzolla, Borghans, et al. (Reference Marzolla, Borghans, Ebus, Gwiazda, van Heugten and Hurks2024) identified negative effects of three situational triggers on sensory burden, including the presence of loud noise, time pressure, and high cognitive load. Additionally, studies showed effects of real-life sensory stimulation on cognitive performance in stroke survivors (Kerckhoffs et al., Reference Kerckhoffs, Marzolla, Lytrokapi, Wendker, Thielen, Gillebert, Winkens and Blokland2024) as well as non-ABI individuals with high levels of sensory hypersensitivity (Sandrock et al., Reference Sandrock, Schütte and Griefahn2009).
Due to the fact that sensory burden is per definition situation and stimulus-dependent, ecologically valid approaches are needed to explore the mechanisms behind it. Next to the importance of ecologically valid measurement paradigms, moment-to-moment assessments are crucial for understanding the interaction between situational triggers, biopsychosocial resources, and sensory burden after ABI. Sensory burden is momentary and has been suggested to fluctuate over time (Rabinowitz & Fisher, Reference Rabinowitz and Fisher2020), which could be due to changes in factors such as processing speed, fatigue, and situational triggers. By employing moment-to-moment assessments, such as the experience sampling method (ESM), these dynamic changes can be captured in real time. ESM is a digital self-monitoring approach that prompts repeated assessments in real-time, providing detailed insights into momentary factors and intra-individual variability.
Therefore, this study aimed to deepen the understanding of sensory burden by evaluating it within individuals’ natural environments and capturing moment-to-moment fluctuations alongside information on situational triggers and resources, thereby validating the proposed theoretical model in a sample of ABI patients. These insights can enhance the understanding of sensory burden post-ABI and offer valuable direction for future treatment initiatives. Hence, the primary research question encompassed the investigation of whether a set of proposed triggers (setting, company, effort, activity dissatisfaction, negative affect) and resources (processing speed, fatigue, sleep quality) relate to sensory burden in the daily life of individuals with ABI (Figure 1). Secondarily, it was investigated whether interactions between triggers and resources further explain variability in sensory burden. We expect that the presence of situational triggers (being away from home, being in the company of others, low activity satisfaction, and high negative affect) are negatively associated with sensory burden. We also expect that depleted resources (low processing speed, high fatigue, and low sleep quality) are associated with higher sensory burden. We further expect to find evidence for interaction effects between the proposed triggers on the one hand and resources on the other hand, such that higher levels of triggers in combination with lower levels of resources will be associated with greater sensory burden.
Materials and methods
This study was part of a larger prospective, observational study on cognition of daily life after brain injury. Ethical approval for this study was received from the medical ethics committee of Maastricht University and Maastricht University Medical Centre (METC 2022-3570). This study was conducted in accordance with the guidelines of the Helsinki Declaration.
Participants
The study involved individuals who had sustained an ABI. To be included in the study, participants were required to be at least 18 years of age, have a medically confirmed diagnosis of ABI (either from a traumatic brain injury or a non-traumatic cause such as stroke), demonstrate good comprehension of the Dutch language, own and be proficient in using a smartphone, and be willing and able to provide informed consent. Exclusion criteria included a diagnosis of a neurodegenerative disease, uncorrectable visual impairments, and being clinically admitted to a hospital or rehabilitation center during the study period.
Measurements
Several baseline assessments were conducted for this study, including demographic details (age, gender, education, living situation) and injury-related information (type of injury, time since injury, prior ABI, hospital admissions, length of hospital stay, and discharge destination). Momentary data was collected using the m-Path app, an application designed for experience sampling, at 7 semi-random intervals each day over 7 consecutive days (Mestdagh et al., Reference Mestdagh, Verdonck, Piot, Niemeijer, Kilani, Tuerlinckx, Kuppens and Dejonckheere2023).
Momentary self-report
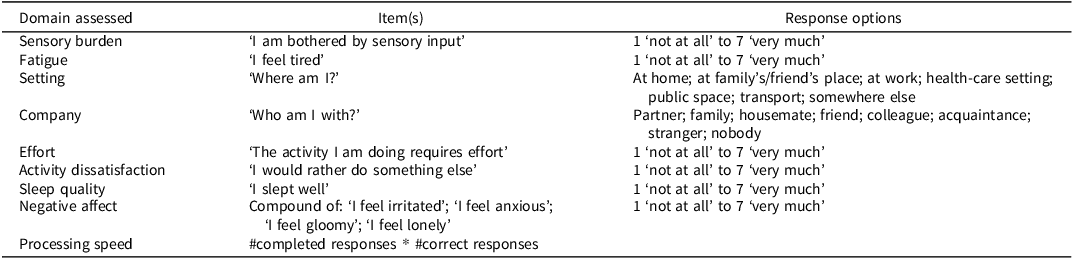
Participants provided real-time reports on their sensory burden, fatigue, setting, company, effort, activity dissatisfaction, and negative affect. These measures were drawn from a standard ESM protocol that assessed mood, physical condition, cognitive complaints, and surroundings (Verhagen et al., Reference Verhagen, Daniëls, Bartels, Tans, Borkelmans, de Vugt, Delespaul and Muñoz-Moreno2019). The item on sensory burden was created based on previous studies (Houtveen & Sorbi, Reference Houtveen and Sorbi2013; Jafari et al., Reference Jafari, Copps, Hole, Nyatepe-Coo, Kolb and Mohajerani2022; Marzolla, Borghans, et al., Reference Marzolla, Borghans, Ebus, Gwiazda, van Heugten and Hurks2024; Zhang et al., Reference Zhang, Zhou, Kwan, Su and Lu2020). Sensory burden, fatigue, effort, activity dissatisfaction, and negative affect were rated on a 7-point Likert scale, while setting and company were evaluated through multiple-choice questions. Self-reported sleep quality, also rated on a 7-point Likert scale, was gathered from a morning questionnaire completed once daily. Details of all items and response options can be found in Table 1.
Table 1. Momentary items and response options

Momentary processing speed
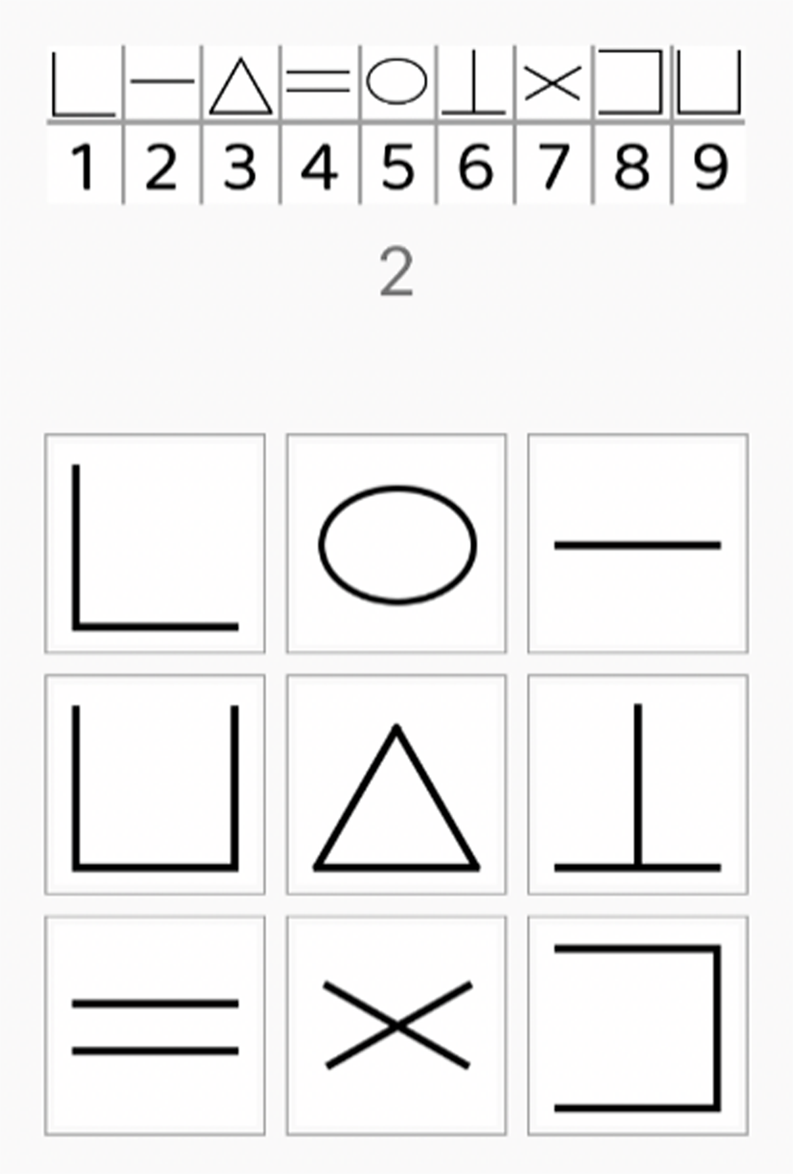
The momentary Digit Symbol Substitution Task (mDSST) was used to assess processing speed in daily life (Daniëls et al., Reference Daniëls, Bartels, Verhagen, Van Knippenberg, De Vugt and Delespaul2020). This task is a digital, 30-second adaptation of the original pen-and-paper Digit Symbol Substitution Task (Wechsler, Reference Wechsler2008), and it has demonstrated sensitivity to both within-person and between-person variability (Daniëls et al., Reference Daniëls, Bartels, Verhagen, Van Knippenberg, De Vugt and Delespaul2020; Verhagen et al., Reference Verhagen, Daniëls, Bartels, Tans, Borkelmans, de Vugt, Delespaul and Muñoz-Moreno2019). Figure 2 illustrates how the mDSST was displayed in the m-Path app on participants’ smartphones. At the top of the screen, numbers 1 to 9 were shown, each paired with a corresponding symbol. Below, numbers 1 to 9 were presented randomly and one at a time. Participants had to select the correct symbol associated with each number from a grid at the bottom of the screen. They were instructed to complete as many trials as possible within 30 seconds. Two outcome measures were derived from the mDSST: the number of completed responses (speed) and the number of correct responses (accuracy). Calculating the percentage of correctly completed responses out of the number of total responses produced a weighted accuracy which was used for further analysis (see Table 1).

Figure 2. mDSST as presented in the m-Path app.
Procedure
Participants were recruited in the period from July to September 2023 through a contact file of persons with ABI who previously participated in studies by the research center and consented to be approached for future research. Initial contact was made via phone, during which the study was explained, and a screening was conducted to determine eligibility based on the in- and exclusion criteria. Individuals who met the criteria and expressed interest were invited to a briefing session. During this session, a researcher went to meet the patients at home, where the study’s practical aspects were thoroughly explained, informed consent was obtained, and pen-and-paper baseline assessments were conducted. Next, the m-Path app was installed on participants’ smartphones, participants were introduced to the momentary self-report items, and it was ensured they understood what was meant by each item. To support them during the study week, they were provided with a (paper) cheat sheet that briefly explained the meaning of all items (e.g. for the item on sensory burden the explanation read: “Are you currently bothered by sensory stimuli? By stimuli we mean information coming through your senses: Seeing (eyes), hearing (ears), smelling (nose), feeling (skin), tasting (tongue)”). Data collection took place over 7 days, during which participants received 7 semi-random beeps daily, based on their wake time and approximately every 90 minutes. For each beep, participants completed the momentary self-report questionnaire and the mDSST task, which collectively took about 2 – 3 minutes to complete. They were instructed to respond to the beeps as promptly as possible. If a participant did not respond within 15 minutes, the questionnaire expired and was marked as missing. Additionally, a morning questionnaire was administered each day, when sleep quality was assessed. The data from participants with a compliance rate (ratio of completed beeps to scheduled beeps) of less than 33% was deemed unreliable and consequently excluded from analysis (Delespaul, Reference Delespaul1995). Participants were encouraged to provide their immediate, instinctive responses rather than overthinking their answers.
Statistical analysis
All analyses were performed using R Statistical Software, v4.3.3 (R Core Team, 2021). Demographic and injury-related information are portrayed descriptively. The influence of environmental and situational triggers (setting, company, effort, activity dissatisfaction, and negative affect) and resources (processing speed, fatigue, and sleep quality) on sensory burden were analyzed using multilevel regression modeling in which beep-prompted observations (level 1) were nested within days (level 2) and within individuals (level 3). The multiple-choice items, i.e. setting and company, were dichotomized into home/elsewhere and alone/with others, respectively. Models were fitted using maximum likelihood to allow model comparison with different fixed effect combinations using likelihood ratio tests. Model fit was assessed using the Akaike Information Criterion (AIC). P-values were adjusted for multiple comparisons using the Benjamini – Hochberg procedure. Statistical significance was assessed using p ≤ .05.
The initial model included all predictive factors (triggers and resources) as fixed effects with participant and day included as random intercepts to model the grouping structure (i.e. allowing participant and day specific baseline levels of sensory burden when all predictors are set to 0, to account for baseline differences). In a subsequent model, the influence of potential confounders (beep number, age and sex) was explored. Only sex was retained, as age and (quadratic, log and square root transformed) beep number were not significant and did not improve model fit. Next, we explored the added value of random slopes for the different predictors (i.e. allowing strength and direction of predictor–outcome relationships to vary across participants and across days). Fatigue was the only predictor that improved model fit significantly when added as a random slope and was thus included in the final model. Notably, the original model findings generally remained stable when adding or removing random slopes, demographic and time-based variables, indicating robust findings. The stability of the findings was also examined through a sensitivity analysis in which participants who reported no sensory burden across the study period (i.e. showed no variation) were excluded.
Autocorrelation between responses across neighboring beeps was controlled for using an AR(1) correlation structure (see supplementary materials, Figure S1). Model assumptions (homoscedasticity, (near)normal distribution of model residuals) were checked (see supplementary materials, Figure S2). Variance Inflation Factors (VIF) were calculated for all predictors, with all VIF values below 2.0, indicating the absence of multicollinearity (Johnston et al., Reference Johnston, Jones and Manley2018). Model outliers (standardized residuals > 3 SD) were removed (n = 11 values). The final model was centered within cluster (CWC) using the CWC(M) method recommended in Yaremych et al. (Reference Yaremych, Preacher and Hedeker2023), whereby each participant formed their own cluster. As such, the fixed effects included CWC predictors, i.e. deviations from the participant’s own mean, alongside their respective mean scores, allowing us to partition within-person and between-person effects. Marginal and conditional R 2 values were used to determine the proportion of variance explained by the model (Nakagawa et al., Reference Nakagawa, Johnson and Schielzeth2017). The influence of the random intercepts (participant, day) and the random slope (fatigue) were evaluated using their standard deviations (SD) and the correlation coefficients between intercepts and slope. For the fixed effects, beta-values and corresponding p-values were considered. Based on the findings, interactions between significant resources and triggers were examined in a secondary analysis, seeing as the study lacked power to include all interactions between triggers and resources in one fully comprehensive model.
Results
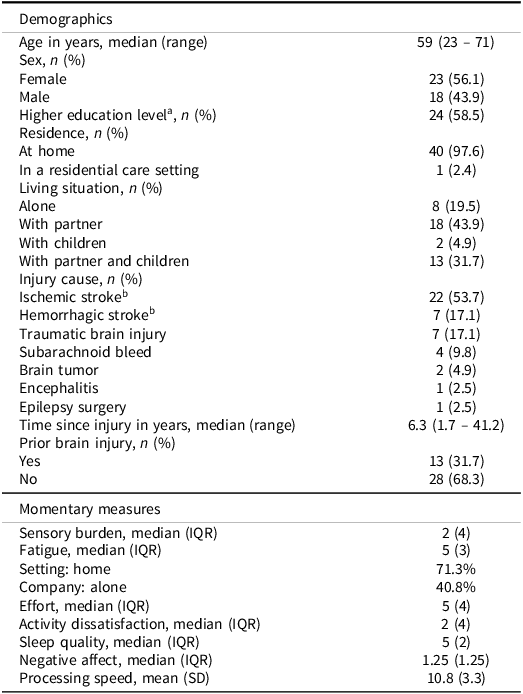
A total of 43 participants participated in the study. One participant was excluded due to a compliance rate below 33%. One other participant was excluded due to technical problems (morning questionnaire and momentary self-report questions were interchanged), leading to a final sample of 41 participants. In keeping with the momentary nature of the data collection, beeps that were completed over 15 minutes after they were started were removed (n = 28 beeps). Removing these beeps did not impact compliance rate exclusions. After data cleaning, the average compliance rate was 82.1% (range: 42.9% – 96.4%). Considering missed beeps and after removing outliers, the final sample size at each level of analysis was 41 participants (level 3), 285 days (level 2), and 1481 observations (level 1). The characteristics of the participants are shown in Table 2.
Table 2. Characteristics of the participants and momentary measures

a Higher education level is defined as the completion of a college or university degree. bThree participants reported both an ischemic and a hemorrhagic stroke and are therefore included in both categories.
IQR = Interquartile Range.
Associations between resources, triggers, and sensory burden
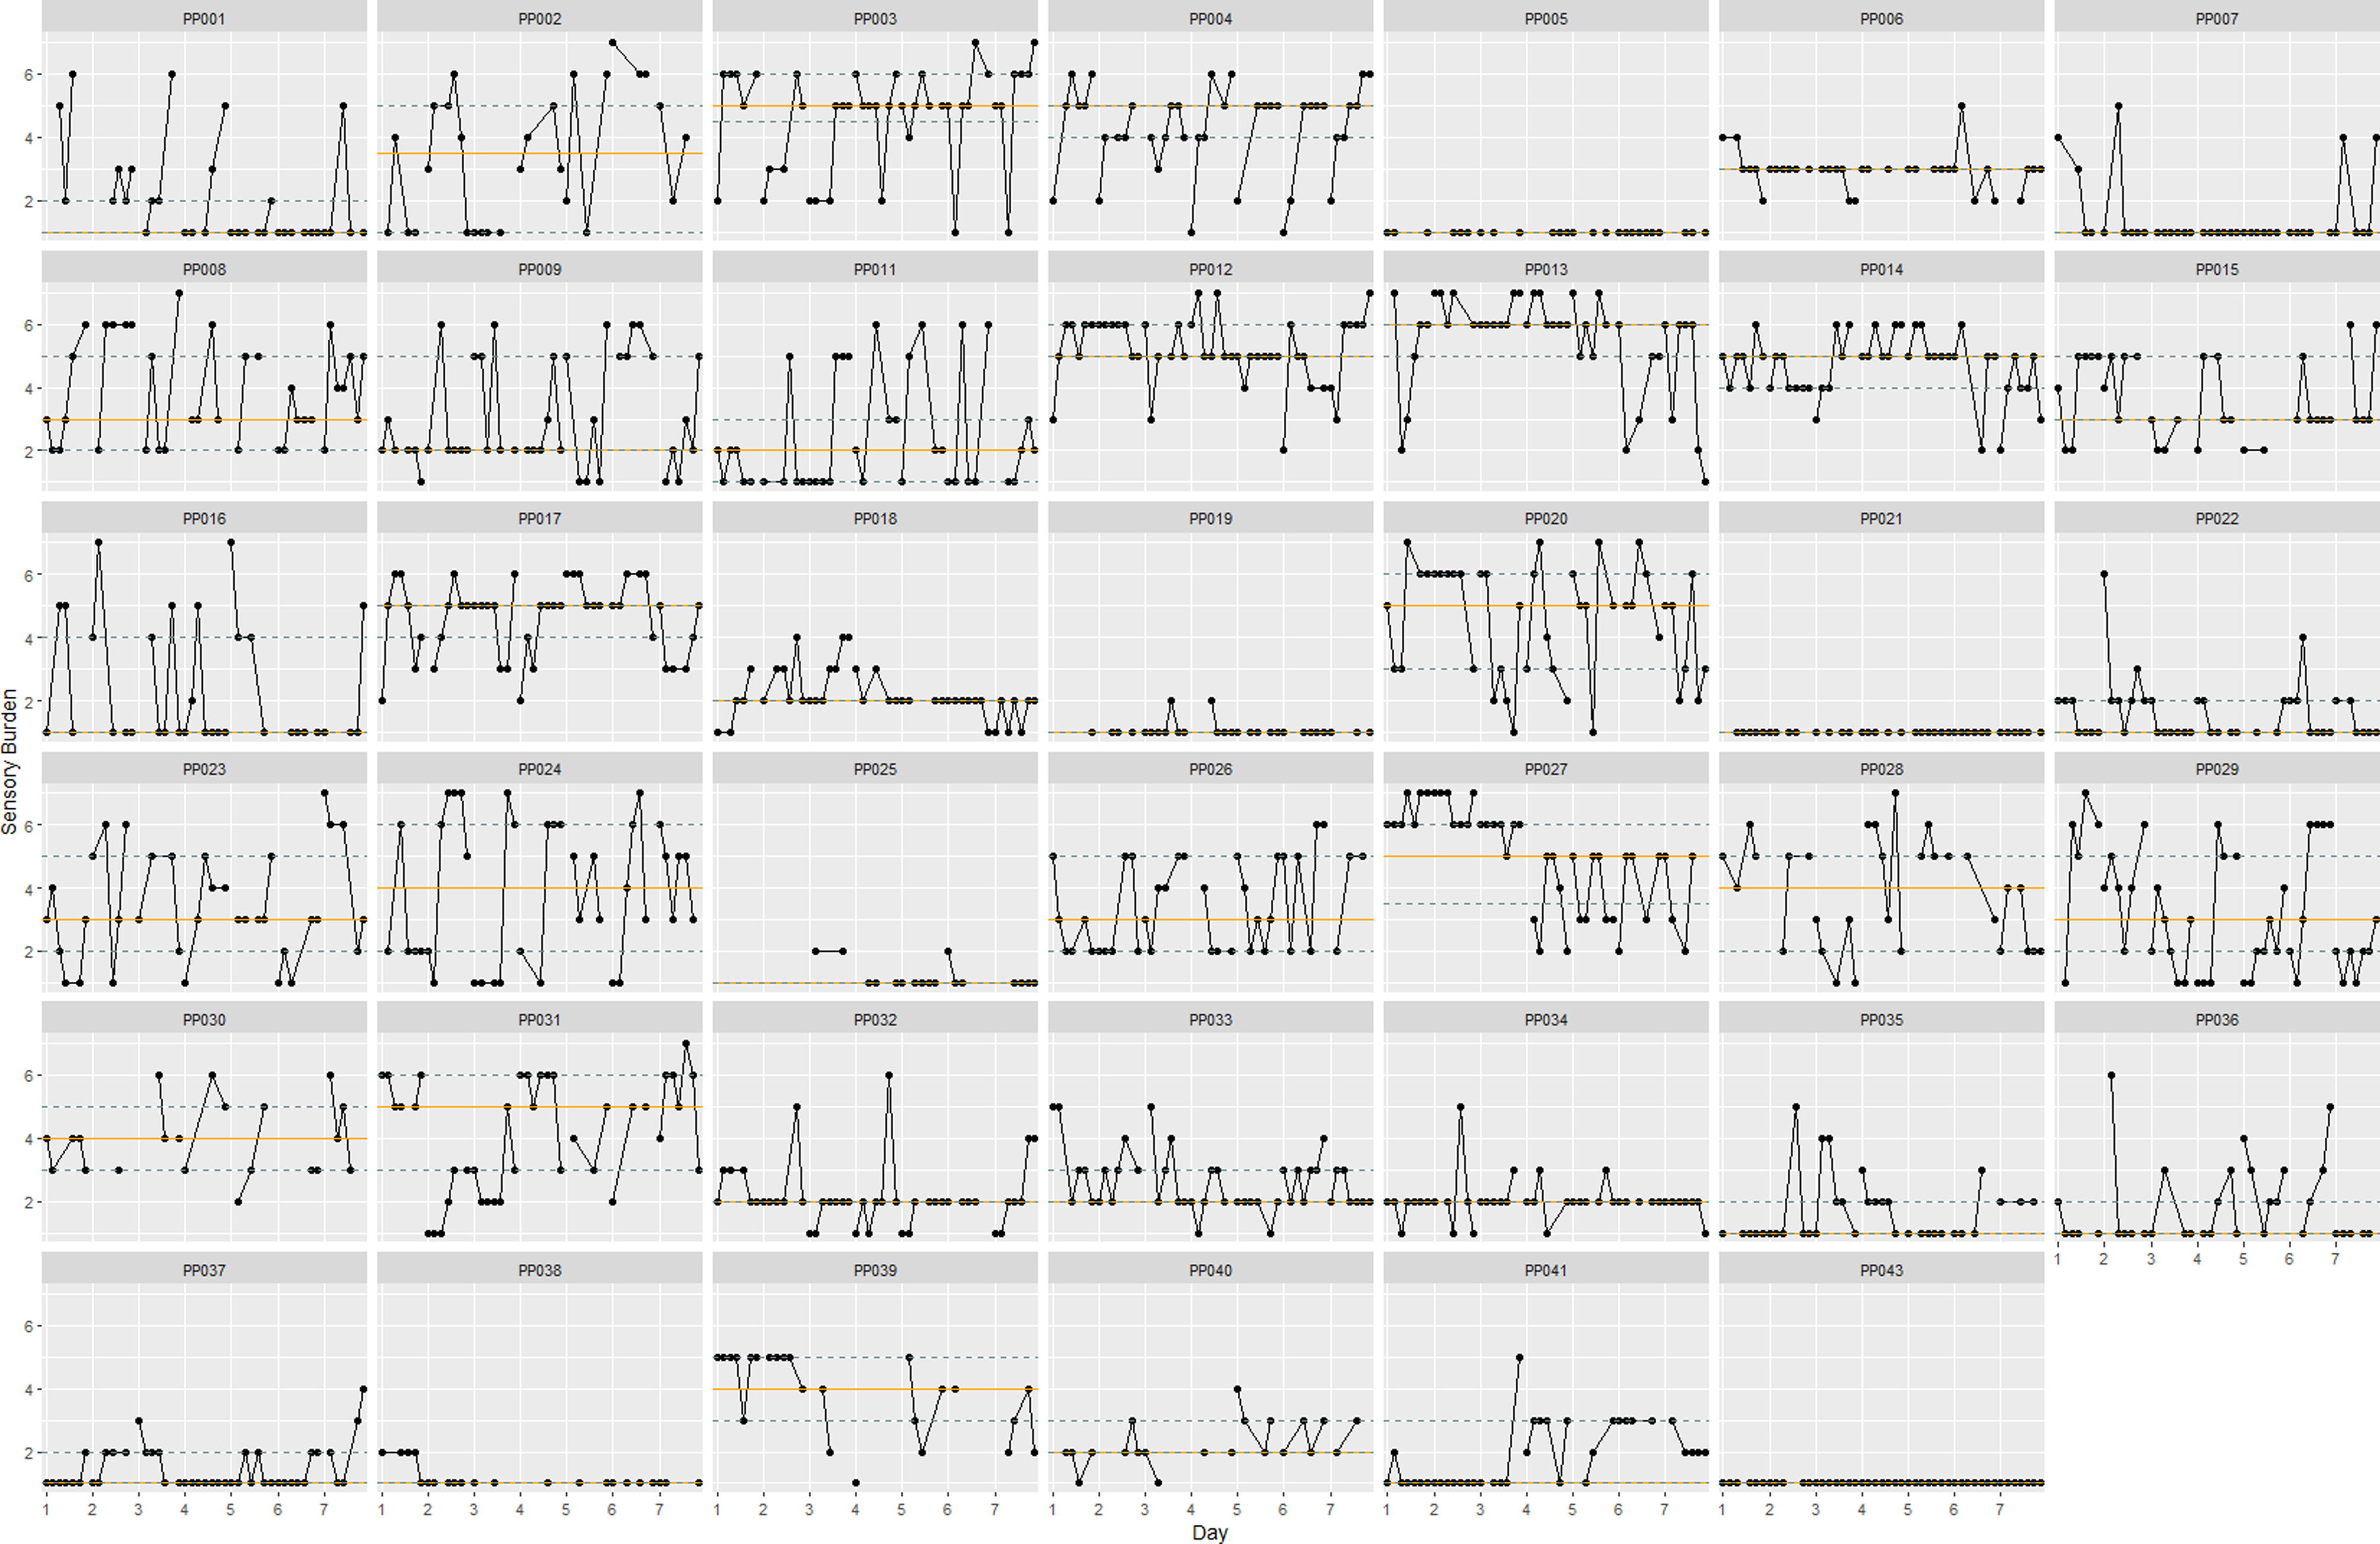
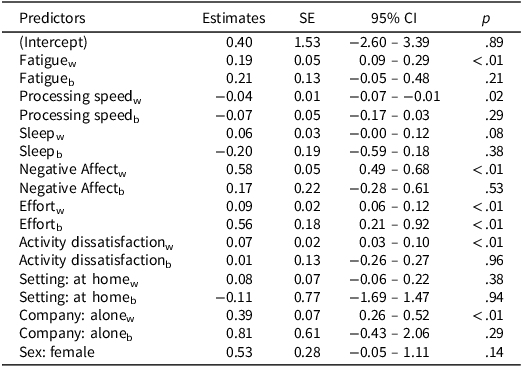
Moment-to-moment fluctuations in sensory burden across the study period are visualized in Figure 3. Figure 3 shows three participants (PP005, PP025, and PP043) who reported no sensory burden across the study period. Results of the linear mixed model showed that fatigue, processing speed, activity dissatisfaction, effort, company, and negative affect were significantly associated with sensory burden while controlling for all other predictors (see Table 3 for model findings; see supplementary materials, Figure S3, for scatterplots of all significant predictors). The significant positive within-person association with fatigue suggests that when participants report higher fatigue ratings compared to their own mean, sensory burden ratings tend to be higher (β = 0.19, p < .01). In contrast, the between-person association was not statistically significant (p = .21). These results are in accordance with the random slope for fatigue which indicates that the effect of fatigue on sensory burden is likely to vary slightly between individuals (SD = 0.25) and within individuals on different days (SD = 0.22). The positive correlation (r = .44) between the random slope for fatigue and the random intercept for participant suggests that individuals with higher baseline levels of sensory burden (intercept) tend to have steeper slopes.

Figure 3. Individual sensory burden plots with within-person medians and interquartile ranges. Note. The blue dotted lines indicate interquartile ranges. The orange line indicates the median. The black lines between data points connect measurements from the same day.
Table 3. Linear mixed model exploring the impact of resources and triggers on sensory burden

Note. SE = Standard Error. CI = Confidence Interval. w = within-person effect. b = between-person effect.
The fixed effects of processing speed, negative affect, activity dissatisfaction, and company similarly showed significant within-person effects (β = −0.04, p = .02; β = .58, p < .01; β = .07, p < .01; β = .39, p < .01, respectively) but no evidence for between-person effects (p = .29; p = .53; p = .96; p = .29, respectively), again highlighting the influence of fluctuations from a person’s own mean on sensory burden. Effort yielded significant positive associations for both within- (β = 0.09, p < .01) and between-person (β = 0.56, p < .01) effects. Sex yielded a significant result prior to centering within cluster (β = 0.81, p < .01), indicating that females on average report higher sensory burden ratings. After centering, it lost its significance (p = .14). According to the model, there was no evidence for an association between sensory burden and sleep quality (within-person: p = .08, between-person: p = .38) or setting (within-person: p = .38, between-person: p = .94). A sensitivity analysis excluding participants who reported no sensory burden across the study period showed minor changes in beta values, and all conclusions regarding statistical significance remained the same (see supplementary materials, Table S1).
A separate exploratory model was run including the significant resources (fatigue and processing speed) and significant triggers (effort, activity dissatisfaction, company, negative affect) and their interactions, focusing on the within-person effects as these were sufficiently powered in the main analysis. The main effects of each resource and trigger were statistically significant, but no interactions terms were significant (see supplementary materials, Table S2).
The marginal R 2 indicated that only 35% of the total variance was accounted for by the fixed effects in the model. The conditional R 2 shows that an additional 44% of the variance was explained by the random effects, reflecting participant-level and day-level variability. This is supported by the variation captured in the random effect estimates, showing that sensory burden baseline levels differ across participants (SD = 0.80) and within participants across different days (SD = 0.39). Beep-level variation within each day and participant is captured in the residual variability (SD = 0.96), representing the unexplained variability across beeps after accounting for all modeled effects.
Discussion
The current study aimed to investigate whether a set of proposed triggers and resources, and their interactions, relate to sensory burden in the daily life of individuals with ABI. The results confirm that various situational triggers (i.e. negative affect, activity dissatisfaction, effort, company) and biopsychosocial resources (i.e. processing speed, fatigue) are associated with momentary levels of sensory burden, with no evidence found for interdependence between triggers and resources. Effects were mainly found within-person, highlighting the importance of individual approaches, though the lack of between-person effects could be attributed to the lack of power to detect interindividual differences, and as such, in what follows, between-person results are only interpreted to a limited extent.
Associations between resources, triggers, and sensory burden
The current results provide evidence for associations between sensory burden and environmental (company) and activity-related (satisfaction and effort) situational triggers, as well as the internal trigger of negative affect. In fact, the relatively large estimate value for negative affect suggests that within-person changes in negative affect (i.e., a compound of irritated, anxious, gloomy, lonely) are strongly related to levels of sensory burden within ABI patients. This is similar to findings from Shepherd et al. (Reference Shepherd, Landon, Kalloor and Theadom2019), where anxiety was found to be the dominant correlate of noise sensitivity in a mild traumatic brain injury sample. Relatedly, several other studies in ABI populations have found positive associations between sensory hypersensitivity and symptoms of depression and anxiety (for a review, see Thielen et al. (Reference Thielen, Tuts, Welkenhuyzen, Huenges Wajer, Lafosse and Gillebert2022)). With regards to the activity-related triggers, our results showed that within-person increases in effort and dissatisfaction are associated with slightly increased reports of sensory burden. Notably, effort was the only factor in the model yielding a between-person effect that reached significance, and with a relatively large estimate value. This suggests that the influence of effort may be situated at the trait level, with people who report higher levels of activity-related effort generally experiencing higher levels of sensory burden.
Of the two environmental factors included in the current analysis, only company and not setting reached statistical significance, indicating that whether a person is alone or in company has a larger impact than whether they are at home or elsewhere. It contrasts direct quotes reported in Marzolla et al. (Reference Marzolla, Thielen, Hurks, Borghans and Van Heugten2023) in which two participants explicitly mention the home environment to be preferable. However, these quotes also contain references to the degree of control possible in the home versus outside environment. As other people likely lower the sense of control over the environmental stimulation, as well as increase the potential sources of (unexpected) multisensory stimulation, we propose that it may not be the location itself (home versus elsewhere), but instead whether there are other people around (company) that plays a larger role in sensory burden.
With respect to the effects of the proposed resources, the current results show that higher momentary levels of fatigue are associated with higher reports of sensory burden, supporting the positive relationship between fatigue and sensory hypersensitivity frequently reported in previous research (e.g., Alwawi et al., Reference Alwawi, Dean, Heldstab, Lawson, Peltzer and Dunn2020; Carlsson et al., Reference Carlsson, Möller and Blomstrand2004). Moreover, our model findings suggest that, more than the other studied factors, the effect of fatigue seems to vary across individuals, as this was the only factor that improved model fit when included as a random slope. The results indicate a stronger effect of fatigue (steeper slope) in individuals who have higher average levels of sensory burden. We did not find evidence for an association with sleep quality, contrasting previous findings linking sleep variables (i.e. insomnia severity) to light and noise sensitivity after mild traumatic brain injury (Elliott et al., Reference Elliott, Opel, Weymann, Chau, Papesh, Callahan, Storzbach and Lim2018). However, Elliott et al. (Reference Elliott, Opel, Weymann, Chau, Papesh, Callahan, Storzbach and Lim2018) did not include a measure for fatigue in their analysis, hindering the possibility to distinguish between fatigue and sleep influences. This warrants further investigation.
Momentary processing speed was negatively associated with sensory burden ratings. The current findings are consistent with previous research in which specifically processing speed (operationalized as reaction time) has been associated with noise and light sensitivity (Marzolla et al., in press; Shepherd et al., Reference Shepherd, Landon, Kalloor and Theadom2019), though when comparing stroke patients with and without visual hypersensitivity, Thielen et al. (Reference Thielen, Welkenhuyzen, Tuts, Vangkilde, Lemmens, Wibail, Lafosse, Huenges Wajer and Gillebert2024) found associations with selective attention and not with processing speed (using computational modeling of behavioral data). The mDSST used in the current study predominantly but not exclusively measures processing speed, as a range of other cognitive functions are required for its successful completion (Jaeger, Reference Jaeger2018; Verhagen et al., Reference Verhagen, Daniëls, Bartels, Tans, Borkelmans, de Vugt, Delespaul and Muñoz-Moreno2019), which makes it difficult to pinpoint the specific role of processing speed with the current data. In any case, the current findings do suggest that there is a cognitive element involved in fluctuations in sensory burden.
Of the covariates included when building the model, sex was the only factor that improved model fit and was therefore retained in the final model, though it lost significance after the other predictors were centered. The initial results did suggest that females on average report higher sensory burden ratings. Beep number was used to model time-of-day effects (beep 1 = morning, beep 7 = evening) but was not retained in the final model as neither the linear, quadratic, log or square root transformed predictor was significant or improved model fit. This could imply that sensory burden after ABI is not strongly impacted by time-of-day differences, unlike previous findings from other studies in mild traumatic brain injury patients (Rabinowitz & Fisher, Reference Rabinowitz and Fisher2020).
The aforementioned significant main effects proved to be robust in our exploratory secondary analysis, in terms of both statistical significance and magnitude. However, no significant interaction effects were found. This suggests that the effects of the environmental, activity-related, and internal triggers do not necessarily depend on the level of available resources in that given moment, and that lacking resources do not necessarily exacerbate the momentary effects of situational triggers.
Theoretical model
Referring to the theoretical model, our results confirm that various situational triggers and biopsychosocial resources, as operationalized in the current analyses, shape the experience of sensory burden in individuals with ABI. However, in the current sample, the detected sensory burden did not seem to arise from a mismatch in the sense of an interaction between a trigger on the one hand and a resource on the other hand. More specifically, we did not find an interaction, i.e., mismatch, between the specific factors included in this study, i.e., negative affect, activity dissatisfaction and effort, company, processing speed, and fatigue. Rather, they had independent associations with sensory burden, acting irrespective of each other. Therefore, it remains important to target interventions to both sides (triggers and resources).
However, the current data are insufficient to fully reject the idea of a mismatch. The current set of factors is not all-encompassing (e.g., familiarity with the situation could be hypothesized to play a role in experienced sensory burden), and our analysis did not cover interactions between more than two factors (e.g., interactions between a trigger and two concurrently lacking resources). For this, a network-analysis approach could be useful to understand interrelations between triggers, resources, and sensory burden, as effects and connections may be bidirectional, lagged, or bridged (e.g., fatigue slows processing speed, which leads to sensory burden). Additionally, the effects may be personalized to the extent that interactions at a group level may be too simplified, circling back to the original purpose of the theoretical model being a tool for personalized interventions. Therefore, while we did not find a mismatch between the current factors included here, elucidating the here-mentioned confounds could contribute to further model validation.
Clinical implications
The theoretical model and findings underscore the need for a personalized approach in clinical practice to handle sensory burden and, more broadly, sensory hypersensitivity following ABI. Our findings suggest that within-person variations in triggers and resources contribute to fluctuations in sensory burden, e.g., an increase in one’s usual levels can lead to a heightened sensory burden, emphasizing the importance of individualized assessment in clinical practice and the need to go beyond aggregate-level research. Moreover, the impact of specific triggers and resources differs across individuals, necessitating a tailored investigation into the most relevant factors for each person, ultimately aimed at managing a balance between triggers and resources. This is further emphasized by Rabinowitz and Fisher (Reference Rabinowitz and Fisher2020) who also advocate for individualized approaches by highlighting largely idiosyncratic symptom networks across individuals with a mild traumatic brain injury. Nonetheless, within the heterogeneity, emotional symptoms, cognitive symptoms, and symptoms of hypersensitivity (sensitivity to light, sensitivity to noise) tended to cluster together in several patients, similar to the factors identified in the current model. Finally, our analyses revealed that fixed effects accounted for 35% of the explained variance, while an additional 44% was attributed to random effects, such as personal and day-to-day variations. This highlights the importance of considering how each individual perceives sensory stimuli when designing and applying interventions, ensuring that treatment strategies are responsive to personal experiences and pitfalls.
Strengths, limitations, and future research
This study provided an inclusive approach to the assessment of sensory burden after ABI, being (more) accessible to individuals on the higher end of sensory hypersensitivity, in contrast to more traditional lab studies, and having few exclusion criteria. Additionally, it provided a direct, momentary measure of sensory burden from the patient’s perspective and within the patient’s natural environment, enhancing ecological validity. This is particularly valuable for concepts like sensory burden, which are inherently situation-dependent, fluctuating throughout the day, and challenging to capture accurately through retrospective recall or averaged assessments. Nonetheless, there are also a few limitations. First, a larger sample size could have provided more power to test for between-person effects and to test a comprehensive interaction effect model, as there may be non-significant main effects that could still have meaningful interaction effects relevant to the theoretical model. Second, in the current study, the sensory environment is measured using self-reported questions on sensory burden, serving as a proxy for measuring sensory load. Future research could include objective measures of sensory load in the participants’ environment (e.g. ambient noise levels) to directly assess the relationship between sensory burden and actual sensory stimulation in the environment. However, in ESM studies, it is essential to keep assessments brief to minimize interference with daily life, and the current analyses were part of a larger study design, not specifically aimed at sensory processing. Nevertheless, the current findings could inform item selection in future studies. Third, the measurement of fatigue could have been more refined. We recommend distinguishing between mental and physical fatigue, as prior research in stroke populations has shown these to be distinct dimensions (Lenaert et al., Reference Lenaert, Neijmeijer, van Kampen, van Heugten and Ponds2020). Our decision to operationalize fatigue as a single construct may partly explain the substantial variability observed, as sensory hypersensitivity, due to its subjective nature, may potentially have more commonalities with mental compared to physical fatigue. Finally, assessing trait sensory hypersensitivity could have provided a clearer picture of the sample’s sensitivity and whether they experienced post-injury changes in their sensitivity.
For future research, the results should be compared to a control group without ABI to evaluate the brain injury-specific effects and to explore whether similar fluctuations and associations are seen in other clinical populations. Future studies could explore the impact of the type of brain injury, time since brain injury, and the impact of psychiatric comorbidities. Lastly, more attention should be directed towards directionality and causality to effectively inform treatment initiatives.
Conclusion
This study is the first to investigate how situational triggers and biopsychosocial resources relate to sensory burden in the daily lives of people with ABI, inspired by a recently developed theoretical model developed by Marzolla et al. (Reference Marzolla, Thielen, Hurks, Borghans and Van Heugten2023). By quantitatively capturing moment-to-moment fluctuations in sensory burden, we provide evidence for the dynamic nature of these experiences and illustrate a high level of heterogeneity in sensory burden in terms of both severity and frequency. Ultimately, our findings highlight the importance of maintaining a within-person approach to fully capture the complexity of sensory burden following ABI. Our outcomes reveal that several factors are involved, confirming a complex, multifactorial basis of this topic. As such, this study has provided a unique, real-time insight into the contribution of fatigue, company, effort, activity dissatisfaction, negative affect, and processing speed to sensory burden after ABI. This knowledge is a first step towards a personalized approach to target sensory hypersensitivity in individuals with ABI.
Supplementary material
The supplementary material for this article can be found at https://doi.org/10.1017/S1355617725101719.
Acknowledgements
Competing interests and sources of financial support: The authors have no competing interests to declare. This work was supported by the Kootstra Talent Fellowship for postdocs of Maastricht University (reference number: 22.1036).


 Open access