


Introduction
While agricultural production has generally improved in most sub-Saharan African (SSA) countries in recent decades (Giller, 2020; Sanchez, Reference Sanchez2002), productivity levels remain low relative to other regions and fall short of those required to ensure sustainable food security (Suri and Udry, Reference Suri and Udry2022; Sheahan and Barrett, Reference Sheahan and Barrett2017; Collier and Dercon, 2014; Dercon and Gollin, Reference Dercon and Gollin2014). To address this challenge, the adoption of modern inputs and technologies has been widely promoted across Africa to enhance the productivity of smallholder farming systems. However, these systems continue to face significant obstacles such as soil degradation, nutrient deficiencies, and widespread pests and diseases (Giller et al., 2011; Mafongoya et al., 2006). Farmers need to invest in appropriate technologies – such as inorganic fertilizers and pest control measures – to overcome these constraints (Bekunda et al., 2010; Kouandou and Laajimi, 2024). Nevertheless, the adoption of these technologies is hindered by constraints related to credit availability, liquidity, insurance, and imperfect labor and land markets (Suri and Udry, Reference Suri and Udry2022; Bridle et al., Reference Bridle, Magruder, McIntosh and Suri2020). These barriers are exacerbated by information gaps, as farmers often lack full knowledge of the costs and benefits involved, and the transition from traditional to modern methods is perceived as risky (Foster and Rosenzweig, 2010; Besley and Case, Reference Besley and Case1993). Beyond their role in boosting yields, modern agricultural technologies are widely regarded as a critical pathway out of poverty in developing countries, fostering economic growth and structural transformation (Besley and Case, Reference Besley and Case1993; Bustos et al., 2016). Investments in these technologies can also reduce labor burdens and improve household welfare, including increases in education spending, as demonstrated in Kenya (Diiro et al., 2021; Kouandou and Laajimi, 2024).
This paper investigates the extent to which smartphone use influences the adoption of modern agricultural technologies in Nigeria – a particularly relevant setting for this study. Agriculture remains a key driver of economic growth in Nigeria, contributing approximately 24% to the country’s GDP in 2021 (Delavallade et al., Reference Delavallade, Goldstein and Gonzalez2022). However, despite its importance, agricultural productivity growth continues to be hampered by numerous constraints. As identified by Phillip et al. (2015), these challenges include poor agricultural prices, limited fertilizer use, low access to credit, land tenure insecurity, land degradation, persistent poverty and gender disparities, underinvestment in agricultural research, and inefficient market access and marketing systems. To address the low adoption rates of modern technologies such as inorganic fertilizers, the Nigerian government launched one of the most ambitious input support programs in sub-Saharan Africa (Adjognon et al., Reference Adjognon, Liverpool-Tasie and Reardon2017). Nonetheless, the program’s effectiveness remains limited, as documented by Takeshima and Liverpool-Tasie (Reference Takeshima and Liverpool-Tasie2015), Liverpool-Tasie (2014a), and Liverpool-Tasie and Takeshima (2013).
On the other hand, mobile phone subscriptions in Nigeria have increased dramatically between 2000 and 2020. Mobile cellular subscriptions per 100 people rose from 13% in 2005 to 67% in 2012, reaching nearly universal coverage by 2020, with 99 subscriptions per 100 people – almost equal to the entire Nigerian population (World Bank, 2020). Between 2010 and 2020 alone, mobile cellular subscriptions grew by 104% (authors’ calculations based on World Bank data). In contrast, fixed telephone subscriptions remain very low and have steadily declined over the past decade, falling from 1.08% in 2007 to just 0.05% in 2020. Smartphones extend beyond basic telephony by enabling internet access, which greatly enhances their utility for farmers. In Nigeria, internet usage among individuals increased substantially, from 7% of the population in 2007 to 36% in 2020.
The contribution of this paper to the existing literature unfolds along several key dimensions. First, it adds to the growing body of research examining how the expansion of mobile phone markets influences economic development in sub-Saharan Africa. Second, unlike most previous studies that focus solely on general mobile phone use, our analysis leverages detailed data on the variety of digital tools used by households, allowing us to specifically isolate the effects of smartphone ownership while controlling for regular mobile phone use. Third, by examining the impact of smartphone use across a broad spectrum of agricultural inputs and technologies, our study captures heterogeneity in adoption patterns, enabling more nuanced and relevant policy recommendations. Finally, our findings have important implications for policymakers by highlighting the role of smartphones in rural farming, thereby informing the design of strategies aimed at increasing farm incomes and promoting sustainable agricultural development.
Methodologically, our research adopts a program evaluation framework where the “treated” group consists of agricultural households that own smartphones. Given the observational and cross-sectional nature of the data, which lacks natural experiments or exogenous variation in smartphone ownership, establishing causal inference remains challenging. Ideally, a randomized controlled trial assigning smartphone ownership would separate the decision to own a smartphone from the decision to adopt modern agricultural inputs. In our observational setting, the primary concern is selection bias, as smartphone ownership is self-selected – wealthier or more socially connected households may be more likely to own smartphones, and these same characteristics may independently influence technology adoption decisions (Beaman et al., Reference Beaman, BenYishay, Magruder and Mobarak2021; Liverpool-Tasie and Winter-Nelson, Reference Liverpool-Tasie and Winter-Nelson2012). Ignoring this endogeneity risks producing biased estimates.
To address bias due to existence of omitted variables, we adopt a selection-on-observables strategy. As emphasized by Bellemare and Novak (Reference Bellemare and Novak2017) and Bellemare et al. (Reference Bellemare, Lee and Novak2021), this approach can yield credible causal estimates in data-rich environments under the assumptions of conditional independence and common support. The key intuition is that, by observing and controlling for a sufficiently rich set of covariates that jointly determine both smartphone ownership and input adoption, the assignment to treatment can be considered as-if random (Cinelli et al., Reference Cinelli, Forney and Pearl2022). Our dataset includes a comprehensive set of theoretically relevant covariates, enabling us to control for many confounding factors. Estimation is performed using entropy balancing (Hainmueller, 2012), a method that reweights the control group to exactly match the covariate moments of the treated group, while allowing the inclusion of village-level and agroecological zone (AEZ)-by-year fixed effects to capture unobserved spatial and environmental heterogeneity.
Our entropy balancing estimates indicate that smartphone ownership significantly increases the likelihood of adopting hired labor, organic and inorganic fertilizers, and tractor adoption.
The remainder of the paper is organized as follows. Section 2 reviews the role of mobile phone use in enhancing well-being and agricultural productivity. Section 3 provides the institutional background, highlighting recent developments in information and communication technologies in Nigeria. Section 4 introduces a simple conceptual framework guiding our analysis. Section 5 describes the data and key variables used in the regressions. Section 6 outlines the research design, while Section 7 presents the estimation results. Finally, Section 8 concludes the paper.
Smartphones and smallholder farmer productivity
The rapid spread of Information and Communication Technologies (ICTs), including internet access, smartphone ownership, laptop use, and social media engagement, has transformed everyday life across many developing countries. Since agriculture remains the dominant sector in most African economies, understanding how ICTs influence the decisions of agricultural households is crucial for informing economic development strategies.
A growing body of economic literature has explored the role of ICTs in agricultural development. For example, Aker (2010) shows that mobile phone adoption improves market efficiency by reducing the dispersion of commodity prices in Niger, which in turn likely enhances agricultural commercialization – a recognized pathway out of poverty (Schulte et al., 2023; Tabe Ojong et al., Reference Tabe Ojong, Hauser and Mausch2022; Cazzuffi et al., 2020). Similarly, Muto and Yamano (2009) find that expanding mobile phone coverage significantly increases farmers’ market participation, especially in areas more distant from district centers in Uganda. Aker and Mbiti (2010) further highlight how mobile phones can improve consumer and producer welfare, thereby fostering broader economic development across sub-Saharan Africa.
Further evidence from Baumüller (Reference Baumüller2018) indicates that mobile phone services facilitate smallholder farmers’ learning, improve access to financial services and modern inputs, and enhance the efficiency of agricultural commodity markets in developing countries. A recent study by Kouandou and Laajimi (2024) in Côte d’Ivoire finds that owning a mobile bank account is associated with a 14% higher likelihood of investing in modern agricultural technologies and a 30% higher likelihood of using inorganic fertilizers. Likewise, Batista and Vicente (2020a) show that mobile money savings in rural Mozambique increase fertilizer investment. Examining ICTs more broadly, Jensen (2010) concludes that, among various technologies, mobile phones currently offer the most accessible and effective tool for African farmers, largely due to their affordability.
Taken together, smartphone adoption may provide smallholder farmers with access to locally relevant information on expected post-adoption profits. This information could include details on agricultural market size and product prices (Jensen, 2007; Muto and Yamano, 2009; Aker, 2009; Aker and Mbiti, 2010; Aker and Fafchamps, 2015), weather forecasts (Fafchamps and Minten, Reference Fafchamps and Minten2012), and access to agricultural extension services (Abate et al., Reference Abate, Bernard, Makhija and Spielman2023; Oyinbo et al., Reference Oyinbo, Chamberlin, Abdoulaye and Maertens2022; Cole and Fernando, 2021; Spielman et al., Reference Spielman, Lecoutere, Makhija and Van Campenhout2021; Van Campenhout et al., 2021; Fu and Akter, 2016). Mobile phones also reduce communication and information search costs, enabling farmers, even in remote areas, to quickly and inexpensively obtain updates on new technologies and available agricultural subsidies (Aker, 2010). Moreover, smartphones strengthen social networks (Björkegren, Reference Björkegren2019), which play a crucial role in influencing profitable agricultural decisions (Cai et al., 2015; Conley and Udry, 2010; Bandiera and Rasul, 2006; Foster and Rosenzweig, Reference Foster and Rosenzweig1995). Since farmers actively seek information from both informal and formal sources, access to timely and accurate information is vital.
For instance, Ayalew and Belay (2020) examine the Ethiopian Commodity Exchange (ECX), a platform that provides reliable formal price information, finding it significantly reduces price dispersion in agricultural markets. Similarly, Abate et al. (Reference Abate, Bernard, Makhija and Spielman2023) study video-mediated agricultural extension in Ethiopia, documenting a 6% increase in technology adoption and improved technical understanding among farmers. Beyond agriculture, Roessler et al. (2023) explore smartphone ownership among women in Malawi, revealing benefits such as enhanced connectivity, financial inclusion, and improved intra-household cooperation, though broader economic impacts appear limited in the short term.
Regarding the specific use of smartphones for farm management, while this practice is well-established in developed countries, such as the US (Khanal and Ojha, Reference Khanal and Ojha2023) and Germany (Michels et al., Reference Michels, Fecke, Feil, Musshoff, Pigisch and Krone2020), it remains less common in many developing countries. However, recent studies are beginning to document the emerging role of smartphones in agricultural management in these contexts. For example, DePuy (2023) finds that smartphone use promotes sustainable intensification in Indonesia, while Cieslik et al. (2021) show that smartphones aid in managing pest invasions in Ethiopia. Similarly, Quandt et al. (Reference Quandt, Salerno, Neff, Baird, Herrick, McCabe, Xu and Hartter2020) provide evidence from Tanzania that smartphone adoption improves agricultural profits by reducing costs and saving time. In the Nigerian context, two notable contributions highlight the potential of smartphones in agriculture: Maertens et al. (2023) document the significant role of smartphone-based extension services in sustainable land management, and Daum et al. (Reference Daum, Villalba, Anidi, Mayienga, Gupta and Birner2021) demonstrate how smartphones facilitate access to tractor services.
Institutional background
Before diving into the empirical analysis, this section presents key stylized facts about the recent diffusion of ICT in Nigeria and its potential to foster rural development. With over 170 million mobile subscriptions, Nigeria hosts the largest mobile market in Africa, making digitalization a critical driver of economic progress (Bahia et al., 2024). Given that the majority of Nigerians reside in rural areas and rely primarily on agriculture for their livelihoods, expanding digital device use among these rural households is particularly urgent. Moreover, the benefits of digital technology adoption tend to be more pronounced among the poorest households and in rural regions compared to urban centers.
In Nigeria, where agricultural markets suffer from significant information frictions, such as misperceptions about seed quality (Wossen et al., 2024), digital tools like smartphones offer a promising way to alleviate these challenges (Aker and Fafchamps, 2015). Recent evidence by Arouna et al. (2021) demonstrates this potential: rice-growing households that received personalized nutrient management advice via a mobile application increased their yields by approximately 7% and their rice profits by around 10% on average. Furthermore, those households that combined personalized advice with a subsidy to cover the recommended fertilizer costs saw even greater benefits, with yield increases near 20% and profit gains of about 23%. Another significant constraint to agricultural productivity in Nigeria is the low level of farm mechanization (Takeshima, Reference Takeshima2015; Takeshima and Salau, Reference Takeshima and Salau2015; Takeshima et al., Reference Takeshima, Nin-Pratt and Diao2013). Recent studies, such as Daum et al. (Reference Daum, Villalba, Anidi, Mayienga, Gupta and Birner2021), highlight that smartphone use can facilitate improved access to mechanization services, as demonstrated in both Nigeria and India.
Over the past two decades, Nigeria has made substantial progress in expanding access to digital services for its population. This advancement stems from a series of policies initiated in the early 1990s and further consolidated in the early 2000s, including the National Mass Communication Policy of 1990, the National Telecommunications Policy of 2000, and the National Information Technology Policy of 2000. These reforms were part of a broader liberalization effort begun in the 1980s and 1990s, which aimed to open up the ICT market, privatize the incumbent operator, and establish the Nigerian Communications Commission (NCC) as an independent regulatory authority (Odufuwa, Reference Odufuwa2012). These initiatives are now being unified under the 2012 Draft National ICT Policy issued by the Ministry of Communication Technology. This draft policy sets an ambitious goal for Nigeria to become a globally competitive, knowledge-based society by 2020. It aims to integrate ICT deeply into the country’s socio-economic framework by tackling critical areas such as infrastructure development, broadband expansion, and spectrum management. The 2012 National ICT Policy outlines 16 strategic focus areas and proposes 103 actionable measures to achieve this vision, with oversight entrusted to an expanded Ministry of ICT (Odufuwa, Reference Odufuwa2012).
Conceptual framework
This section presents a conceptual framework to explore the potential productive effects of smartphone use by rural households. We develop and solve a simple theoretical model that illustrates the underlying intuition. While the model is deliberately simplified and will not be directly estimated, it provides useful insights that guide the empirical analysis.
Smartphones can generate both direct and indirect effects on users. Direct effects arise from the immediate flow of services that smartphones provide – such as communication and information – that directly enter the user’s utility function. In this setting, agents choose the optimal level of smartphone-enabled services to maximize their utility within their budget constraints.
In contrast, indirect effects may stem from behavioral changes driven by new economic opportunities and positive externalities created by smartphone use. This paper focuses primarily on these indirect effects, especially the positive externalities experienced by agricultural households. The core argument is that the benefits of smartphone ownership extend beyond the direct utility from communication and information services. Specifically, smartphones can play a critical role in alleviating farmers’ information constraints, thereby promoting the adoption of yield-enhancing agricultural technologies.
Assuming that a representative agricultural household is characterized by a parameter $\theta $
, in the empirical part of the paper,
$\theta $
, in the empirical part of the paper, $\theta $
will be considered as a vector of household characteristics that shape agricultural decisions. Currently, it captures abilities to undertake complex farming tasks such as managing a new technology. Therefore, high values of
$\theta $
will be considered as a vector of household characteristics that shape agricultural decisions. Currently, it captures abilities to undertake complex farming tasks such as managing a new technology. Therefore, high values of $\theta $
will convey greater farming abilities.
$\theta $
will convey greater farming abilities.
The decision to use smartphone services in the agricultural production process and the decision to adopt modern agricultural technologies are then linked by the ability parameter $\theta $
. That is, farmers with higher abilities to perform complex agricultural tasks, such as managing new technologies, will also be more likely to use a smartphone in the production process.
$\theta $
. That is, farmers with higher abilities to perform complex agricultural tasks, such as managing new technologies, will also be more likely to use a smartphone in the production process.
At the beginning of each agricultural season, the agricultural household demands a smartphone to benefit from communication services. As suggested by the previous related literature reviewed above, it is assumed that a fraction $\psi $
of these services can provide useful agricultural information with probability
$\psi $
of these services can provide useful agricultural information with probability $\pi = \pi \left( \theta \right)$
, with
$\pi = \pi \left( \theta \right)$
, with $\pi '\left( \theta \right) \gt 0$
. This means that the probability of successfully translating smartphone services into better agricultural decisions depends on household characteristics. That is we shall have
$\pi '\left( \theta \right) \gt 0$
. This means that the probability of successfully translating smartphone services into better agricultural decisions depends on household characteristics. That is we shall have $\psi = 0$
with probability
$\psi = 0$
with probability $1 - \pi \left( \theta \right)$
.
$1 - \pi \left( \theta \right)$
.
We assume that the effective quantity of crops produced is given by $b\left( {i,\theta, \psi } \right)$
, where
$b\left( {i,\theta, \psi } \right)$
, where $i$
stands for the value of investment in modern yield-enhanced inputs.
$i$
stands for the value of investment in modern yield-enhanced inputs. $b\left( {i,\theta, \psi } \right)$
is strictly increasing in each argument. The key assumption for our main result is that:
$b\left( {i,\theta, \psi } \right)$
is strictly increasing in each argument. The key assumption for our main result is that: ${b_i}\left( {i,\theta, \psi } \right) - {b_i}\left( {i,\theta } \right) \gt 0$
where
${b_i}\left( {i,\theta, \psi } \right) - {b_i}\left( {i,\theta } \right) \gt 0$
where
 $${b_i}\left( {i,\theta, \psi } \right) = {{{\partial b}}\over{{\partial i}}}\left( {i,\theta, \psi } \right),{\rm{\;\;\;\;}}{b_i}\left( {i,\theta } \right) = {{{\partial b}}\over{{\partial i}}}\left( {i,\theta } \right)$$
are the marginal productivity of investment under smartphone externalities and in the absence of externalities, respectively. More generally, this quantity can be interpreted as the attractiveness of smartphones for agricultural activities. The agricultural household chooses the level of investment $i$
that maximizes the expected productivity:
$i$
that maximizes the expected productivity:
 $$\mathop {{\rm{max}}}\limits_i \left\{ {\pi \left( \theta \right)b\left( {i,\theta, \psi } \right) + \left( {1 - \pi \left( \theta \right)} \right)b\left( {i,\theta } \right) - c\left( i \right)} \right\}$$
where $c\left( i \right)$
represents the investment cost function, which satisfies traditional assumptions,
$c\left( i \right)$
represents the investment cost function, which satisfies traditional assumptions,
 $$c\left( 0 \right) = 0,c'\left( i \right) \gt 0,c''\left( i \right) \gt 0.$$
Hence, the cost function is increasing and convex, providing mathematical requirements for the existence of minimum cost. Given the value of parameters $\theta $
and
$\theta $
and $\psi $
, the agricultural household demands for investment
$\psi $
, the agricultural household demands for investment $i$
that maximize his expected productivity. The first order is given by:
$i$
that maximize his expected productivity. The first order is given by:
 $$\pi \left( \theta \right)\left[ {{b_i}\left( {i,\theta, \psi } \right) - {b_i}\left( {i,\theta } \right)} \right] + {b_i}\left( {i,\theta } \right) = c'\left( i \right)$$
Examination of equation (3) reveals two mains economic intuitions associated with the use of smartphone. First, if the agricultural household is able to exploit or internalize positive externalities associated with the use of smartphone for farming activities, it will improve farm productivity by $\pi \left( \theta \right)\left[ {{b_i}\left( {i,\theta, \psi } \right) - {b_i}\left( {i,\theta } \right)} \right]$
.
$\pi \left( \theta \right)\left[ {{b_i}\left( {i,\theta, \psi } \right) - {b_i}\left( {i,\theta } \right)} \right]$
. $c'\left( i \right)$
represents the marginal cost of investment. Second, in the absence of positive externalities associated with the use of smartphones for agricultural activities, one obtains the traditional optimal condition,
$c'\left( i \right)$
represents the marginal cost of investment. Second, in the absence of positive externalities associated with the use of smartphones for agricultural activities, one obtains the traditional optimal condition, ${b_i}\left( {i,\theta } \right) = c'\left( i \right)$
. Equation (3) implicitly defines the optimal demand for investment,
${b_i}\left( {i,\theta } \right) = c'\left( i \right)$
. Equation (3) implicitly defines the optimal demand for investment, ${i^{\rm{*}}} = i\left( {\theta, \psi, \pi } \right)$
, as follows
${i^{\rm{*}}} = i\left( {\theta, \psi, \pi } \right)$
, as follows
 $$\pi \left( \theta \right)\left[ {{b_i}\left( {{i^{\rm{*}}},\theta, \psi } \right) - {b_i}\left( {{i^{\rm{*}}},\theta } \right)} \right] + {b_i}\left( {{i^{\rm{*}}},\theta } \right) = c'\left( {{i^{\rm{*}}}} \right)$$
Now to obtain the clear-cut comparative static results, we assume the following functional forms for $\pi $
,
$\pi $
, $b$
and
$b$
and $c$
:
$c$
:
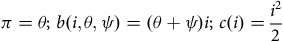 $$\pi = \theta ;\,b\left( {i,\theta, \psi } \right) = \left( {\theta + \psi } \right)i;\,c\left( i \right) ={{{{i^2}}}\over{2}}$$
That is ${b_{}}\left( {{i^{\rm{*}}},\theta, \psi } \right) = \theta + \psi $
;
${b_{}}\left( {{i^{\rm{*}}},\theta, \psi } \right) = \theta + \psi $
; ${b_i}\left( {{i^{\rm{*}}},\theta } \right) = \theta $
; and
${b_i}\left( {{i^{\rm{*}}},\theta } \right) = \theta $
; and $c'\left( {{i^{\rm{*}}}} \right) = {i^{\rm{*}}}$
Then equation (4) yields:
 $${i^{\rm{*}}} = i\left( {\theta, \psi } \right) = \theta \left( {1 + \psi } \right)$$
Hence, the optimal demand for investment in modern inputs and technologies increases $\theta $
and with
$\theta $
and with $\psi $
. More importantly, we have that:
$\psi $
. More importantly, we have that:
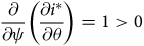 $${{\partial }\over{{\partial \psi }}}\left( {{{{\partial {i^{\rm{*}}}}}\over{{\partial \theta }}} }\right) = 1 \gt 0$$
This result suggests that externalities from smartphone use improve the marginal effects of farming’s abilities, leading to a complementary between ability and the use of smartphones. In the empirical part of the paper, $\theta $
will be defined as the vector of exogenous household characteristics, such as gender, age, etc.
$\theta $
will be defined as the vector of exogenous household characteristics, such as gender, age, etc.
Data, variable definition, and descriptive statistics
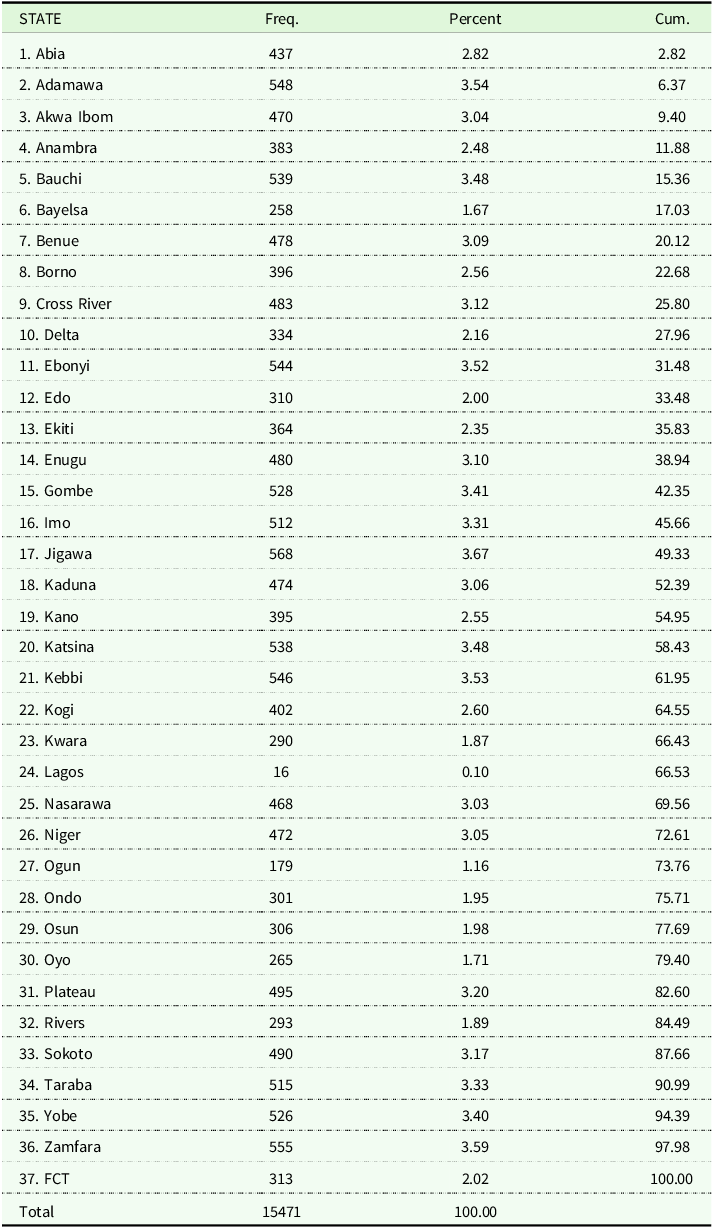
Data description. Our empirical investigation is based on the 2018/2019 Nigeria Living Standards Survey (NLSS). The NLSS is designed and implemented by the National Bureau of Statistics (NBS). This survey is representative at the national and regional levels (six regions: North Central, North East, North West, South Central, South East, and South West) covering the 36 states and the Federal Capital Territory, Abuja. Table 8 in Appendix A displays household distribution across states. Except for Lagos, which represents the most urbanized state in Nigeria, household distribution appears relatively uniform.
One of the basic objectives of the 2018/2019 NLSS is to provide relevant information to help obtain a robust measure of welfare at both household and community levels. Indeed, the survey covers many aspects of economic behavior, including farm production, education, health, labor, expenditures on food and non-food goods, non-farm enterprises, household assets, etc. The NLSS is particularly suited for the purpose of this study because it contains information not only on agricultural decisions but also on non-agricultural activities, thus providing us with a rich set of controls.
The final household sample was selected through a two-stage selection procedure. In the first stage, enumeration areas (EAs) were randomly sampled based on those defined for the 2006 Nigeria Census Housing and Population conducted by National Population Commission (NPopC). In the first stage of the study, a total of 2213 EAs were selected. In the second stage, 10 households were randomly selected in each EA. The selection was done ensuring that selected households were well dispersed across the EAs in order to limit the potential for clustering of the selected households within an EA.
For the purposes of this paper, the final sample consists of selected households whose main occupation was agriculture in 2018 and 2019 and is constructed using the relevant sections of the survey. The most important section is section 18 on agricultural data. It provides detailed information on agricultural activities: crop production, animal husbandry, and fishing. This section provides the use of the main output variables (use of non-family labor, organic fertilizers, inorganic fertilizers, insecticides, pesticides, herbicides, and animal traction). It also provides us with the main crops planted by households, which will help us in our efforts to reduce the extent of selection bias. The main variable of interest, smartphone ownership, is provided by section 10 on assets owned by rural households. This section also provides us with regular mobile phone use. Detailed information on socio-demographic characteristics such as gender, age, marital status, etc. is provided in section 1. Other relevant sections are section 2 on education, section 5 on remittances, section 9a on diversification strategies, especially into non-agricultural activities, and section 11 on credit demand. We merge all these sections using uniquely defined keys: household and enumeration area. We end up with a sample of about 15,000 rural households.
Variables used in the regressions. This section discusses the process of selecting the relevant variables to be used in the regression. We do this by drawing on the most related literature. Recent studies on technology adoption have largely focused on the adoption of fertilizers (Liverpool-Tasie et al., 2017; Liverpool-Tasie, Reference Liverpool-Tasie2017; Takeshima and Liverpool-Tasie, Reference Takeshima and Liverpool-Tasie2015; Liverpool-Tasie, Reference Liverpool-Tasie2014b,a; Liverpool-Tasie and Takeshima, 2013; Liverpool-Tasie and Winter-Nelson, Reference Liverpool-Tasie and Winter-Nelson2012) and, to a lesser extent, on the adoption of mechanization practices (Takeshima and Salau, Reference Takeshima and Salau2015; Takeshima, Reference Takeshima2015; Takeshima et al., Reference Takeshima, Nin-Pratt and Diao2013). The intuition behind the intense attention paid to the use of inorganic fertilizers is the fact that they are subsidized and that the process of nutrient depletion and soil degradation is generally cited as the main constraint to improving agricultural productivity in Nigeria. But this focus has neglected an alternative to inorganic fertilizers, organic fertilizers, which are key ingredients in restoring soil fertility in tropical areas (Watson et al., 2002; Palm et al., Reference Palm, Gachengo, Delve, Cadisch and Giller2001). The use of organic fertilizers is then considered in this paper. Other major constraints to improving agricultural productivity in Nigeria are plant diseases and pests (Ndubuaku and Asogwa, Reference Ndubuaku and Asogwa2021; Samuel et al., Reference Samuel, Abolade and Evelyn2020; Amusa et al., Reference Amusa and Odunbaku2007). In this regard, we consider the use of insecticides, pesticides, and herbicides. Another important agricultural input is hired labor (Udry, 2010). Many poor rural households rely mainly on child labor to increase productivity (Andre et al., 2021; Edmonds and Schady, Reference Edmonds and Schady2012; Basu and Tzannatos, Reference Basu and Tzannatos2003). Therefore, the use of hired labor not only increases agricultural productivity but can also be considered a relevant solution to the global child labor problem. Taken together, this paper considers the adoption of the following inputs and technologies: hired labor, inorganic fertilizers, organic fertilizers, insecticides, pesticides, herbicides, mechanization, and animal traction. They are coded as dummy variables (HiredLabor, Inorganic, Organic, Insecticides, Pesticides, Herbicides, Mechanization, and Animal Traction) equal to one if households adopted them and zero otherwise.
The main variable of interest, SmartPhone, is smartphone ownership, coded as a dummy variable equal to one if the rural household owns at least one smartphone and zero otherwise. To control for the impact of smartphone ownership on modern input and technology adoption, we rely on the most related literature to choose relevant covariates.Footnote 1
We first consider the role of the household head’s gender. The considered gender is female, which is a dummy variable equal to one if household head is a woman and equal to zero otherwise. Recent evidence suggests that gender plays a central role in agriculture in Africa. Female farmers tend to have less access to productive land and other basic agricultural assets than male farmers (Tufa et al., 2022; Goldstein and Udry, 2008; Doss and Morris, 2000; Udry, 1996). Kebede (Reference Kebede2022) documented a persistent gap in the adoption of chemical fertilizer between male- and female-headed smallholder farmers in Ethiopia. In Sub-Saharan Africa, the choice of marital status is generally related to agricultural decisions. Jacoby (1995) and Damon and McCarthy (2019) found that polygamy improves agricultural labor productivity. Dessy et al. (Reference Dessy, Tiberti, Tiberti and Zoundi2021) found that it enhances the resilience of rural households to climate shocks, notably through network effects. We then consider the following dummy variables: Polygamous, CommonLaw, Divorced, Widowed, and Single, which are equal to one for rural households with the corresponding marital status (polygamous, common law, divorced or separated, widowed, or single) and equal to zero otherwise. We also consider Hsize, which is household size: the total number of individuals in the household. The last socio-demographic variable we consider is age, which is defined by the age of the head of the household.
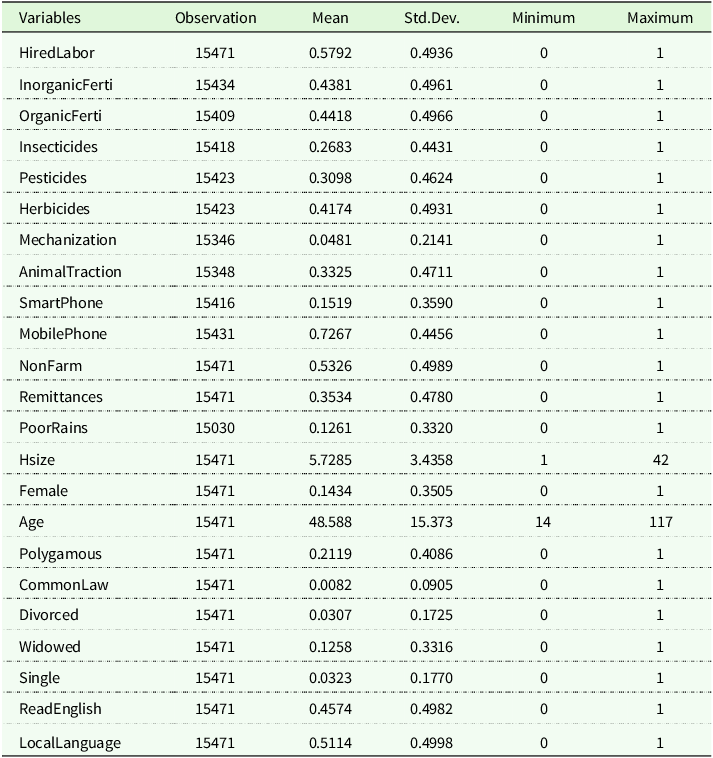
Access to credit is generally cited as an essential route to agricultural production and technology adoption (Karlan et al., Reference Karlan, Osei, Osei-Akoto and Udry2014; Giné and Yang, Reference Giné and Yang2009; Udry, 1990). Alternative options for financing agricultural investment in the absence of well-defined rural financial markets include remittances (Ali et al., 2023) and income from rural non-farm enterprises (Oseni and Winters, 2009; Stampini and Davis, 2009; Reardon et al., 1994). We then consider NonfarmIncome and Remittances, which are dummy variables equal to one if the household head has diversified into non-farm businesses and has received local or international cash or in-kind remittances. We also include PoorRains, which is a dummy variable equal to one if the household reported having experienced poor rainfall in the last three years. Recent evidence from Jagnani et al. (Reference Jagnani, Barrett, Liu and You2021) and Alem et al. (Reference Alem, Bezabih, Kassie and Zikhali2010) in Ethiopia suggests that pesticide and fertilizer use responds to rainfall variability. The last two covariates we consider are ReadEnglish and LocalLanguage, which are dummy variables equal to one if the household head can read and write in English and the local language, respectively. Table 1 summarizes these variables.
Table 1. Summary statistics

Notes: The reference marital status is monogamous
Descriptive statistics. Table 1 presents summary statistics of the variable of interest. The sample units are households. For each variable, we report basic statistics including total observation, mean, and standard deviation. For our main outcome variables, we observe that hired labor was used by about 57.9% of rural households. Regarding the use of fertilizers, inorganic and organic fertilizers were used by about 43.8% and 44%, respectively. Insecticides, pesticides, and herbicides were used in 26.8%, 30.9% and 41.7% of the cases, respectively. About 4.8% and 33.2% of households used tractors and animal traction, respectively. Regarding the treatment variable and covariates, 15% of rural households in our sample owned a smartphone. About 14.3% of rural households were female-headed. On average, rural households were about 48 years old and had a large family, as the household size was more than 5 persons.
Research design
Testing the assumption
The primary goal of this paper is to estimate the effect of smartphone ownership on the likelihood that rural households adopt modern agricultural inputs and technologies. In this section, we present our identification strategy.
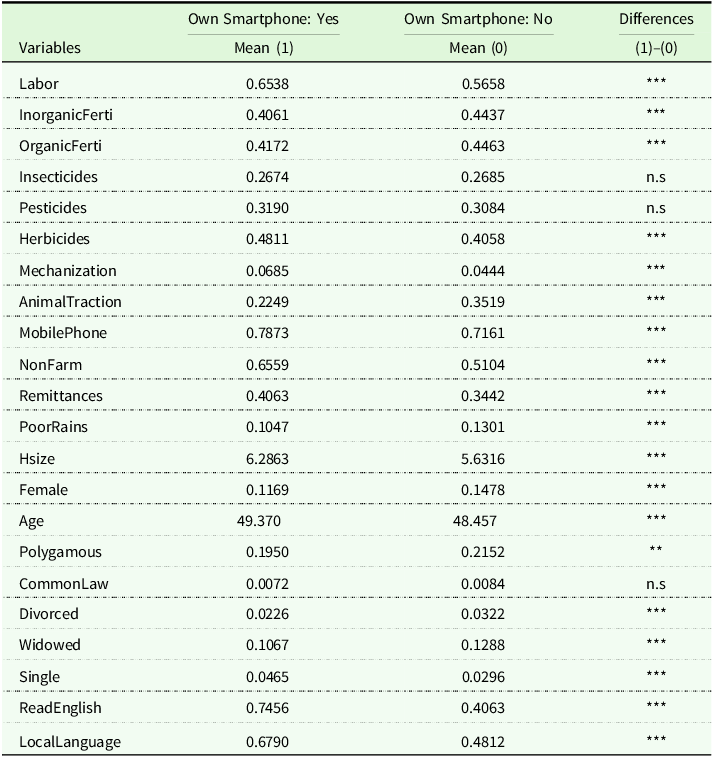
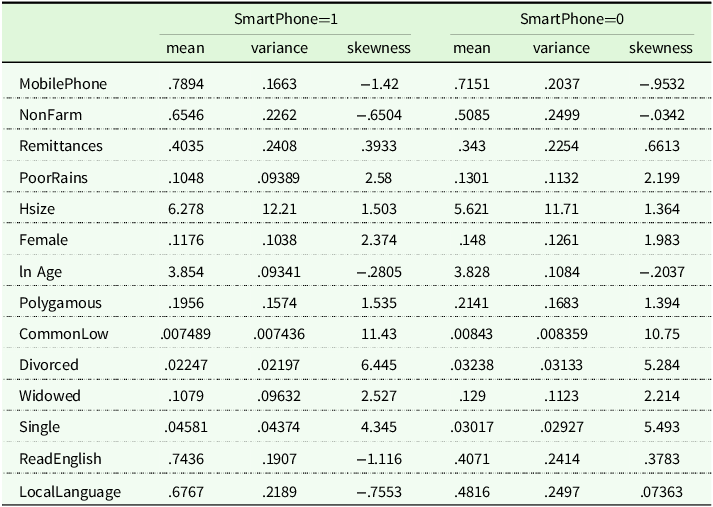
Since smartphone ownership is a self-selected, non-random decision, a key step is to identify a relevant comparison group for hypothesis testing. To begin, we conduct a simple difference-in-means comparison of all key variables between farmers who own smartphones and those who do not. Table 2 reports the results of these comparison tests.
Table 2. Descriptive statistics by smartphone ownership regime
Notes: n.s: non statistically significant
*** ( $p$
-value
$p$
-value $ \lt 0.01$
). ** (
$ \lt 0.01$
). ** ( $p$
-value
$p$
-value $ \lt 0.05$
)
$ \lt 0.05$
)
The results show significant differences between smartphone owners and non-owners across almost all variables, except for their use of insecticides and pesticides, where the groups appear statistically indistinguishable. While these comparisons do not establish causality, they confirm our expectation that rural households owning smartphones differ markedly from those who do not, highlighting the importance of properly addressing selection bias in the subsequent analysis.
Empirical framework
The key relationship explored in this analysis is the effect of smartphone ownership on the likelihood of adopting a particular type of modern inputs and technologies as identified above. For a particular rural household, we consider the following basic relationship.
 $${\bf{A}}_{{\bf{hvzct}}}^{\bf{k}} = {\bf{f}}\left( {{\bf{SmartPhon}}{{\bf{e}}_{{\bf{hvzct}}}},{{\bf{X}}_{{\bf{hvzct}}}},{\phi _{\bf{v}}},{\mu _{\bf{c}}},{\eta _{{\bf{zt}}}},{\varepsilon _{{\bf{hvzct}}}}} \right)$$ ${\bf{A}}_{{\bf{hvzct}}}^{\bf{k}}$
stands for whether household
${\bf{A}}_{{\bf{hvzct}}}^{\bf{k}}$
stands for whether household ${\bf{h}}$
located in village
${\bf{h}}$
located in village ${\bf{v}}$
in AEZ
${\bf{v}}$
in AEZ ${\bf{z}}$
involved in the production of the main crop
${\bf{z}}$
involved in the production of the main crop ${\bf{c}}$
in survey year
${\bf{c}}$
in survey year ${\bf{t}}$
adopted a particular input or technology
${\bf{t}}$
adopted a particular input or technology ${\bf{k}}$
. The decision
${\bf{k}}$
. The decision ${\bf{A}}_{{\bf{hvzct}}}^{\bf{k}}$
to adopt
${\bf{A}}_{{\bf{hvzct}}}^{\bf{k}}$
to adopt ${\bf{k}}$
is based on the following binary dependent variable model with unobserved effects:
${\bf{k}}$
is based on the following binary dependent variable model with unobserved effects:
 $${\bf{A}}_{{\bf{hvzct}}}^{\bf{k}} = \left\{ {\matrix{ {1\;\;\;\;if\;{\bf{\Pi }}_{{\bf{hvzct}}}^{\rm{*}} \gt 0} \hfill \cr {} \hfill \cr {0\;\;\;\;otherwise.\;} \hfill \cr } } \right.$$
The discrete choice model in (8) indicates that a rational rural household ${\bf{h}}$
will choose to adopt
${\bf{h}}$
will choose to adopt ${\bf{k}}$
if
${\bf{k}}$
if ${\bf{\Pi }}_{{\bf{hvzct}}}^{{\rm{*}}{\bf{k}}}$
, the expected farm profit from doing so, is higher than the status quo profit, normalized to zero.
${\bf{\Pi }}_{{\bf{hvzct}}}^{{\rm{*}}{\bf{k}}}$
, the expected farm profit from doing so, is higher than the status quo profit, normalized to zero. ${\bf{\Pi }}_{{\bf{hvzct}}}^{{\rm{*}}{\bf{k}}}$
is a latent variable. Instead, we observe an indicator variable,
${\bf{\Pi }}_{{\bf{hvzct}}}^{{\rm{*}}{\bf{k}}}$
is a latent variable. Instead, we observe an indicator variable, ${\bf{A}}_{{\bf{hvzct}}}^{\bf{k}}$
which takes the value one if
${\bf{A}}_{{\bf{hvzct}}}^{\bf{k}}$
which takes the value one if ${\bf{\Pi }}_{{\bf{hvzct}}}^{{\rm{*}}{\bf{k}}} \gt 0$
and zero otherwise.
${\bf{\Pi }}_{{\bf{hvzct}}}^{{\rm{*}}{\bf{k}}} \gt 0$
and zero otherwise. ${\bf{Smartphon}}{{\bf{e}}_{{\bf{hvzct}}}}$
is a dummy variable for being in the treated group as displayed in Table 2: it is equal to one if household
${\bf{Smartphon}}{{\bf{e}}_{{\bf{hvzct}}}}$
is a dummy variable for being in the treated group as displayed in Table 2: it is equal to one if household ${\bf{h}}$
owns a smartphone, and equal to zero otherwise. The adoption model (7) also includes a set of covariates
${\bf{h}}$
owns a smartphone, and equal to zero otherwise. The adoption model (7) also includes a set of covariates ${{\bf{X}}_{{\bf{hvzct}}}}$
. It also includes village fixed effects
${{\bf{X}}_{{\bf{hvzct}}}}$
. It also includes village fixed effects ${\phi _{\bf{v}}}$
, and crop-specific effects
${\phi _{\bf{v}}}$
, and crop-specific effects ${\eta _{\bf{c}}}$
. We also include AEZ-by-survey year fixed effects,
${\eta _{\bf{c}}}$
. We also include AEZ-by-survey year fixed effects, ${\eta _{{\bf{zt}}}}$
, to control for unobservables that vary by AEZ over time, such as the seasonal climate forecast. In naive OLS specifications, we shall introduce
${\eta _{{\bf{zt}}}}$
, to control for unobservables that vary by AEZ over time, such as the seasonal climate forecast. In naive OLS specifications, we shall introduce ${\eta _{{\bf{zct}}}}$
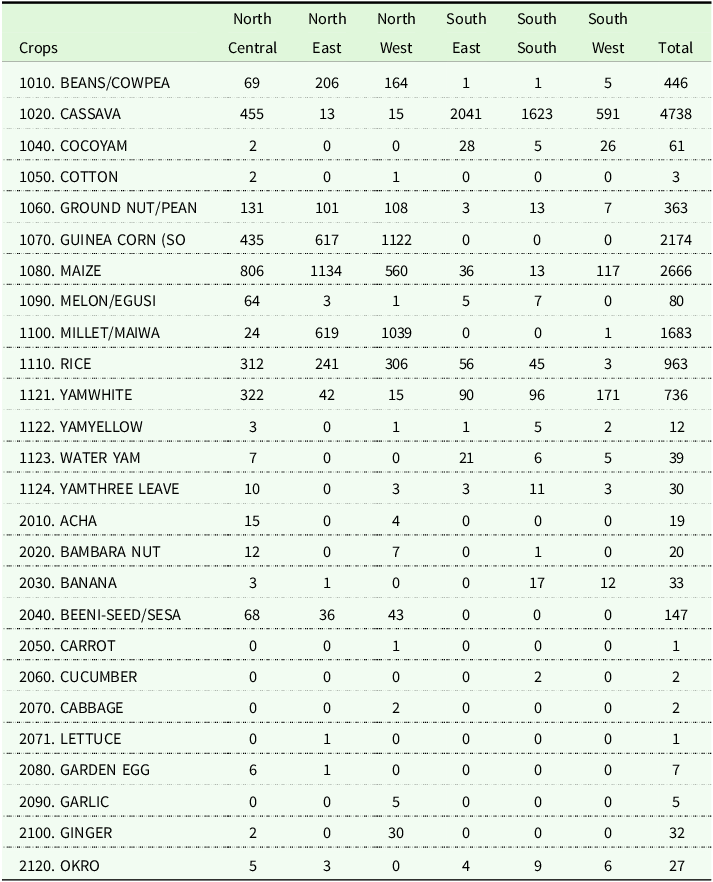
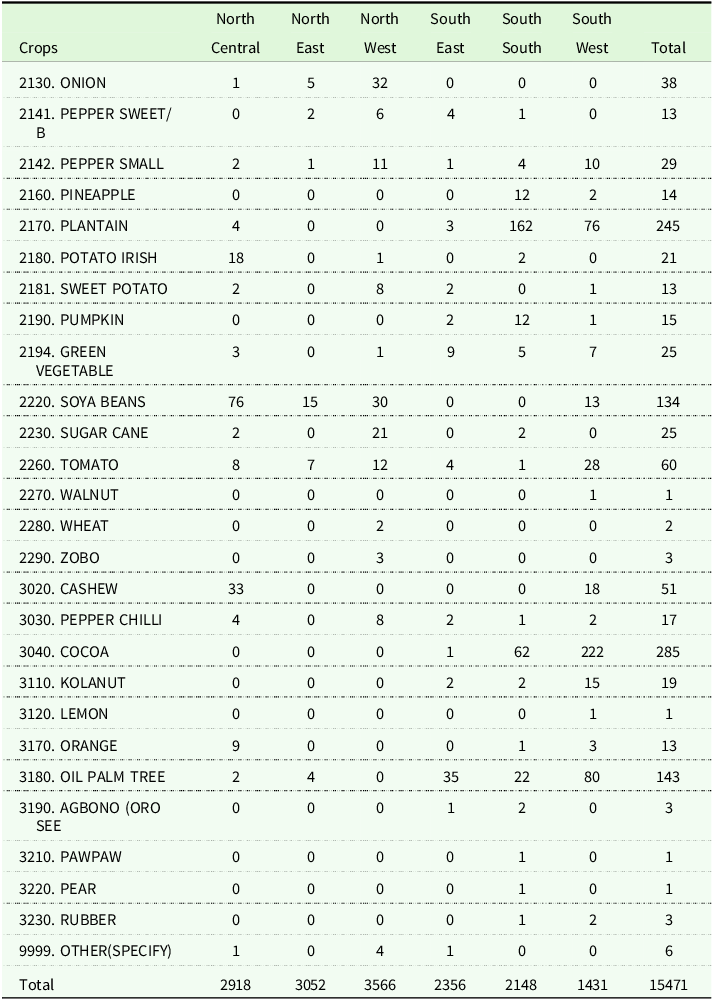
to capture AEZ shocks shared by households that have grown same crops. Tables 9 and 10 (Appendix B) display the main crops planted by our sampled households by AEZ. There are six agro-ecological zones, three in the northern region and three in the southern region. We observe that cassava seems to be the dominant crop and is mainly grown by households in the south.
${\eta _{{\bf{zct}}}}$
to capture AEZ shocks shared by households that have grown same crops. Tables 9 and 10 (Appendix B) display the main crops planted by our sampled households by AEZ. There are six agro-ecological zones, three in the northern region and three in the southern region. We observe that cassava seems to be the dominant crop and is mainly grown by households in the south. ${\varepsilon _{{\bf{hvzct}}}}$
is a randomly distributed error. If we observed all relevant determinants of
${\varepsilon _{{\bf{hvzct}}}}$
is a randomly distributed error. If we observed all relevant determinants of ${\bf{A}}_{{\bf{hvzct}}}^{\bf{k}}$
, then
${\bf{A}}_{{\bf{hvzct}}}^{\bf{k}}$
, then ${\varepsilon _{{\bf{hvzct}}}} = 0$
and the adoption model (7) would hold exactly. In this perspective, there would be no identification problem to speak of.
${\varepsilon _{{\bf{hvzct}}}} = 0$
and the adoption model (7) would hold exactly. In this perspective, there would be no identification problem to speak of.
We now explicitly write the adoption equation, (7), as follows:
 $${\bf{A}}_{{\bf{hvzct}}}^{\bf{k}} = \beta {\bf{SmartPhon}}{{\bf{e}}_{{\bf{hvzct}}}} + {\bf{\Gamma '}}{{\bf{X}}_{{\bf{hvzct}}}} + {\phi _{\bf{v}}} + {\mu _{\bf{c}}} + {\eta _{{\bf{zt}}}} + {\varepsilon _{{\bf{hvzct}}}}$$
The parameter of interest is $\beta $
. It measures the effect of smartphone ownership on the technology adoption decision. For Ordinary Least Squares to identify
$\beta $
. It measures the effect of smartphone ownership on the technology adoption decision. For Ordinary Least Squares to identify $\beta $
in equation (9), we must assume that
$\beta $
in equation (9), we must assume that ${\bf{SmartPhon}}{{\bf{e}}_{{\bf{hvzct}}}}$
is orthogonal to
${\bf{SmartPhon}}{{\bf{e}}_{{\bf{hvzct}}}}$
is orthogonal to ${\varepsilon _{{\bf{hvzct}}}}$
, conditional on the effects of covariates, the village-specific, crop-specific and AEZ-by-year-specific effects. That is
${\varepsilon _{{\bf{hvzct}}}}$
, conditional on the effects of covariates, the village-specific, crop-specific and AEZ-by-year-specific effects. That is
 $${\bf{Covariance}}\left( {{\bf{SmartPhon}}{{\bf{e}}_{{\bf{hvzct}}}},{\varepsilon _{{\bf{hvzct}}}}|{{\bf{X}}_{{\bf{hvzct}}}},{\phi _{\bf{v}}},{\mu _{\bf{c}}},{\eta _{{\bf{zt}}}}} \right) = 0$$
This identification assumption holds if smartphone ownership is truly exogenous, or if all covariates and fixed effects are sufficiently informative to carry over to the random distribution of smartphone ownership across rural households. In the subsequent analysis, a linear probability (LPM) specification is used for the discrete choice model in (8). Compared to traditional discrete models such as probit and logit, the LPM is useful because changes can be interpreted on the probability scale. Another important advantage in our context is that it allows us to include crop-by-village-by-time fixed effects without biasing the other coefficients. The important limitation associated with the use of the LPM is that probabilities need to be constrained to be between 0 and 1. However, if the average of the outcome is not close to 0 or 1, which is the case in our sample (see Table 1), there is not much difference between the LPM or logit/probit models (Caudill et al., 1988; Maddala, 1986). In all estimations, we will follow Abadie et al. (Reference Abadie, Athey, Imbens and Wooldridge2023) in clustering standard errors at the enumeration area (village) level. However, as discussed above, in our context it is obvious that there may be potential unobserved variables that simultaneously affect technology adoption decisions and smartphone ownership. However, in the absence of a panel data structure, we cannot control for household fixed effects.
Entropy balancing as an alternative identification strategy for robustness. To address this challenge, we use an entropy balancing approach (Hainmueller, 2012), a reweighting method that ensures exact balance of covariate moments between treated and control units while retaining the flexibility of regression adjustment. Formally, in the first stage, entropy balancing estimates unit weights ${w_h}$
for the control group by solving the constrained optimization problem:
${w_h}$
for the control group by solving the constrained optimization problem:
 $${\min _{{w_h}}}\sum\limits_{h \in {\bf{H}}} {{w_h}} \ln {{{w_h}} \over {{q_h}}}:Subject\,to:\sum\limits_h {{w_h}} {X_{hu}} = {\bar X_{Tu}}\forall u;\sum\limits_{h \in {\bf{H}}} {{w_h}} = {N_{\bf{H}}}$$
where ${q_h}$
are base weights (often uniform),
${q_h}$
are base weights (often uniform), ${X_{hu}}$
is the
${X_{hu}}$
is the $u$
-th covariate for household
$u$
-th covariate for household $h$
, and
$h$
, and ${\bar X_{Tu}}$
is the mean of covariate
${\bar X_{Tu}}$
is the mean of covariate $u$
in the treated group. This ensures that the first moments of the covariates match exactly across groups; higher-order moments can also be balanced if desired.
$u$
in the treated group. This ensures that the first moments of the covariates match exactly across groups; higher-order moments can also be balanced if desired.
In the second stage, these weights are incorporated into an augmented weighted regression of the form:
 $${\bf{A}}_{{\bf{hvzc}}}^{\bf{k}} = \beta {\bf{SmartPhon}}{{\bf{e}}_{{\bf{hvzct}}}} + {\bf{\Gamma '}}{{\bf{X}}_{{\bf{hvzct}}}} + {\phi _{\bf{v}}} + {\mu _{\bf{c}}} + {\eta _{{\bf{zt}}}} + {\varepsilon _{{\bf{hvzct}}}}$$
Entropy balancing is doubly robust (Zhao and Percival, 2017): consistent estimation of is achieved if either (i) the reweighting scheme produces balance on all confounders, or (ii) the outcome regression is correctly specified. This property is particularly valuable in our context, where unobserved heterogeneity at the village and crop level may bias simpler estimators (Aker and Mbiti, 2010; Riley, Reference Riley2018; Batista and Vicente, 2020b; Mwikamba et al., 2024; Etwire et al., 2017).
Specifically, $\beta $
in the regression model (11) is recovered as the conditional average treatment effect (CATE):
$\beta $
in the regression model (11) is recovered as the conditional average treatment effect (CATE):
 $$\beta = ({\bf{E}}\left[ {{\bf{A}}_{{\bf{hvzct}}}^{\bf{k}}\left( 1 \right)\left| {{{\bf{X}}_{{\bf{hvzct}}}},{\phi _{\bf{v}}},{\mu _{\bf{c}}},{\eta _{{\bf{zt}}}}\left] { - {\bf{E}}} \right[{\bf{A}}_{{\bf{hvzct}}}^{\bf{k}}\left( 0 \right)} \right|{{\bf{X}}_{{\bf{hvzct}}}},{\phi _{\bf{v}}},{\mu _{\bf{c}}},{\eta _{{\bf{zt}}}}} \right]$$
In this formulation, the expectation
 $${\bf{E}}[{\bf{A}}_{{\bf{hvzct}}}^{\bf{k}}\left( 1 \right)|{{\bf{X}}_{{\bf{hvzct}}}},{\phi _{\bf{v}}},{\mu _{\bf{c}}},{\eta _{{\bf{zt}}}}]$$
represents the expected outcome (the likelihood of adopting the modern agricultural technology or input ${\bf{k}}$
) for rural households who use smartphones, and the expectation
${\bf{k}}$
) for rural households who use smartphones, and the expectation
 $${\bf{E}}[{\bf{A}}_{{\bf{hvzct}}}^{\bf{k}}\left( 0 \right)|{{\bf{X}}_{{\bf{hvzct}}}},{\phi _{\bf{v}}},{\mu _{\bf{c}}},{\eta _{{\bf{zt}}}}]$$
represents the expected outcome (the likelihood of adopting the modern agricultural technology or input ${\bf{k}}$
) for rural households who do not use smartphones. By helping to properly handle fixed effects within a matching framework, entropy balancing has gained popularity in recent years. Recent applications in development economics include Apeti and Ly (2024), who examined the impact of power outages on firm productivity in developing countries; Apeti and Edoh (2023), who tested the role of mobile money in improving tax collection in developing countries; or Apeti (Reference Apeti2023), who analyzed the extent to which mobile money helps reduce consumption risk in developing countries.
${\bf{k}}$
) for rural households who do not use smartphones. By helping to properly handle fixed effects within a matching framework, entropy balancing has gained popularity in recent years. Recent applications in development economics include Apeti and Ly (2024), who examined the impact of power outages on firm productivity in developing countries; Apeti and Edoh (2023), who tested the role of mobile money in improving tax collection in developing countries; or Apeti (Reference Apeti2023), who analyzed the extent to which mobile money helps reduce consumption risk in developing countries.
Results
This section presents the empirical results. We begin with naïve OLS estimates of alternative specifications of regression model (9) and then proceed to estimates obtained via entropy balancing, which we regard as our most credible and robust identification strategy.
OLS estimates
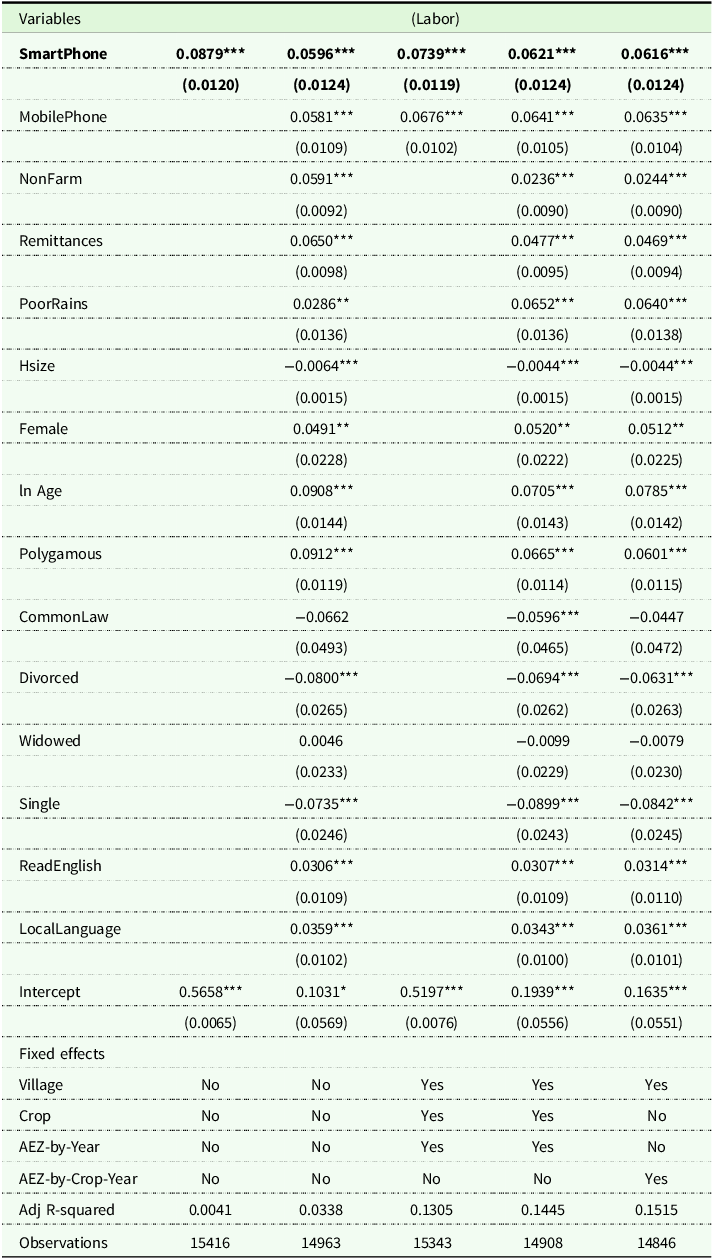
Demand for Hired Labor. We begin our empirical analysis by examining the relationship between smartphone ownership and the probability of hiring labor, based on the linear probability model in equation (9). The results are presented in Table 3. In Column (1), we estimate a benchmark specification that is common in the literature, where the probability of hiring labor is regressed solely on an indicator for smartphone ownership. The estimated coefficient suggests that households owning smartphones are, on average, 9% more likely to hire labor than those without smartphones. This unconditional relationship provides an initial sense of the potential labor demand effect associated with smartphone adoption. Column (2) extends the specification to include household- and plot-level controls, along with fixed effects, which capture time-invariant unobserved heterogeneity. The magnitude of the coefficient declines to around 6%, indicating that part of the initial difference in Column (1) can be explained by observable characteristics. In Column (3), we introduce a more restrictive set of fixed effects: village, crop, and AEZ-by-year, while including only one covariate: regular mobile phone ownership. This allows us to control for unobserved factors at a more granular spatial and temporal scale, which are likely to influence both smartphone adoption and labor hiring decisions. Finally, Column (5) reports our most demanding OLS specification, which includes the full set of covariates and AEZ-by-crop-by-year fixed effects. The estimated effect of smartphone ownership remains at 6.16%. Across specifications, the results are robust, statistically significant, and economically meaningful, suggesting a positive and persistent association between smartphone use and hired labor demand.
Table 3. SmartPhone ownership and demand for hired labor: OLS estimates
Notes: Robust standard errors clustered at the village level are in parentheses;
*( $p \lt 0.10$
); **(
$p \lt 0.10$
); **( $p \lt 0.05$
); ***(
$p \lt 0.05$
); ***( $p \lt 0.01$
).
$p \lt 0.01$
).
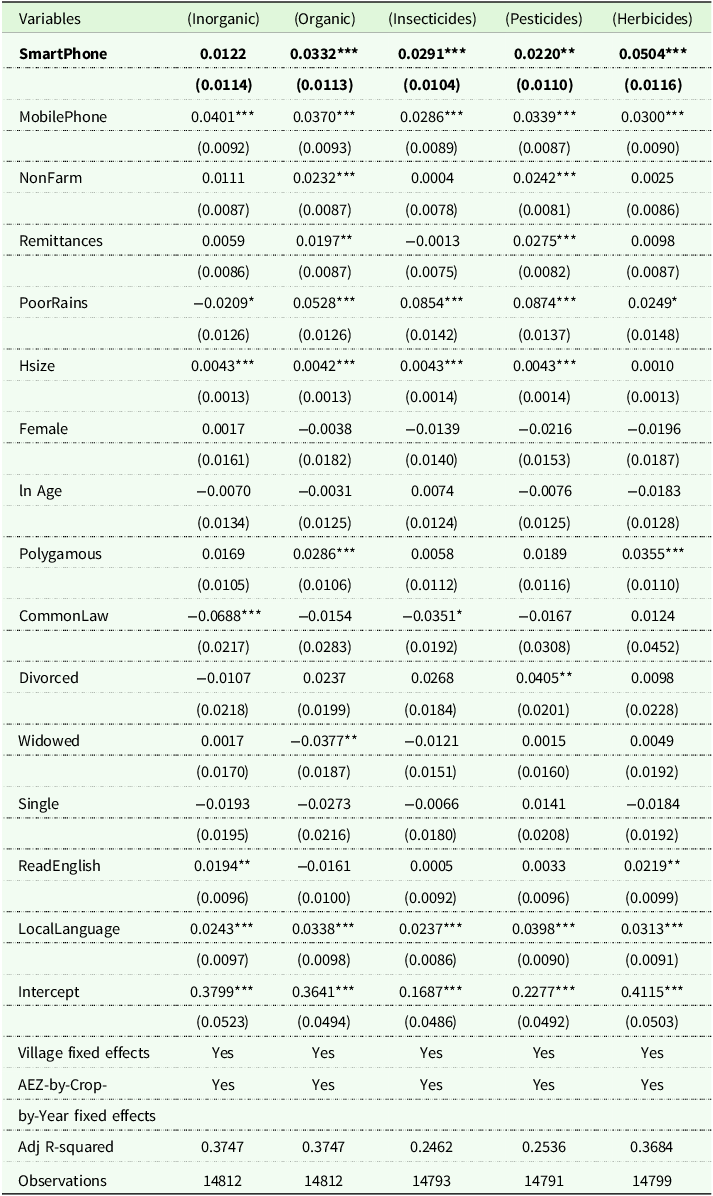
Demand for fertilizers and phytosanitary products. Table 4 reports the OLS estimates from equation (9) when the dependent variables are the probabilities of adopting inorganic fertilizers, organic fertilizers, insecticides, pesticides, and herbicides. For inorganic fertilizers, the estimated coefficient on smartphone ownership is positive but not statistically significant across specifications, suggesting no robust evidence of a direct link between smartphone adoption and the use of these inputs. In contrast, the results are stronger for organic fertilizers and herbicides. Specifically, the estimates indicate that households owning smartphones are, on average, 3.3% more likely to adopt organic fertilizers and 5% more likely to use herbicides than non-owning households. These effects are statistically significant at conventional levels, implying that smartphone adoption may facilitate access to, or information about, certain modern and sustainable agricultural inputs. The estimated effects for insecticides and pesticides are positive but smaller in magnitude, indicating more heterogeneous relationships. Overall, the pattern of results suggests that while smartphone ownership is not uniformly associated with increased adoption of all types of fertilizers and phytosanitary products, which may require timely and localized information that smartphones can help deliver.
Table 4. Smartphone ownership and adoption of fertilizers and phytosanitary products: OLS estimates

Notes: Robust standard errors clustered at the village level are in parentheses;
*( $p \lt 0.10$
); **(
$p \lt 0.10$
); **( $p \lt 0.05$
); ***(
$p \lt 0.05$
); ***( $p \lt 0.01$
).
$p \lt 0.01$
).
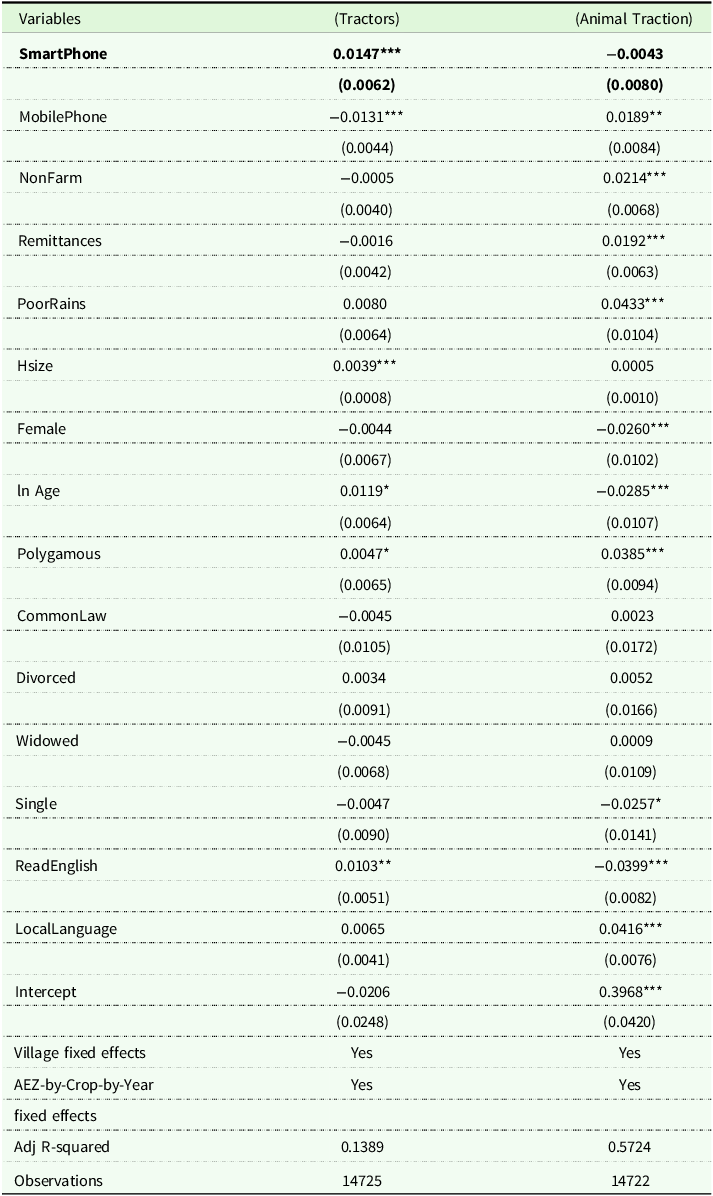
Demand for animal traction and tractors. Table 5 presents the OLS estimates from equation (9) when the dependent variables are the probabilities of adopting animal traction and tractors. We focus here on our most robust specification, which includes village fixed effects and agroecological zone-by-crop-by-year fixed effects, thereby controlling for fine-grained spatial and temporal heterogeneity that could jointly influence smartphone adoption and mechanization decisions. The results indicate that smartphone ownership is associated with a 1.4% higher likelihood of using tractors. Although modest in magnitude, this effect is statistically significant, suggesting that smartphones may facilitate access to mechanization services, possibly by improving communication with equipment providers, increasing exposure to mechanization initiatives, or enabling better coordination of rental services. By contrast, the estimated effect on the probability of adopting animal traction is small and statistically insignificant, indicating no robust link between smartphone ownership and the use of this more traditional form of farm power. This divergence between tractors and animal traction may reflect differences in capital requirements, service provision models, and the type of information that influences adoption decisions. A detailed discussion of the effects of other covariates, including household characteristics, plot attributes, and local market conditions, is deferred to the presentation of our entropy balancing results, where the results are more robust.
Table 5. Smartphone ownership and smallholder mechanization: OLS estimates

Notes: Robust standard errors clustered at the village level are in parentheses;
*( $p \lt 0.10$
); **(
$p \lt 0.10$
); **( $p \lt 0.05$
); ***(
$p \lt 0.05$
); ***( $p \lt 0.01$
).
$p \lt 0.01$
).
Entropy balancing estimates
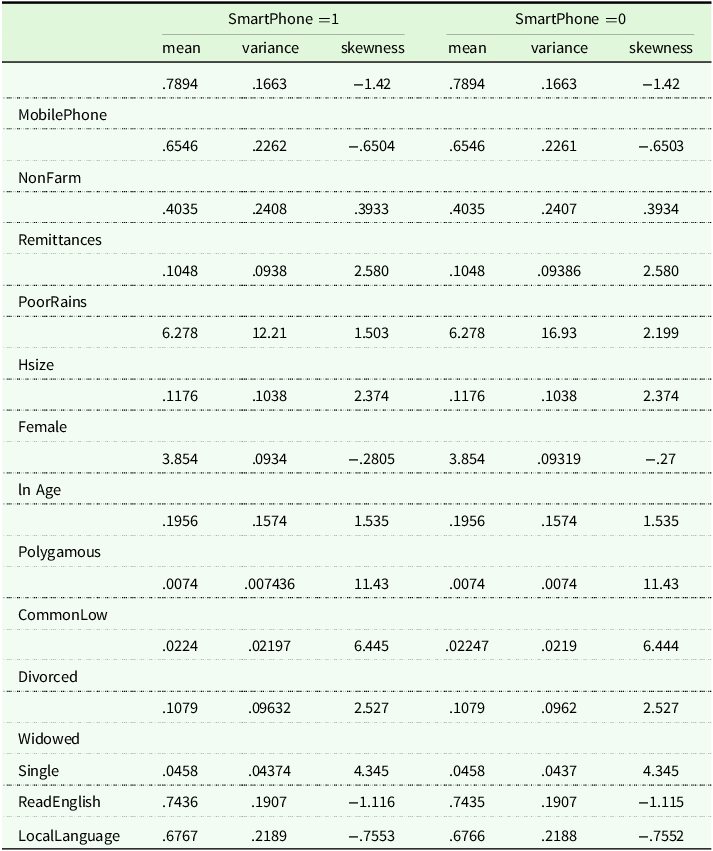
We now turn to the results obtained from entropy balancing, reported in Tables 6 and 7. Before discussing the main outcomes, it is useful to assess the weighting process. Tables 11 and 12 present the covariate balance before and after applying entropy balancing. The results show that, in the weighted sample, all covariates are perfectly balanced across treatment and control groups for all moments considered, confirming that the procedure successfully constructs a comparable pseudo-population.
Table 6. Matching estimates: hired labor, inorganic and organic fertilizers, insecticides
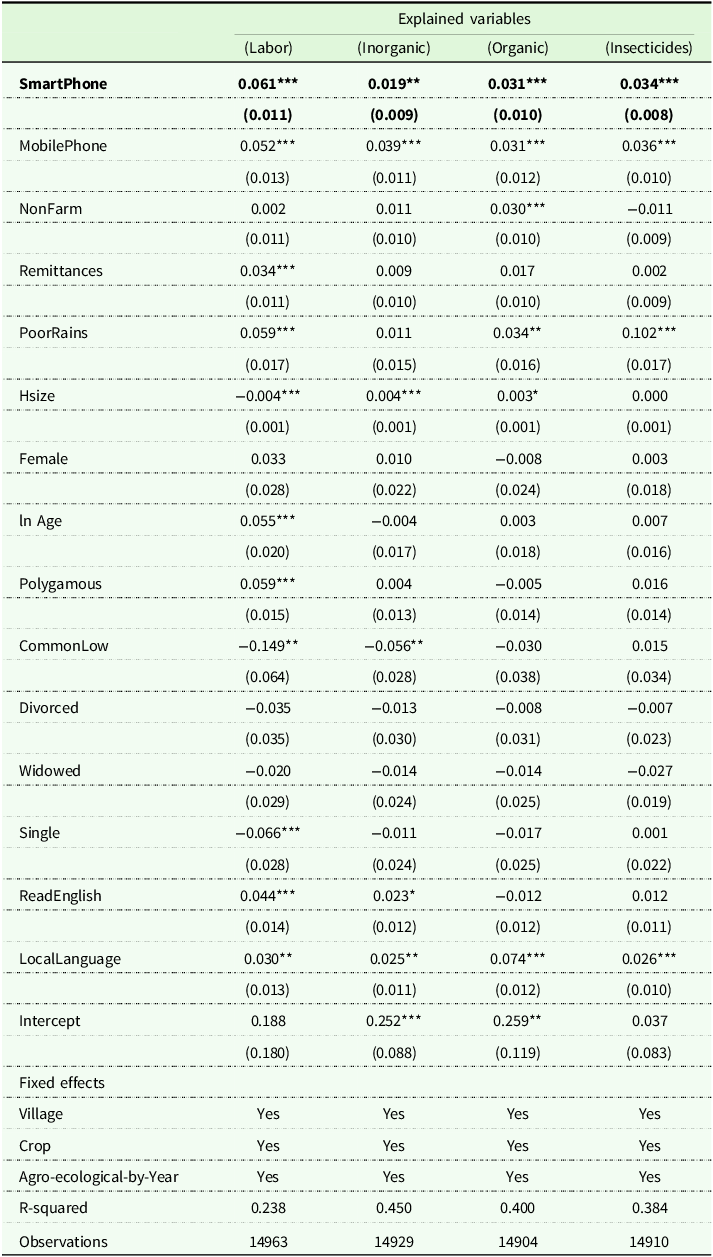
Notes: Standard errors are in parentheses; *( $p \lt 0.10$
); **(
$p \lt 0.10$
); **( $p \lt 0.05$
); ***(
$p \lt 0.05$
); ***( $p \lt 0.01$
).
$p \lt 0.01$
).
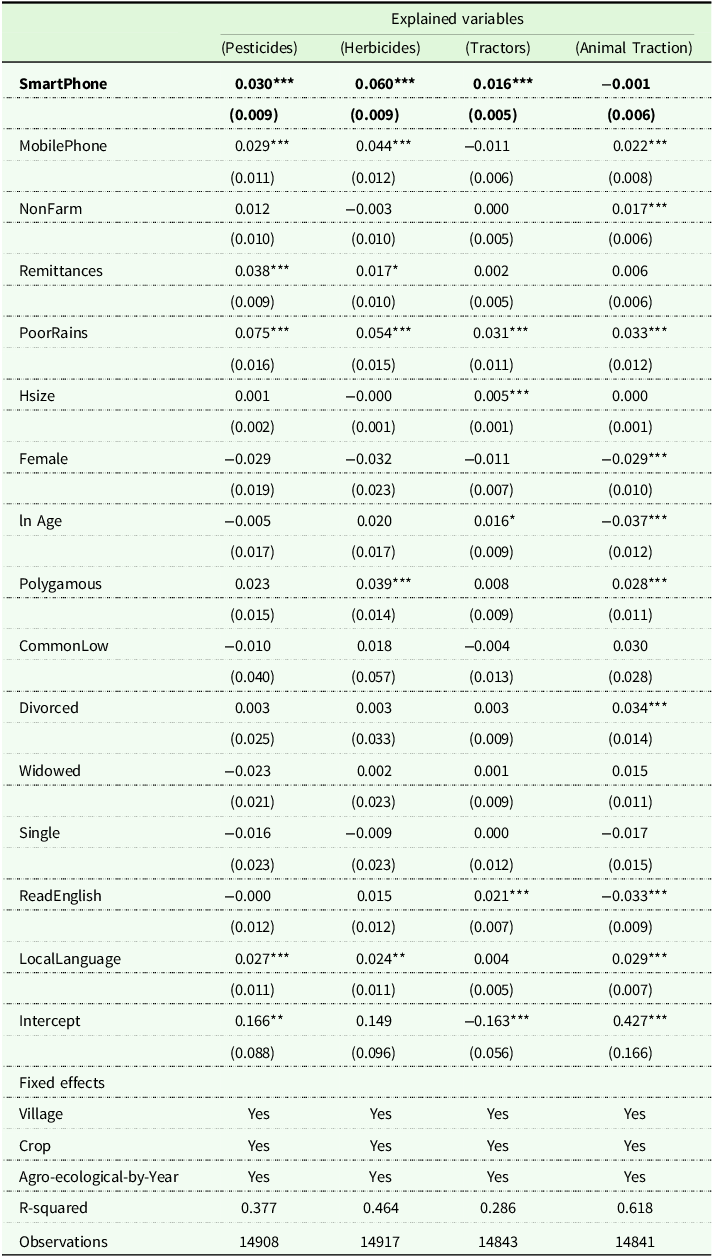
Table 7. Matching estimates: pesticides, herbicides, tractors, and animal traction

Notes: Standard errors are in parentheses; *( $p \lt 0.10$
); **(
$p \lt 0.10$
); **( $p \lt 0.05$
); ***(
$p \lt 0.05$
); ***( $p \lt 0.01$
).
$p \lt 0.01$
).
Turning to the main results, we find that the entropy balancing estimates are broadly consistent with the OLS results, reinforcing the robustness of our findings. From Table 6, smartphone ownership is associated with a 6.1% higher likelihood of hiring non-family labor, a 1.9% higher likelihood of using inorganic fertilizers, a 3.1% higher likelihood of using organic fertilizers to improve soil fertility, and a 3.4% higher likelihood of using insecticides for pest control. These effects are statistically significant and of similar magnitude to those obtained from our most demanding OLS specifications.
The adoption of modern agricultural inputs and technologies is widely recognized as a key pathway to improving yields and generating marketable surpluses. In this context, our results suggest that smartphones may facilitate technology uptake by reducing information frictions, improving coordination, and enhancing access to both input and output markets. These findings are consistent with Geffersa and Tabe-Ojong (Reference Geffersa and Tabe-Ojong2024) and Tabe Ojong et al. (Reference Tabe Ojong, Hauser and Mausch2022), who document persistent positive effects of market participation on smallholder farmers’ welfare.
Regarding the effects of other covariates, the results indicate that ownership of regular mobile phones also positively influences the likelihood of adopting modern agricultural inputs and technologies. This suggests that mobile communication in general, not only smartphones, plays a role in facilitating technology uptake. Additionally, the results suggest that receiving remittances has a significant positive impact on the probability of hiring paid labor, as well as on the use of pesticides and herbicides, highlighting the role of external financial resources in enabling investment in productive inputs.
Interestingly, rural households experiencing poor rainfall conditions tend to intensify their agricultural practices; the likelihood of adopting all the modern inputs and technologies considered (except for inorganic fertilizers) increases under such adverse climatic shocks. This finding aligns with the results of Jagnani et al. (Reference Jagnani, Barrett, Liu and You2021), who emphasize the role of climate stress in shaping farmers’ adaptation strategies.
Another key determinant of adoption is literacy in local languages, which significantly increases the probability of utilizing modern inputs and technologies, likely by improving access to information and comprehension of extension services.
Finally, household characteristics such as gender and age appear to have more limited effects, with significant impacts observed only for the adoption of animal traction. This suggests that decisions around mechanization and traditional farm power may be more sensitive to demographic factors than the uptake of chemical or organic inputs.
Concluding remarks
This paper examines the extent to which smartphone ownership influences the adoption of modern agricultural inputs and technologies among rural households in Nigeria during the 2018–2019 period. Using comprehensive household-level data and employing the entropy balancing approach to mitigate omitted variable bias associated with smartphone ownership, our results provide suggestive evidence of its positive effect on farmers’ behavior.
These findings align with the existing literature on the impact of mobile phones on various agricultural processes. While research focusing specifically on smartphones remains limited, much of the prior work centers on basic mobile phones. Our study contributes to this growing literature by highlighting the distinct role of smartphones, which, as more advanced digital tools, empower farmers by facilitating easier access to information, enabling the use of digital services, and simplifying labor hiring. Consequently, smartphones serve as effective agricultural tools for rural Nigerian farm households, even among farmers who may not fully recognize their importance in the agricultural production process.
The limited adoption of modern agricultural inputs remains one of the major constraints to agricultural income growth and poverty reduction in sub-Saharan Africa (Koussoubé and Nauges, Reference Koussoubé and Nauges2017; Suri and Udry, Reference Suri and Udry2022), given the high dependence of rural livelihoods on agriculture. This study is motivated by the widely held view that smartphone ownership increases the likelihood of adopting modern agricultural inputs, thereby boosting productivity and income levels. As such, the results have important implications for policies aiming to increase agricultural incomes and promote the adoption of modern technologies among rural households. These policies have the potential to raise farm incomes and foster broader agricultural development, especially in Nigeria, where numerous studies document persistently low adoption rates of modern technologies despite extensive agricultural interventions (Liverpool-Tasie et al., 2017; Liverpool-Tasie, Reference Liverpool-Tasie2017).
Despite its strengths and novel contribution, the study has some limitations worth noting. First, it relies on cross-sectional data, which prevents capturing permanent, unobservable factors that typically shape technology adoption in sub-Saharan Africa. Therefore, our findings should be interpreted with caution and cannot be generalized without reservation. We also advise caution against interpreting the results as strictly causal. Rather, we believe our findings represent a robust association between smartphone use and technology adoption, highlighting promising areas for further research with more rigorous causal designs.
Appendix A Household distribution across states
Table 8. Household distribution across states
Appendix B. Main crops grown by agroecological zone
Table 9. Main crops grown by agroecological zone

Table 10. Main crops grown by agroecological zone (…continue)

Appendix C. Entropy balancing: covariate balance in the first stage
Table 11. Covariate balance before entropy weighting
Notes: We have controlled for crop and AEZ-by-Year fixed effects in the first-stage
Table 12. Covariate balance after entropy weighting

Notes: We have controlled for crop and AEZ-by-Year fixed effects in the first-stage


 Open access