


Impact statement
This study demonstrates the potential of using automated behaviour classification based on accelerometer data and machine learning to address pressing questions related to the conservation and behavioural ecology of large African herbivores. We show that only a small number of individuals and a minimal set of feature variables are necessary for training a classifier that can accurately distinguish between 12 different behaviours. Our findings provide insights into how migratory springbok antelope respond to fences, revealing behavioural changes that would be difficult or impossible to detect using traditional observational methods. The ability to remotely monitor fine-scale behavioural responses to movement barriers enables a better understanding of the ecology and habitat use of antelope and other large herbivores. This can contribute to the development of conservation policies that balance human land use with wildlife movement requirements.
Introduction
Fences have become some of the most widespread anthropogenic barriers affecting terrestrial wildlife movement worldwide (Jakes et al., Reference Jakes, Jones, Paige, Seidler and Huijser2018). They serve a variety of purposes, such as managing livestock, limiting disease transmission and reducing human–wildlife conflict (Clevenger et al., Reference Clevenger, Chruszcz and Gunson2001; Mysterud and Rolandsen, Reference Mysterud and Rolandsen2019; Hyde et al., Reference Hyde, Breck, Few, Beaver, Schrecengost, Stone, Krebs, Talmo, Eneas, Nickerson, Kunkel and Young2022), but often also have unintended consequences. By restricting wildlife movement, fences alter movement patterns, limit access to resources and fragment habitats, ultimately leading to population declines (Mbaiwa and Mbaiwa, Reference Mbaiwa and Mbaiwa2006; McInturff et al., Reference McInturff, Xu, Wilkinson, Dejid and Brashares2020; Jones et al., Reference Jones, Jakes, Vegter and Verhage2022). These effects are particularly pronounced in dryland ecosystems, where food and water scarcity requires animals to travel long distances (Fryxell et al., Reference Fryxell, Wilmshurst, Sinclair, Haydon, Holt and Abrams2005; Abrahms et al., Reference Abrahms, Aikens, Armstrong, Deacy, Kauffman and Merkle2021). In such regions, the erection of wildlife-proof and livestock fencing has substantially disrupted the movements of medium-sized and large ungulates, leading to detrimental effects at the population and ecosystem levels (Whyte and Joubert, Reference Whyte and Joubert1988; Gadd, Reference Gadd, Somers and Hayward2012).
Fence ecology research has so far focused mainly on aspects such as crossing rates, mortality risk and changes in population distribution (Pokorny et al., Reference Pokorny, Flajšman, Centore, Krope and Šprem2017; Jones et al., Reference Jones, Jakes, Vegter and Verhage2022; Zoromski et al., Reference Zoromski, DeYoung, Goolsby, Foley, Ortega-Santos, Hewitt and Campbell2022). Relatively few studies, on the other hand, have investigated the behavioural responses of animals to fences. Nonetheless, the available evidence suggests that the impact of fences on animal behaviour may be ecologically significant. For example, pronghorn (Antilocapra americana) and mule deer (Odocoileus hemionus) have been observed to deviate from normal movement patterns in response to fences (Xu et al., Reference Xu, Gigliotti, Royauté, Sawyer and Middleton2023). In southern Africa, research on springbok (Antidorcas marsupialis) has shown increased energy expenditure near fences, possibly reflecting elevated stress levels or attempts at crossing (Hering et al., Reference Hering, Hauptfleisch, Jago, Smith, Kramer-Schadt, Stiegler and Blaum2022a). Furthermore, the movement speeds of antelope differ markedly depending on whether or not they are successful in crossing a fence (Hering et al., Reference Hering, Hauptfleisch, Kramer-Schadt, Stiegler and Blaum2022b).
The paucity of behavioural studies in this field can be attributed to the logistical challenges of directly observing animals, especially in cases where vegetation limits visibility, terrain is difficult to access, or observer presence disturbs animals. However, recent advances in bio-logging, particularly accelerometry, now allow for the remote monitoring of animal behaviour at high resolution over extended time periods (Brown et al., Reference Brown, Kays, Wikelski, Wilson and Klimley2013). Accelerometers can measure body motion along three axes – surge (front-back), heave (up-down) and sway (side-to-side) – enabling the inference of animal behaviour without the need for direct observation (Shepard et al., Reference Shepard, Wilson, Quintana, Gómez Laich, Liebsch, Albareda, Halsey, Gleiss, Morgan, Myers, Newman and McDonald2008). Various studies have applied machine learning algorithms to classify animal behaviour based on accelerometer data (Hammond et al., Reference Hammond, Springthorpe, Walsh and Berg-Kirkpatrick2016; Yu et al., Reference Yu, Deng, Nathan, Kröschel, Pekarsky, Li and Klaassen2021). This approach has been used on a variety of taxa including birds (Chimienti et al., Reference Chimienti, Cornulier, Owen, Bolton, Davies, Travis and Scott2016; Schreven et al., Reference Schreven, Stolz, Madsen and Nolet2021), fish (Brewster et al., Reference Brewster, Dale, Guttridge, Gruber, Hansell, Elliott, Cowx, Whitney and Gleiss2018) and mammals, both captive (Barwick et al., Reference Barwick, Lamb, Dobos, Welch, Schneider and Trotter2020; Brandes et al., Reference Brandes, Sicks and Berger2021) and free-ranging (Fehlmann et al., Reference Fehlmann, O’Riain, Hopkins, O’Sullivan, Holton, Shepard and King2017; Chakravarty et al., Reference Chakravarty, Cozzi, Dejnabadi, Léziart, Manser, Ozgul and Aminian2020). Once a classifier has been trained on ground-truthed data, it can be deployed to infer behaviour in wild populations (Rast et al., Reference Rast, Kimmig, Giese and Berger2020; Giese et al., Reference Giese, Melzheimer, Bockmühl, Wasiolka, Rast, Berger and Wachter2021).
In this study, we apply supervised machine learning to high-resolution accelerometer data to examine how fences affect the behaviour of springbok. We first develop and validate a classifier capable of identifying multiple behavioural categories and subsequently apply it to analyse behavioural responses to fence encounters. Specifically, we ask the following research questions: (1) Do the relative frequencies of behaviours change during and after fence encounters compared to before? (2) Are any such behavioural changes further affected by whether animals cross a fence when they encounter it compared to when they do not? By investigating these behavioural responses, our study provides insight into the consequences of anthropogenic barriers for a migratory ungulate species, thereby contributing to the emerging field of fence ecology (McInturff et al., Reference McInturff, Xu, Wilkinson, Dejid and Brashares2020).
Methods
Study area and species
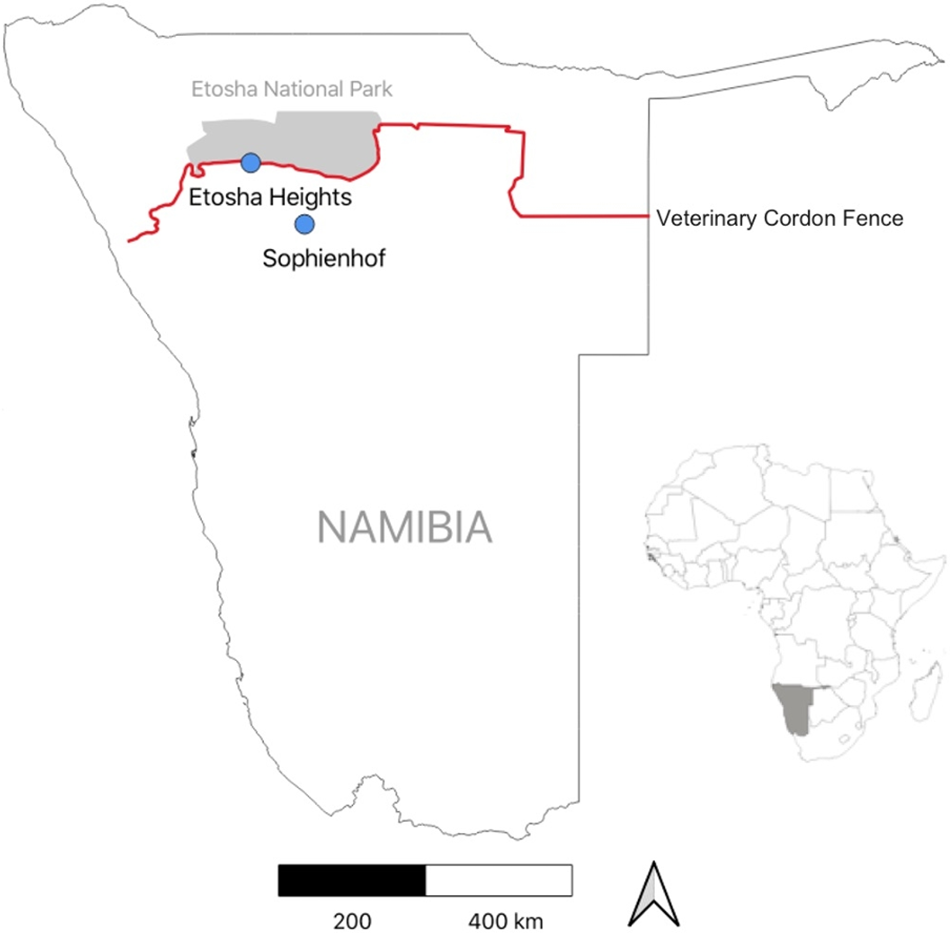
We conducted our study on springbok behaviour in the Etosha region of northern Namibia (Figure 1), which is characterised by a semi-arid climate. Rainfall is highly variable and occurs from October to April (green season; mean temperature: 26 °C), while the cooler dry season spans from May to September (mean temperature: 18 °C). Mean annual precipitation in the region ranges from 250 mm to 350 mm, based on CHIRPS data (Funk et al., Reference Funk, Peterson, Landsfeld, Pedreros, Verdin, Shukla, Husak, Rowland, Harrison, Hoell and Michaelsen2015), with precipitation increasing from south-west to north-east. The vegetation in the study area consists of a mix of grasses, shrubs and trees. Dominant plant species include Colophospermum mopane, Terminalia and Combretum species, Catophractes alexandrii, Vachellia nebrownii and Senegalia mellifera.

Figure 1. Study area with locations of the two study sites in northern Namibia. For ground-truthing, we observed behaviour of three collared springbok at the Sophienhof private game reserve. For predicting fence behaviour, acceleration data of eight collared springbok were recorded at the Etosha Heights private reserve.
Behavioural observations for supervised classification were conducted at the Sophienhof private game reserve (20°07′S, 16°03′E), located approximately 10 km west of the town of Outjo (Figure 1). The reserve, which covers an area of 23 km2, has several artificial waterholes and is surrounded by a game-proof fence. It is home to various indigenous large herbivore species, including springbok, gemsbok (Oryx gazella), greater kudu (Tragelaphus strepsiceros), common eland (Taurotragus oryx), blue wildebeest (Connochaetes taurinus) and giraffe (Giraffa camelopardalis). Large predators, such as leopard (Panthera pardus) and hyena (Crocuta crocuta), may occasionally also be present. The landscape consists of savanna, grasslands, rocky terrain and shrublands. Wildlife is habituated to the presence of game drive vehicles.
Springbok behaviour associated with fence encounters was analysed along a 70 km section of Namibia’s veterinary cordon fence, which separates Etosha National Park (22,941 km2) from the Etosha Heights private reserve (460 km2, 19°15′S, 15°13′E; Figure 1). The fence consists of two parallel lines, spaced 10 metres apart. The northern line is a 2.8-metre-high wildlife-proof fence, of which the lower 1.5 metres are covered with wire mesh. The southern fence line is a 1.5-metre-high stock-proof fence (Hering et al., Reference Hering, Hauptfleisch, Kramer-Schadt, Stiegler and Blaum2022b).
Springbok are medium-sized antelope endemic to southern Africa. They are found mostly in dry regions, such as the Namib, Kalahari and Karoo deserts, as well as in savannas (Kingdon, Reference Kingdon2015). Adult females weigh 37 kg on average (Skinner and Chimimba, Reference Skinner and Chimimba2005). They are mixed feeders and can adapt their diet according to food availability, typically grazing in summer and browsing in winter and during droughts (Kingdon, Reference Kingdon2015). They are highly mobile, both seasonally, in response to rainfall and vegetation greenness (Kingdon, Reference Kingdon2015) and within seasons (Hering et al., Reference Hering, Hauptfleisch, Jago, Smith, Kramer-Schadt, Stiegler and Blaum2022a).
Behaviour classification
We deployed collars equipped with tri-axial accelerometers (collar model 1d, weighing 320 g, e-obs GmbH, Grünwald, Germany) on three springbok for direct observation on Sophienhof. The collars were fitted by darting the animals with the assistance of a registered veterinarian. We colour-coded the collars of the three individuals for easy identification during behavioural observations. Body acceleration was sampled along three axes at 33 Hz over 3.3 seconds per burst. Two consecutive bursts were recorded every 30 seconds. In one instance, the accelerometer was positioned ventrally along the neck, which caused a change in the orientation of the accelerometer axes compared to the dorsally positioned accelerometers. We adjusted the axis values to account for this shift. Temporary collar rotations were occasionally observed but were left unadjusted to enhance the robustness of the classifier.
We recorded on video the behaviour of the three collared springbok at the time of acceleration measurements between October and November 2021 during daylight hours. The animals were tracked in the field using a UHF receiver (AOR AR8200, Tokyo, Japan) and a hand-held directional Yagi antenna. Most observations were made from a vehicle, though some were conducted from hides, allowing us to observe the animals at distances of 40–70 metres. To synchronise acceleration data with behavioural observations, we filmed the network-synchronised (NTP) local time displayed on a mobile phone as part of each video recording and matched this to the GPS time recorded by the collar.
Behavioural data were analysed using BORIS (Behavioural Observation Research Interactive Software; Friard and Gamba, Reference Friard and Gamba2016). The recorded behavioural categories were defined by neck tilt, locomotion and body posture. In an iterative process outlined by Yu and Klaassen (Reference Yu and Klaassen2021), we reduced the initial pre-selection of behavioural categories to 12, based on both ecological considerations and similarities in acceleration data. In most cases, a single behaviour spanned the entire length of 3.3 seconds. Bursts with behavioural transitions were excluded. In total, 3,952 acceleration bursts were labelled for supervised learning.
All other analyses were conducted in R (R Core Team, 2024). The behaviour classifier was based on a gradient-boosted decision tree algorithm, implemented in the rabc package (version 0.1.0; Yu and Klaassen, Reference Yu and Klaassen2021). The package workflow includes visualising raw accelerometer data, extracting features from the accelerometer data that can help distinguish between different behaviours and selecting the most informative features for behaviour classification, as well as model training, testing and application.
We calculated 28 feature variables from each accelerometer burst using the rabc package. These included time-domain features (the mean, variance, standard deviation, maximum, minimum and range of accelerometer values for each axis, as well as overall dynamic body acceleration, ODBA) and frequency-domain features (main frequency, main amplitude and frequency entropy for each axis, calculated via Fast Fourier Transform). The rabc package uses stepwise forward selection to identify the most relevant features for classification. We applied this process separately to the dataset of each observed individual as well as to the pooled dataset of all three individuals. The classification achieved an overall accuracy of 0.85–0.91 with five selected features, which provided a good balance between accuracy and model simplicity. Feature sets were largely consistent across the datasets. For the final feature set, we selected the main amplitude of the x-axis, mean of the x-axis values, variance of the y-axis values, frequency entropy of the z-axis and main frequency of the x-axis.
We validated the classification performance using two approaches. First, the leave-one individual-out (LOIO) approach was used to assess the model’s ability to classify acceleration data from new individuals. In this approach, two individuals’ data were used for model training, while the remaining individual was used for validation. Thus, three classification models were fitted, and each of the three individuals was used for validation once. The behavioural categories sleeping and salt-licking were only observed in one individual and were therefore excluded from the models in the LOIO approach. Second, in the pooled approach, a five-fold cross-validation was used to evaluate classification performance across the entire dataset of three individuals. Here, the data were randomly split into five parts, where four parts were used to train the model and the remaining part was used for validation. This was done five times so that each of the five parts was used for validation once. The default settings of the rabc package for hyper-parameter tuning (the process of optimising the settings of a machine learning model to improve its performance) were used as they yielded the highest accuracies (Yu and Klaassen, Reference Yu and Klaassen2021).
Classification performance was evaluated using precision, recall (sensitivity), specificity and balanced accuracy (the average of the sensitivity and specificity), calculated using the caret package (version 6.0-92; Kuhn, Reference Kuhn2008). Balanced accuracy was preferred to overall accuracy given that the dataset was imbalanced (García et al., Reference García, Mollineda, Sánchez, Araujo, Mendonça, Pinho and Torres2009). A confusion matrix plot visualised the prediction accuracy for each behavioural category (Figure 3).
Behavioural responses to fence encounters
Eight springbok were collared on Etosha Heights for studying behavioural responses to fences. As in the case of the three study animals on Sophienhof, all individuals were adult females in good physical condition. Accelerometer data were collected over a 2-year period (mid-2019 to late 2021). Acceleration bursts were recorded at 33 Hz for 3.3 seconds at 5-minute intervals. Bursts were categorised into three temporal groups relative to fence encounters: 45 minutes before, during (minimum 15 minutes) and 45 minutes after the encounter. We used the classifier trained on the pooled labelled dataset (mentioned above) to infer springbok behaviour associated with encounters with the veterinary cordon fence.
To examine the behavioural responses of springbok to fence encounters, we fitted generalised linear mixed models (GLMMs) with binomial response distributions using the R package lme4 (v1.1-37; Bates et al., Reference Bates, Mächler, Bolker and Walker2015). For each of the five most frequent behaviours, we modelled the probability of occurrence as a function of the time period relative to the encounter (“before”, “during”, “after”), encounter type (“cross” vs. “non-cross”) and their interaction. Random intercepts were included for both animal ID and encounter ID to account for repeated measures. In a post hoc analysis, estimated marginal means (EMMs) were computed for each behaviour to quantify differences across time periods within each encounter type. Pairwise comparisons between time levels (before vs. during vs. after) were adjusted using Tukey’s method.
Results
Behaviour classification
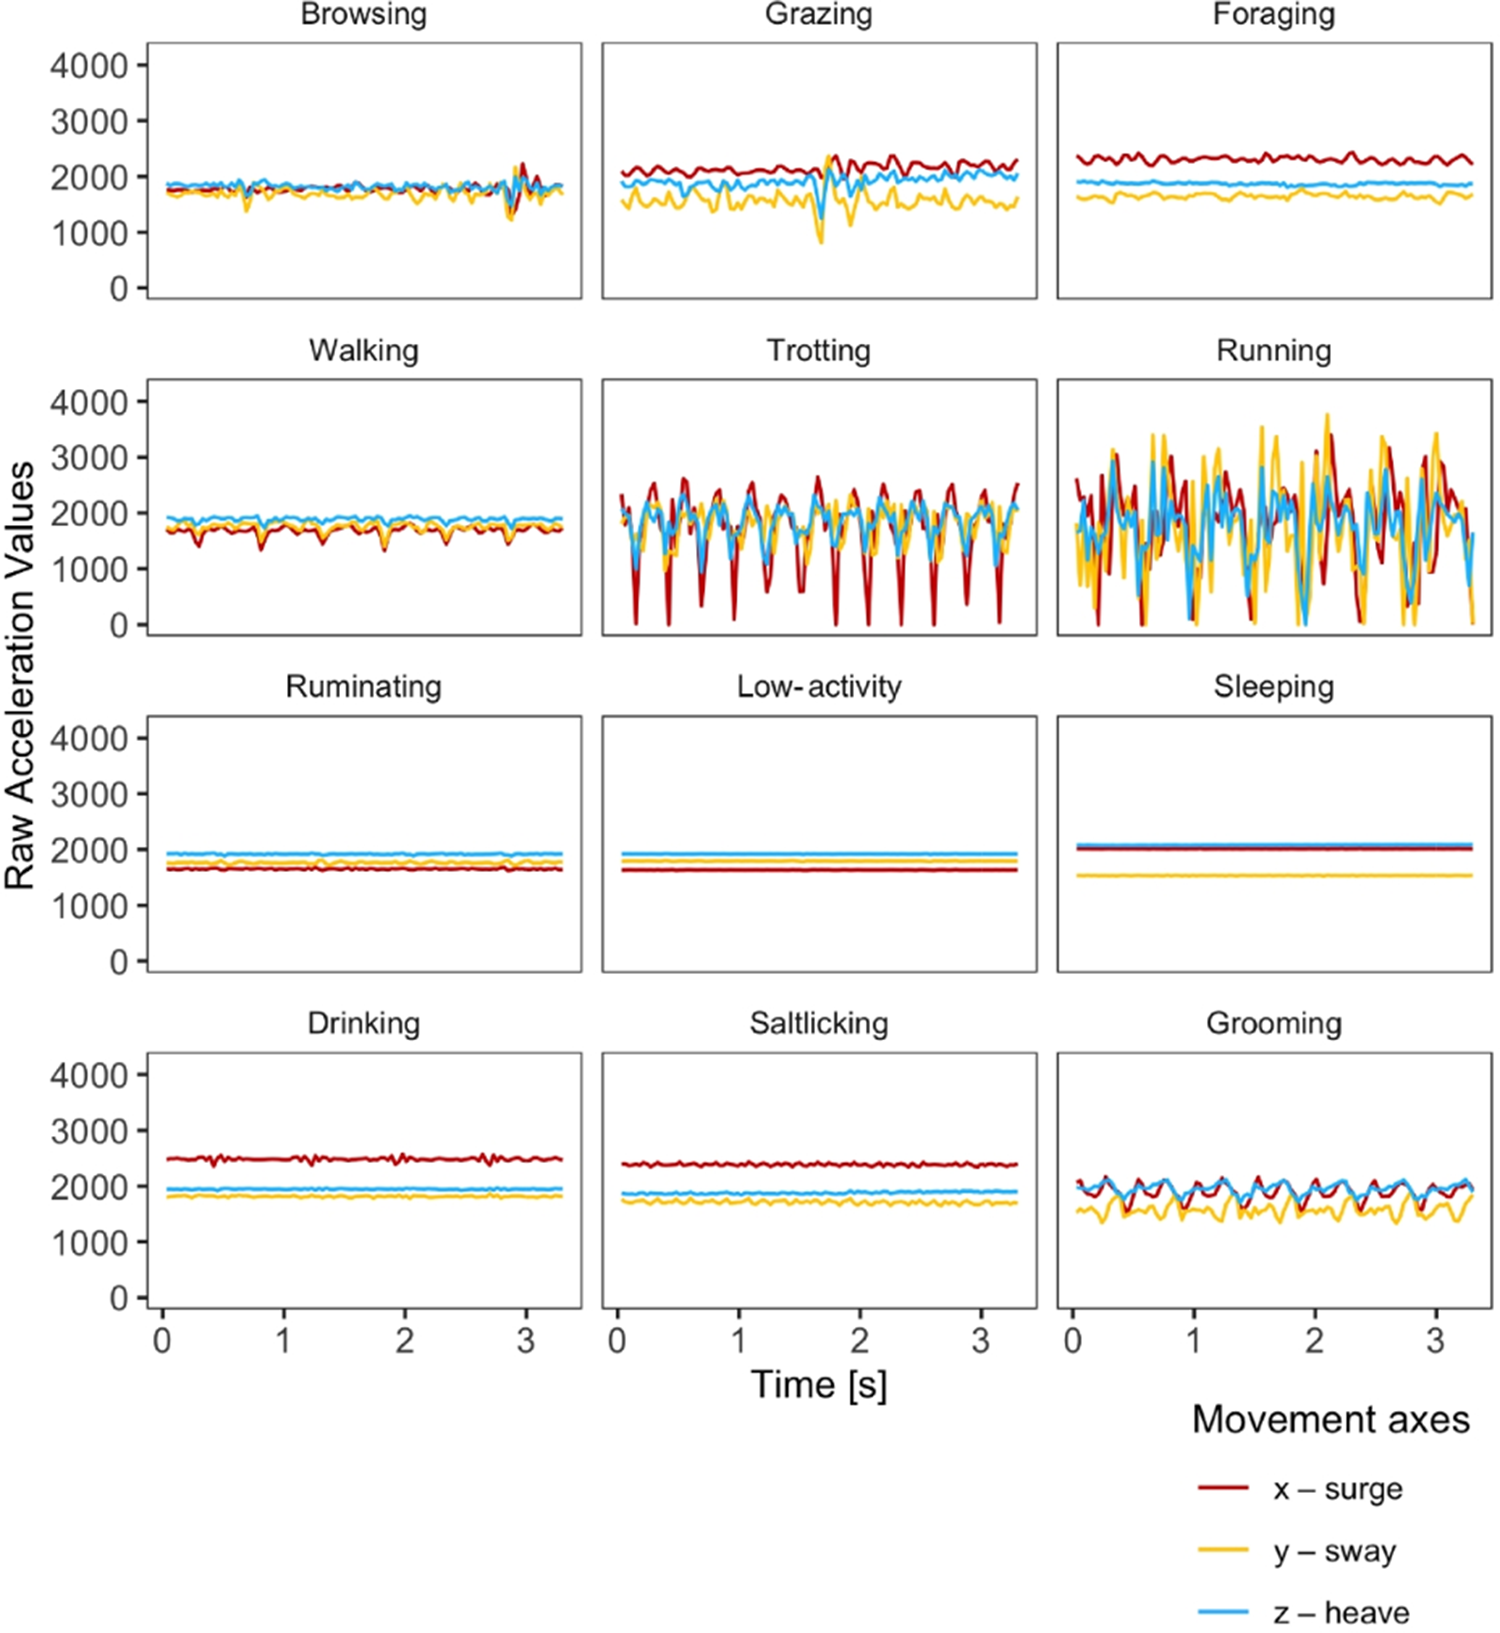
Over 50 hours of video material (>15 hours per individual) were analysed, resulting in a total of 3,952 ground-truthed accelerometer bursts used for model training and testing. The number of observations were balanced across individuals but imbalanced across behavioural categories. The most prevalent categories were ruminating with 240–444 bursts per individual, followed by walking with 265–400 bursts per individual. Among the rarely observed categories was drinking with 7–24 bursts per individual. Representative acceleration patterns for each of the 12 behavioural categories are shown in Figure 2.

Figure 2. Representative acceleration patterns for each of the 12 behavioural categories in springbok. The y-axis shows the raw output of the tri-axial accelerometers and the x-axis shows the time, i.e., length of one burst. In the tri-axial accelerometers used, the x-axis represents surge, the y-axis sway and the z-axis heave.
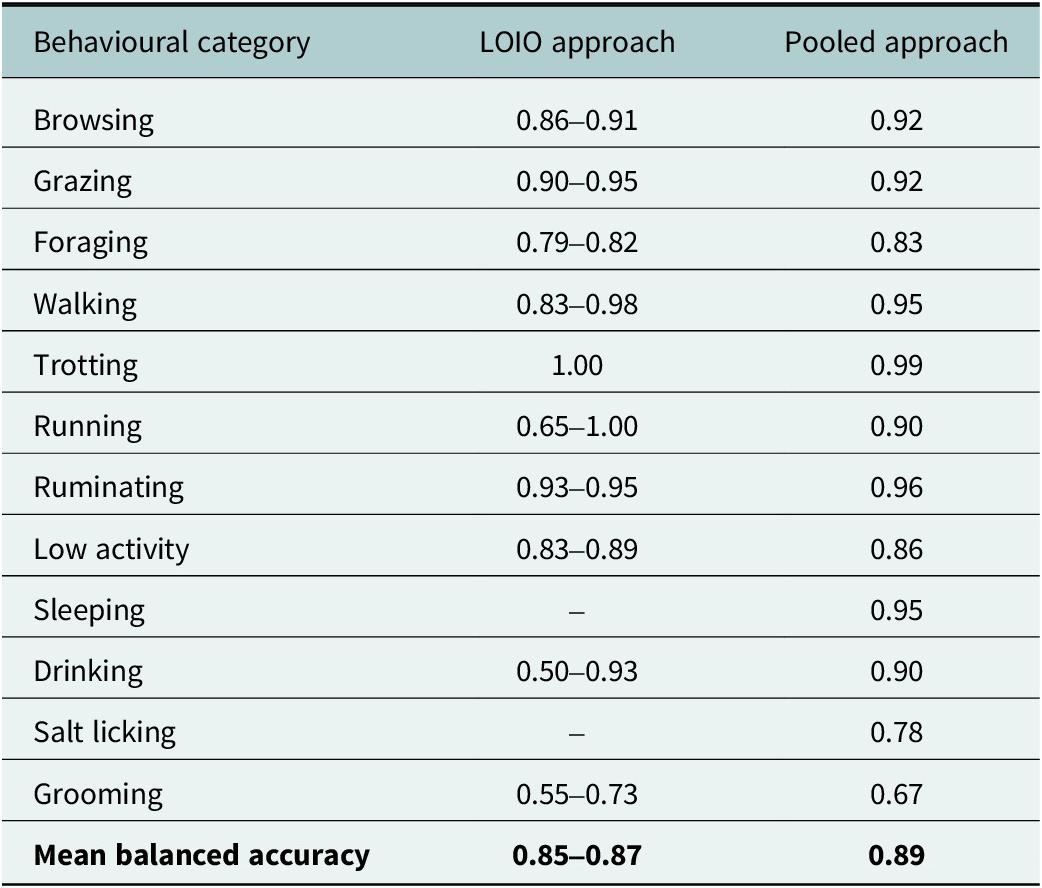
In the LOIO approach, the classification performance differed between behavioural categories as well as between validation datasets (Table 1). Balanced accuracy for browsing, grazing, ruminating, walking, trotting and low-activity were all above 80%. Categories with a lower accuracy for at least one validation dataset were drinking, grooming and running, probably due to the small number of behavioural observations. However, only grooming showed a low balanced accuracy in all three LOIO models.
Table 1. Proportion of mean balanced accuracy per behavioural category for the leave one-individual-out (LOIO) approach and the pooled cross-validation approach trained on all three individuals. Sleeping and salt-licking were not observed in every springbok and were excluded from the LOIO approach (“–”).

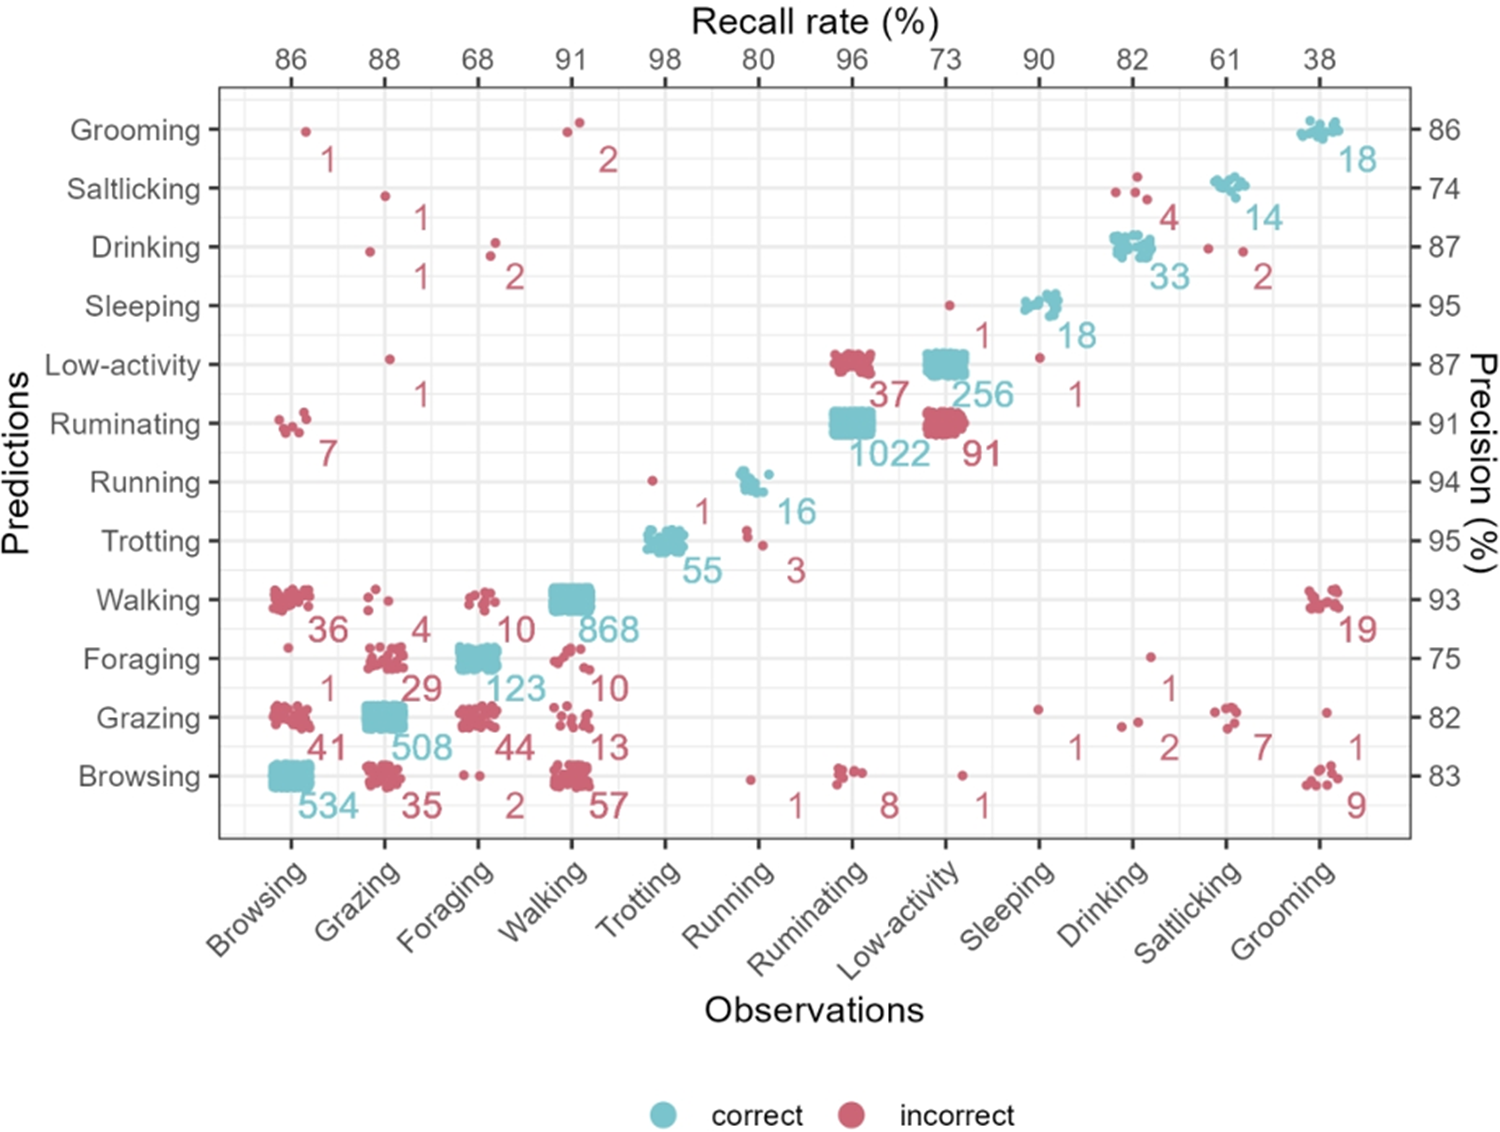
In the pooled cross-validation approach, we achieved a mean balanced accuracy of 89%. The majority of behavioural categories could be predicted with high accuracies above 90%. All but two categories ranged between 83% and 99% accuracy (grooming with 67% and salt-licking with 78%; Table 1). Categories characterised by similar body posture or movement characteristics – such as between browsing, grazing, foraging and walking or between low-activity and ruminating – were more likely to be confused (Figures 2 and 3).

Figure 3. Confusion matrix of the 12 behavioural categories of springbok based on the five-fold cross-validation results using the pooled dataset. Blue dots represent correct predictions, red dots represent incorrect predictions. Numbers indicate the number of bursts for each combination of prediction and observation. The recall rate (correctly predicted/total observations) per behavioural category is indicated at the top of the figure, while precision (correctly predicted/total predictions) is indicated on the right.
Behavioural responses to fence encounters
In total, behaviour was classified for 29,370 accelerometer bursts recorded on eight springbok before, during and after 949 encounters with the veterinary cordon fence, amounting to 30.9 ± 13.9 bursts per encounter. The bursts were unevenly distributed among individuals (1,287–8,613 bursts per individual; χ-squared = 9277.5, df = 7, p < 0.001). The most frequently predicted behaviour was grazing (26.5%), followed by walking (23.4%), browsing (17.7%), low-activity (12.0%), ruminating (7.6%), foraging (6.6%), drinking (2.3%) and sleeping (1.9%). Grooming, trotting, running and salt-licking were rarely detected (≤ 1% each) in the acceleration data. Low-activity and sleeping were lumped together as resting behaviour.
For the five most frequent behaviours – browsing, grazing, walking, ruminating and resting – we found significant interaction effects between the time period relative to the fence encounter (before, during and after) and the type of encounter (non-crossing or crossing, Table 2). Additionally, random intercept variances were observed for both animal ID and encounter ID across most behaviours (Table 3), indicating considerable variation between individuals as well as between fence encounters.
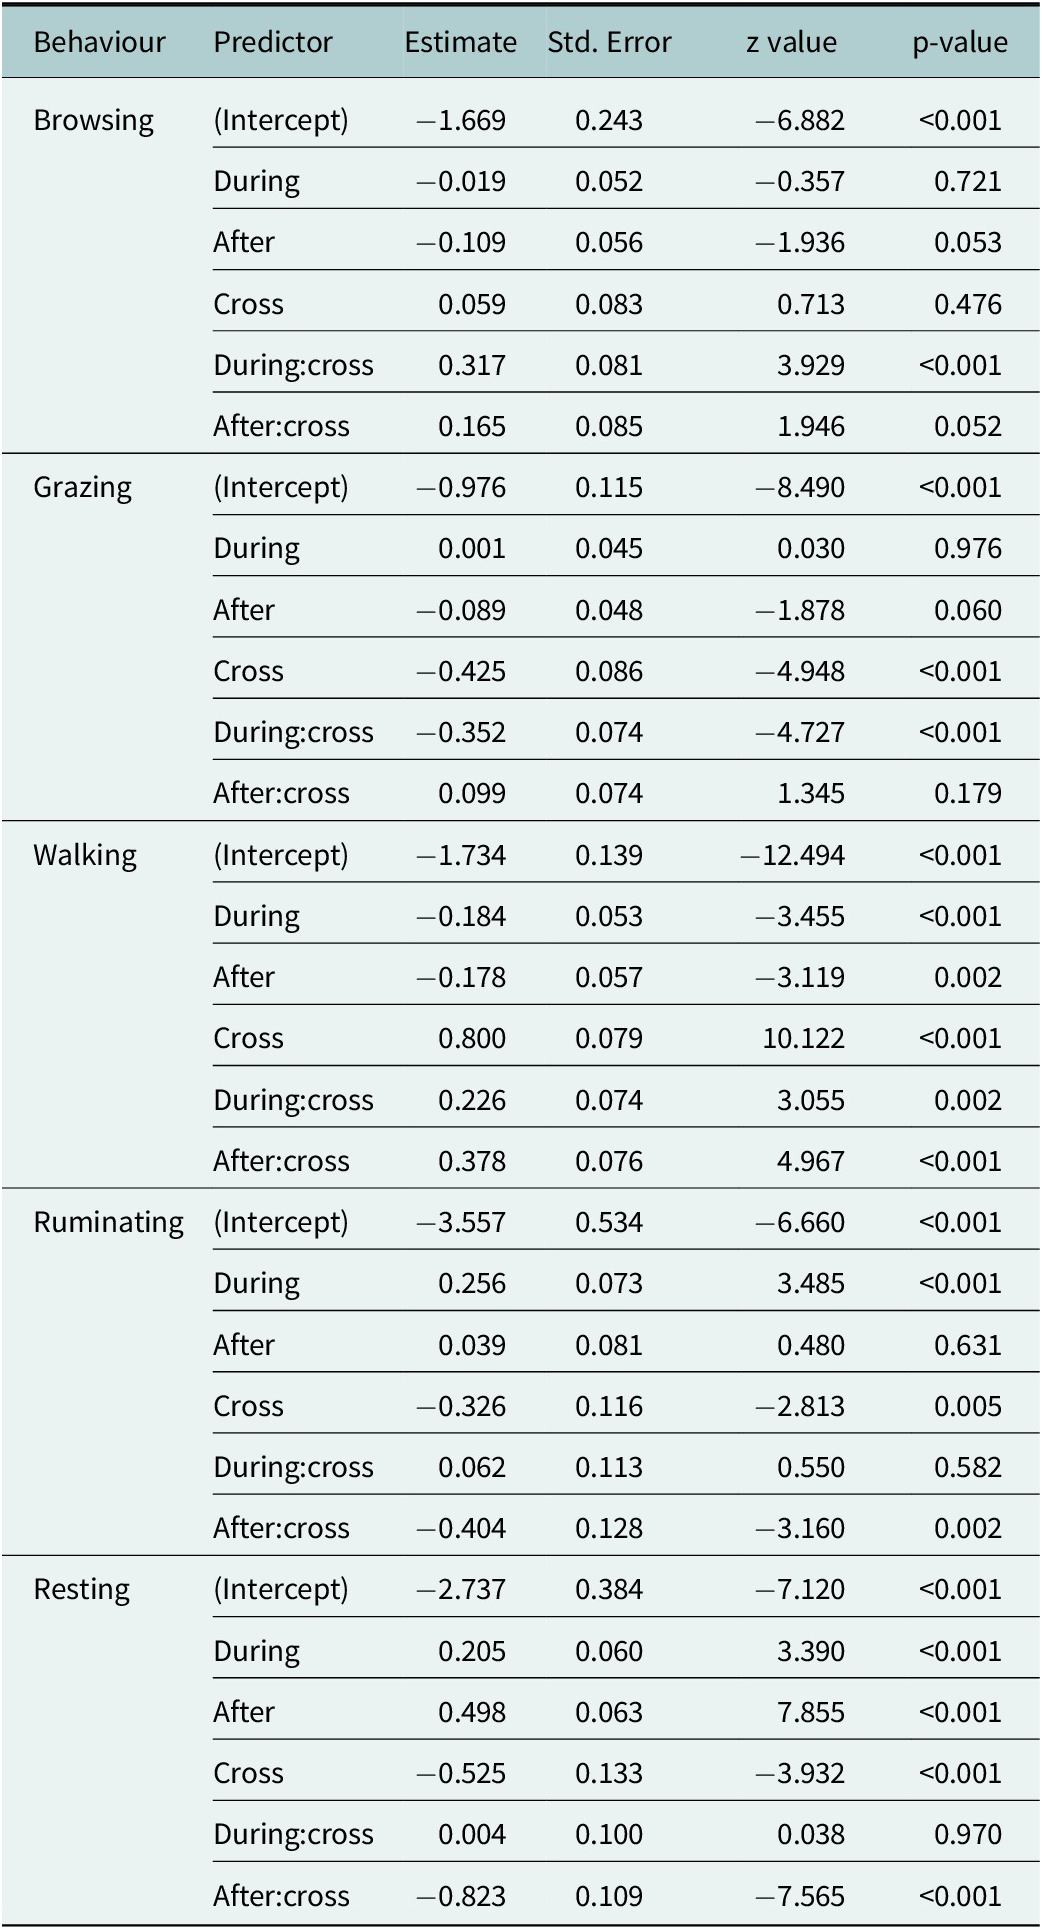
Table 2. Fixed effects from generalised linear mixed models (GLMMs) predicting the probability of exhibiting each behaviour (browsing, grazing, walking, ruminating and resting) as a function of time relative to the fence encounter (before, during, after), the type of encounter (crossing or non-crossing) and their interaction. All models were fitted with a binomial response distribution using a logit link function. Estimates are shown on the log-odds scale.

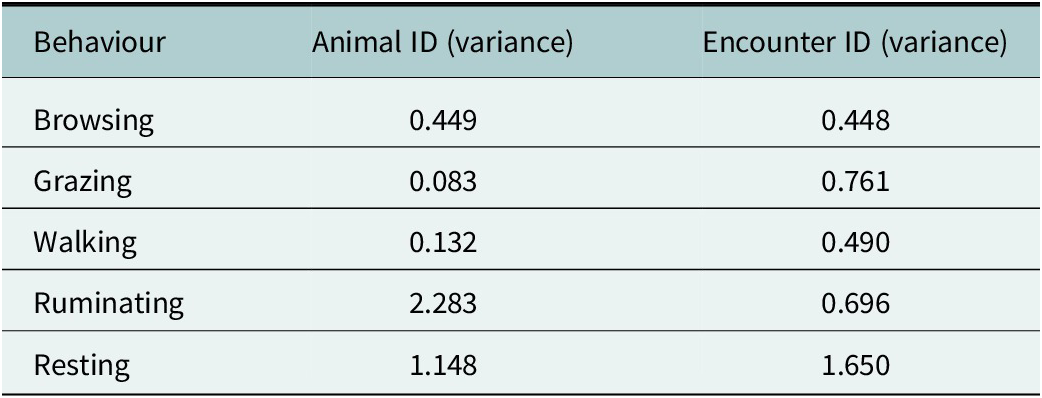
Table 3. Random intercept variance estimates from GLMMs for each behaviour, showing between-individual (animal ID) and between-encounter (encounter ID) variation. These random effects account for repeated behavioural observations within animals and encounters, allowing for generalisation beyond sampled individuals and events.

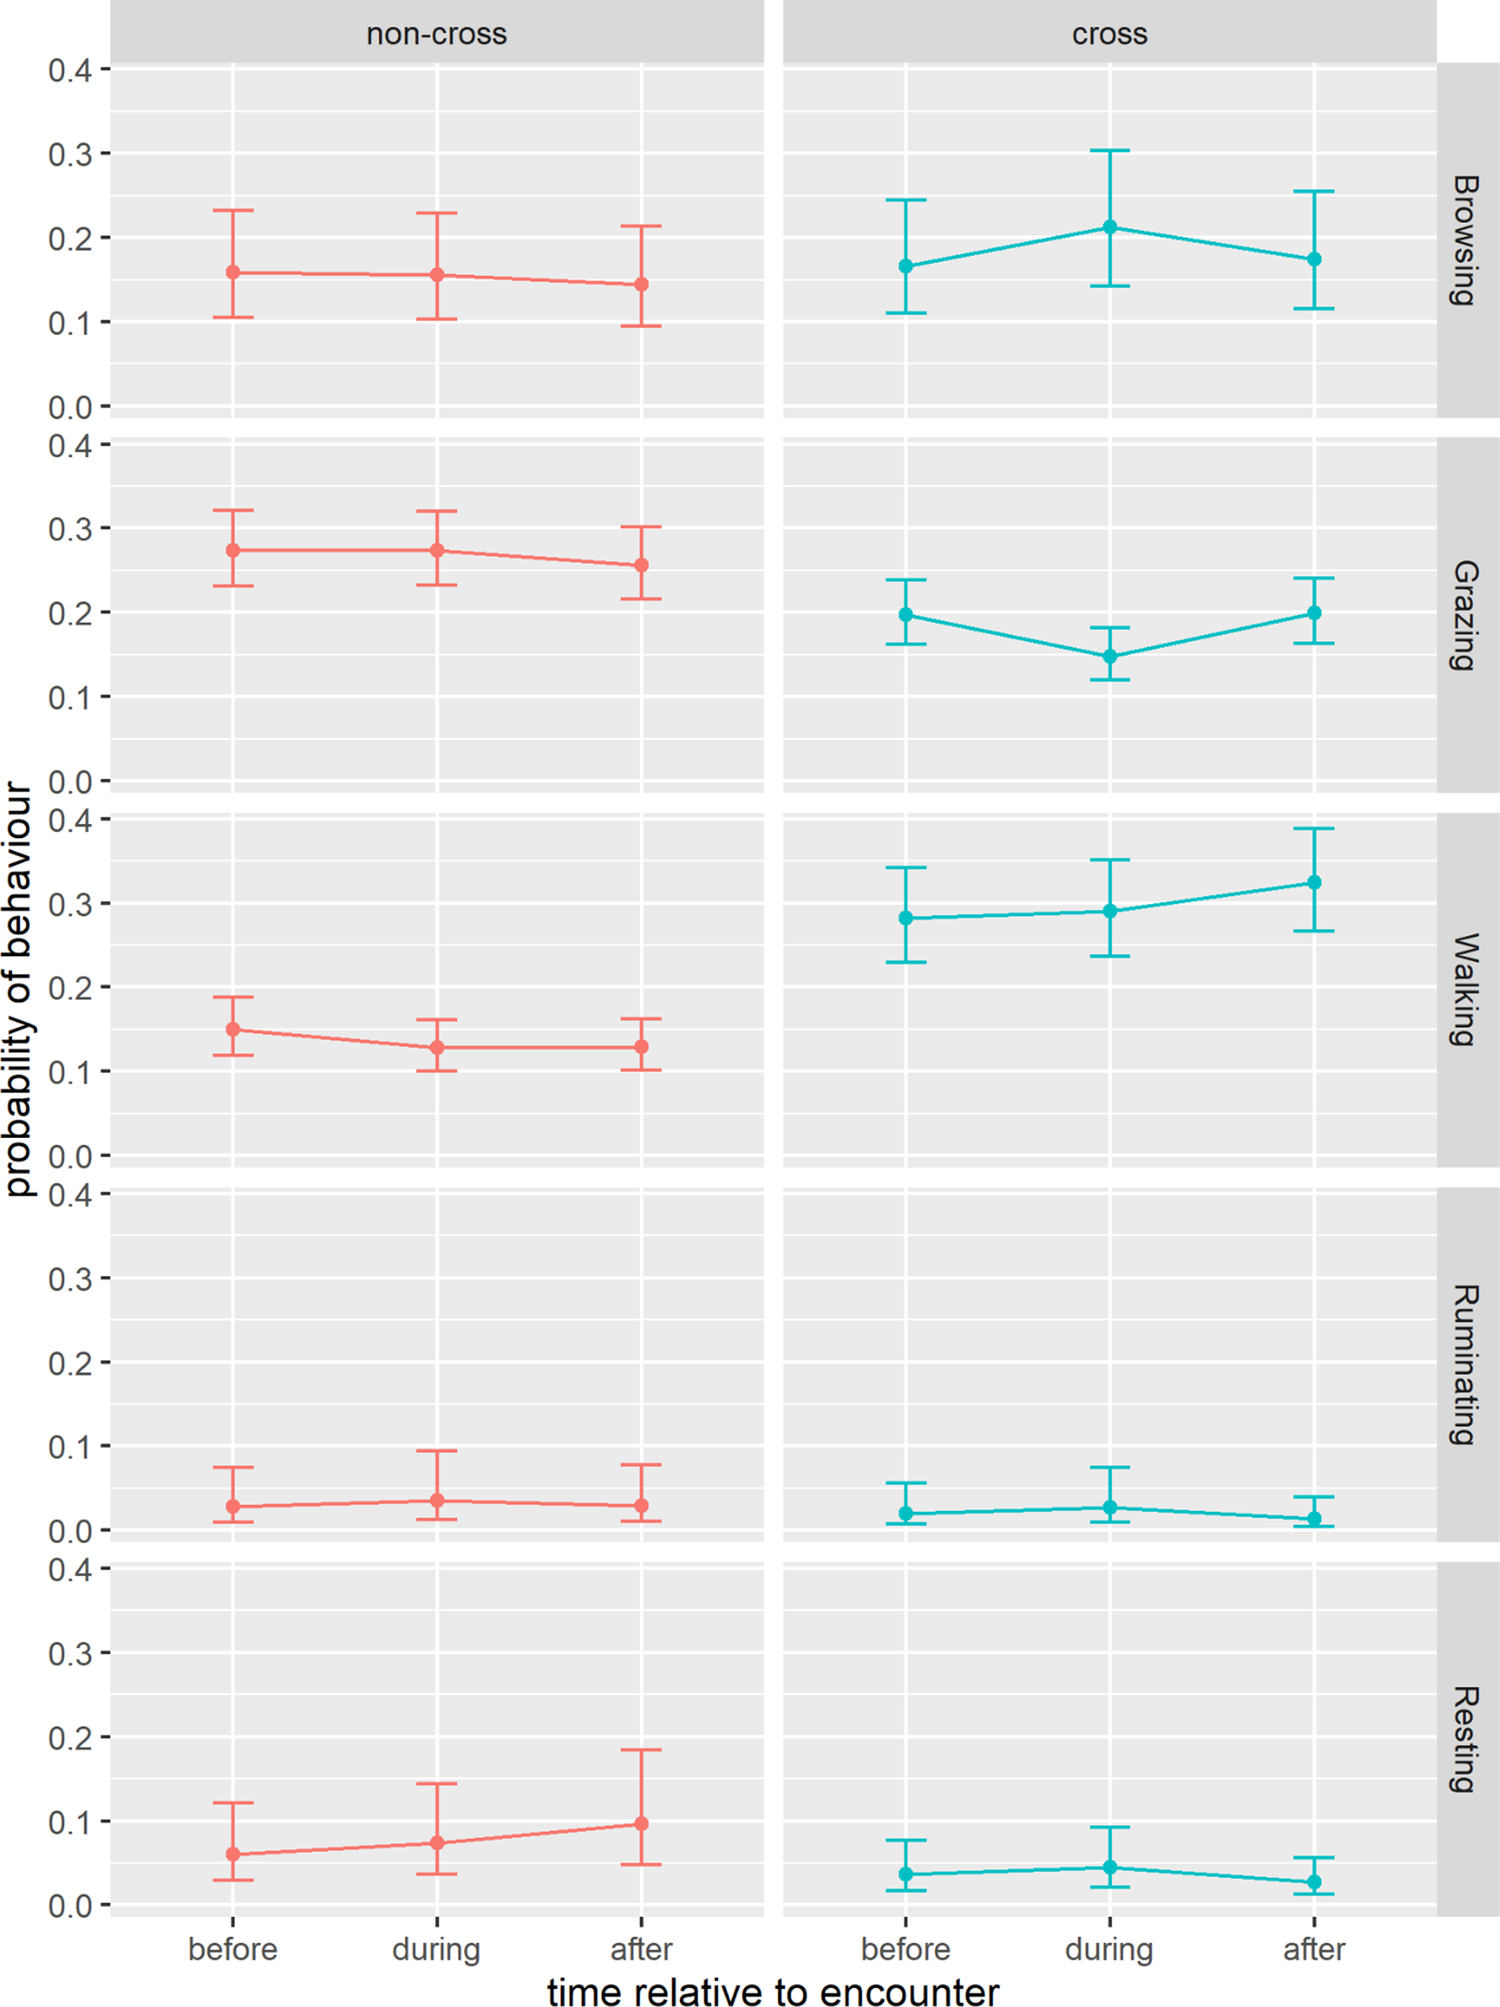
Figure 4 addresses our research questions on (1) behavioural changes associated with fence encounters and (2) differences between crossing and non-crossing events by illustrating how behaviour varied before, during and after each type of encounter. For browsing, there was little evidence of change across time periods in the case of non-crossing encounters. However, during fence crossings, browsing significantly increased compared to the period before and then returned to pre-encounter levels afterward. Similar to browsing, grazing showed no significant changes in the case of non-crossing encounters. In contrast, grazing decreased significantly during fence crossings but returned to pre-encounter levels after the crossing. Walking slightly decreased both during and after non-crossing encounters relative to before. In crossing events, walking increased significantly after the crossing compared to both before and during. Ruminating increased during non-crossing events and returned to pre-encounter levels afterward. Ruminating also increased during crossings but afterwards decreased to a level lower than before the crossing. Resting increased during non-crossing encounters and increased further after the encounter. In contrast, resting slightly increased during fence crossing but then decreased after the crossing to a level below that observed before the crossing. The supporting statistics for these behavioural changes in relation to fence encounters are given in Table 4.

Figure 4. Predicted probabilities (±95% confidence intervals) for each behaviour (browsing, grazing, walking, ruminating, resting) across the three time periods (before, during and after) relative to fence encounters, shown separately for each encounter type (crossing and non-crossing). Predictions are derived from generalised linear mixed models with binomial response distributions.
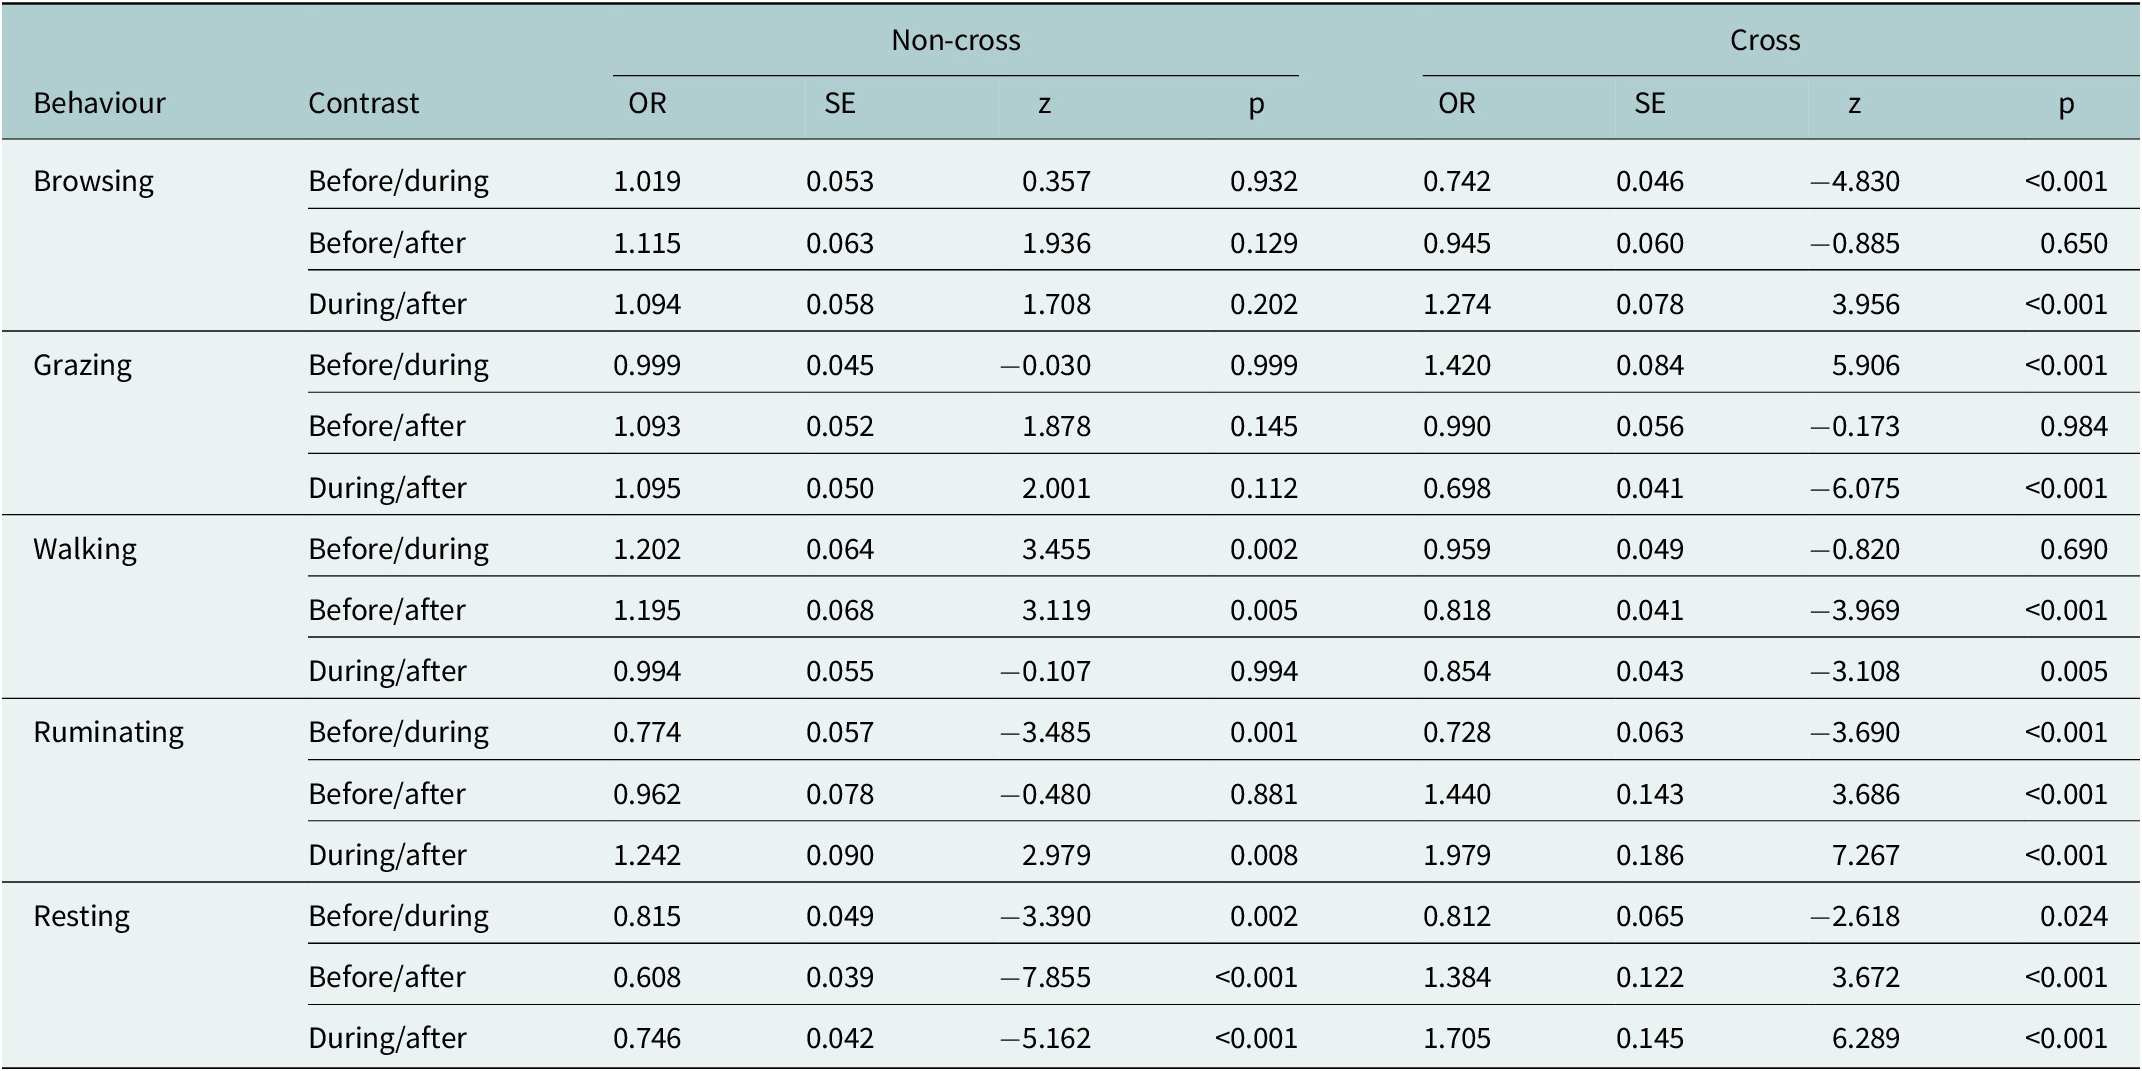
Table 4. Estimated pairwise comparisons (odds ratios) of behavioural probabilities before, during and after fence encounters for crossing and non-crossing events, based on GLMMs with binomial response distributions. Results are shown for five behaviours: browsing, grazing, walking, ruminating and resting. Tukey-adjusted p-values account for multiple comparisons within each behaviour. Tests were performed on the log odds ratio scale.

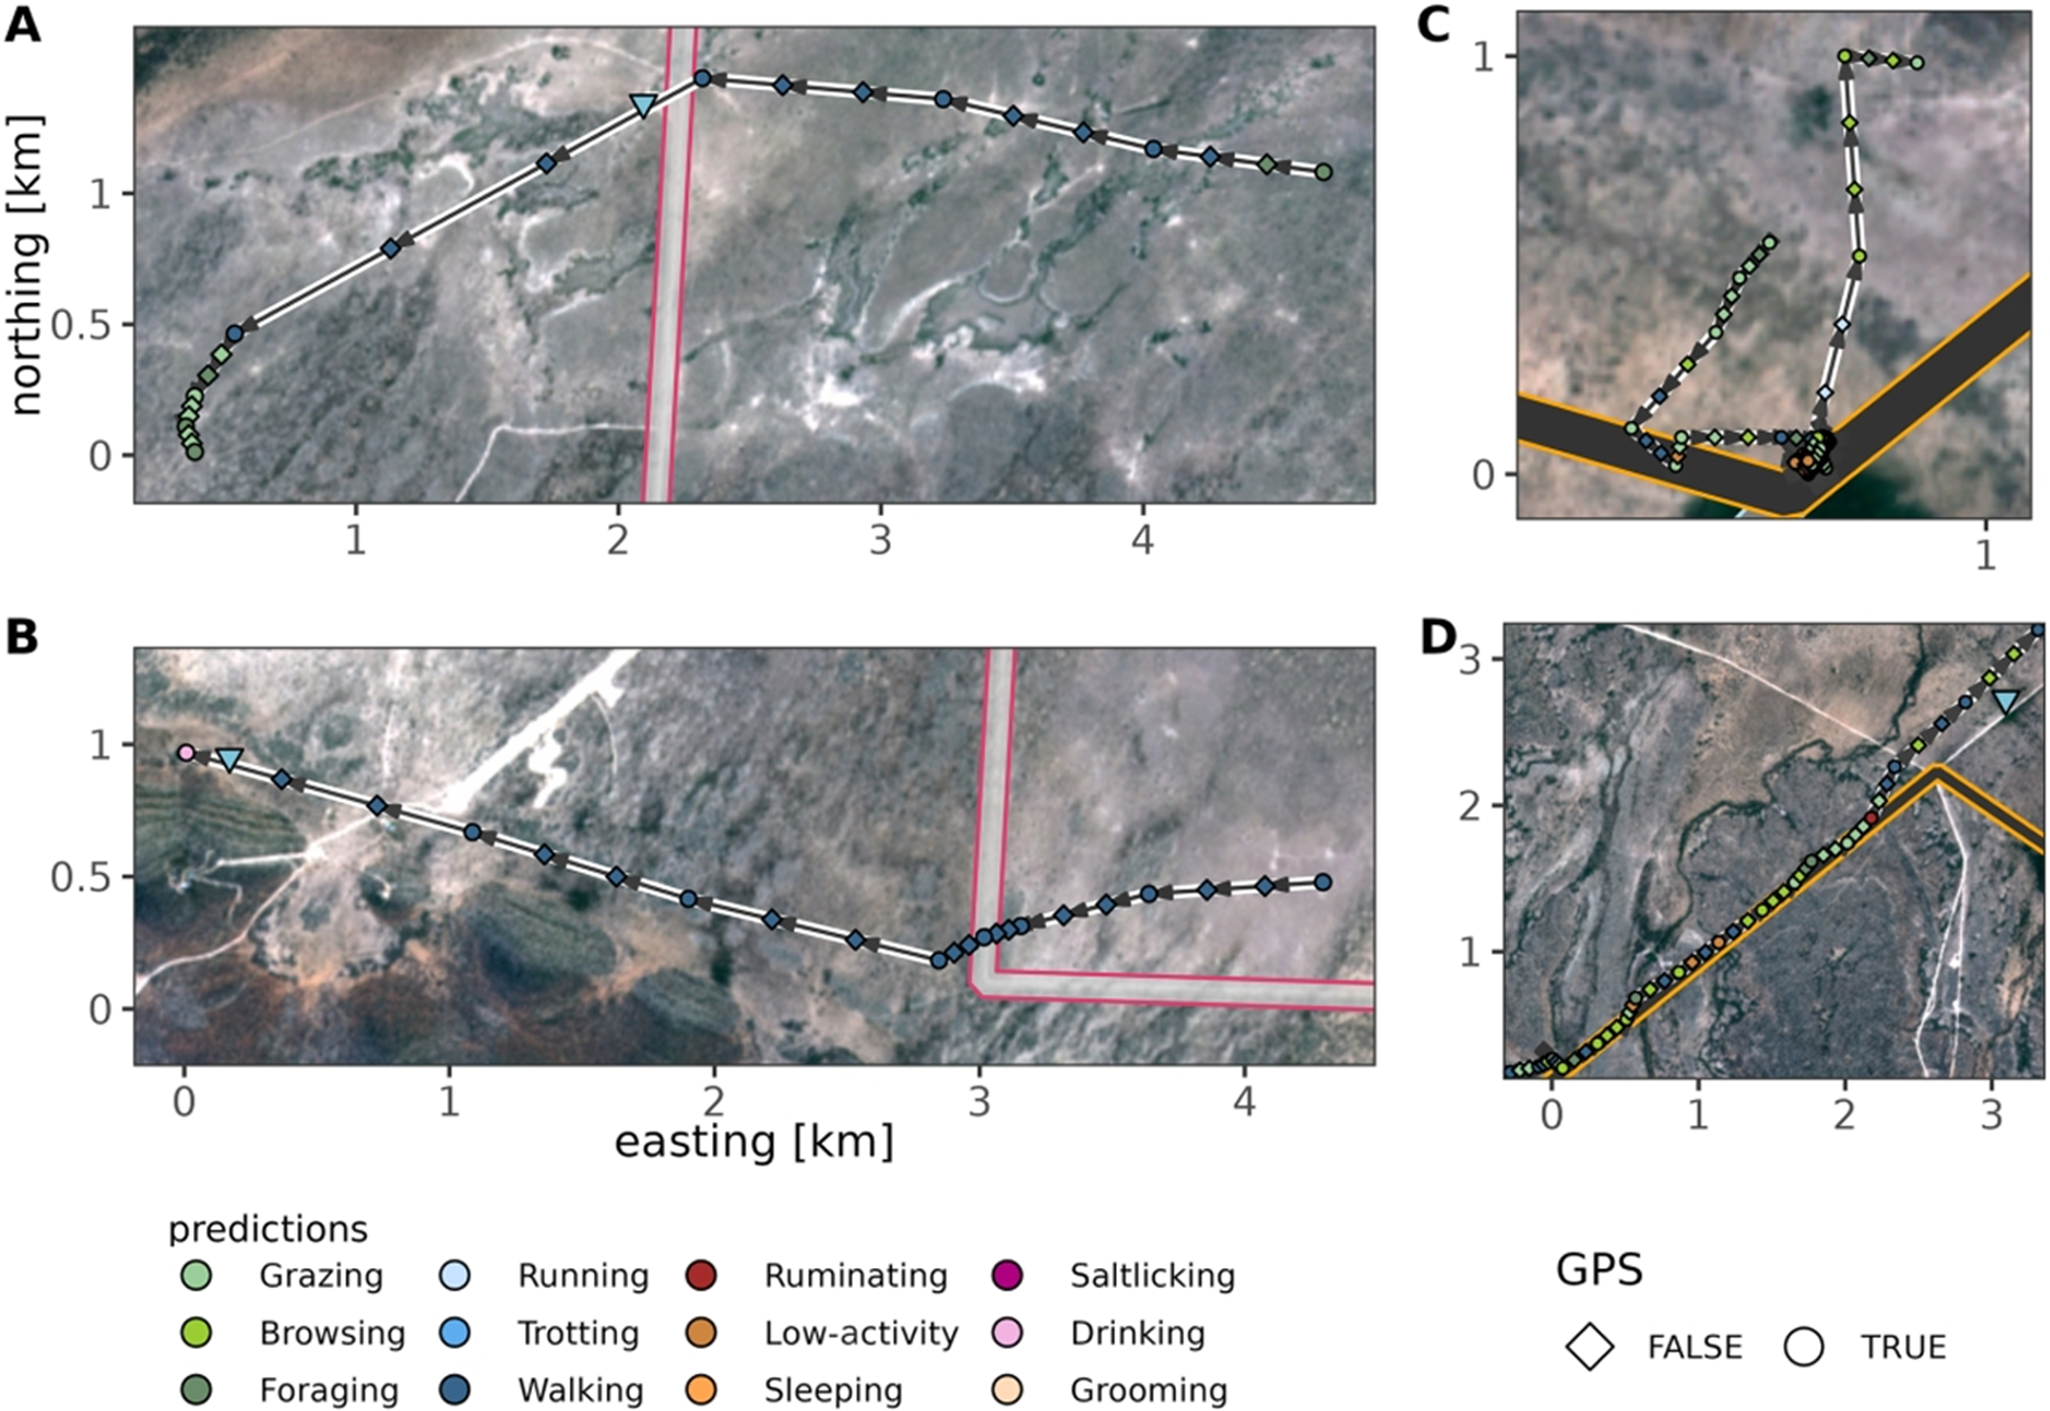
Furthermore, individual movement tracks combined with the behaviour classification reveal a variety of behavioural responses when encountering a fence (Figure 5). When individuals crossed the fence, they often moved to the other side for foraging (Figure 5A) or drinking (Figure 5B). In contrast, behaviour was highly variable when staying at the fence or travelling along the fence (Figure 5C and 5D).

Figure 5. Example GPS tracks of springbok with inferred behaviours before, during and after fence encounters. (A) and (B) show quick fence crossings, where individuals walk towards the presumably known fence gap position and cross the fence to feed (A) or to drink (B). (C) and (D) show different non-cross encounter types where the fence acts as a barrier. In (C), the springbok stays and rests when encountering the fence, while in (D) the individual travels along the fence. Background Sentinel 2 (Bands 3, 4, 5) image, March 2020 (contains modified Copernicus Sentinel data [2020]).
Discussion
This study demonstrates the potential of automated behaviour classification using animal-borne tri-axial accelerometers to address important questions in conservation and behavioural ecology. We trained a robust accelerometer-based behaviour classifier for springbok and applied this to unlabelled accelerometer data collected from individuals during fence encounters. This approach provided valuable insights into the behavioural responses of migratory springbok to anthropogenic barriers in an African savanna.
Behaviour classification
Our classifier was able to predict 12 distinct springbok behaviours. In contrast, previous studies on ungulates typically classified 3–7 behavioural categories (Kröschel et al., Reference Kröschel, Reineking, Werwie, Wildi and Storch2017; Chimienti et al., Reference Chimienti, van Beest, Beumer, Desforges, Hansen, Stelvig and Schmidt2021; Yu and Klaassen, Reference Yu and Klaassen2021). Mean balanced accuracies across both validation approaches – leave-one-individual-out cross-validation (LOIO) and pooled cross-validation – ranged from 85% to 89% (Table 1). These results are comparable to those reported in other ungulate studies, such as roe deer (71%, Kröschel et al., Reference Kröschel, Reineking, Werwie, Wildi and Storch2017 and > 90%, Yu et al., Reference Yu, Deng, Nathan, Kröschel, Pekarsky, Li and Klaassen2021), giraffes (83%–97%, Brandes et al., Reference Brandes, Sicks and Berger2021) and dairy cows (> 90%, Yu et al., Reference Yu, Deng, Nathan, Kröschel, Pekarsky, Li and Klaassen2021).
Although the classifier was trained using only five feature variables, 10 out of 12 behaviours were predicted with an overall accuracy exceeding 80% in the pooled approach (Table 1). This corresponds with the findings of Yu and Klaassen (Reference Yu and Klaassen2021), who showed that classification accuracy remains high even when reducing the number of features from 80 to 5 due to correlations between features. Using fewer features offers the advantages of improved interpretability, greater computational efficiency and reduced risk of over-fitting (Yu and Klaassen, Reference Yu and Klaassen2021).
The slightly lower accuracy observed with LOIO (85%–87%) compared to pooled cross validation (89%) likely reflects inter-individual variation in accelerometer measurements. Factors such as sensor attachment, orientation, collar tightness and natural individual variation in behaviour can all influence these measurements (Moreau et al., Reference Moreau, Siebert, Buerkert and Schlecht2009; Kröschel et al., Reference Kröschel, Reineking, Werwie, Wildi and Storch2017; Barwick et al., Reference Barwick, Lamb, Dobos, Welch and Trotter2018; Hertel et al., Reference Hertel, Niemelä, Dingemanse and Mueller2020; Decandia et al., Reference Decandia, Rassu, Psiroukis, Hadjigeorgiou, Fountas, Molle, Acciaro, Cabiddu, Mameli, Dimauro and Giovanetti2021). This variability, especially when classifiers are trained on one individual and validated on another, can reduce accuracy, a problem observed in the classification of behaviours in other mammals, such as elephants (Soltis et al., Reference Soltis, Wilson, Douglas-Hamilton, Vollrath, King and Savage2012), giraffes (Brandes et al., Reference Brandes, Sicks and Berger2021) and cheetahs (Giese et al., Reference Giese, Melzheimer, Bockmühl, Wasiolka, Rast, Berger and Wachter2021). However, the high accuracy of the LOIO models suggests that the variability between individuals in behaviour-specific accelerometer patterns is relatively low, which increases our confidence in the applicability of this approach to unobserved individuals.
Behaviours such as grazing, ruminating and trotting were characterised by relatively stable head and neck positions, which facilitated accurate classification. In contrast, behaviours like grooming, which involved more complex head and neck movements, had lower accuracy. This variability in body posture caused overlapping acceleration patterns between behaviours, making them harder to distinguish. For example, the pattern of a foraging springbok with its neck tilted downwards was similar to that of a springbok grazing on the ground. Similar challenges have been noted in other mammals, such as cows (Martiskainen et al., Reference Martiskainen, Järvinen, Skön, Tiirikainen, Kolehmainen and Mononen2009), elephants (Soltis et al., Reference Soltis, Wilson, Douglas-Hamilton, Vollrath, King and Savage2012) and baboons (Fehlmann et al., Reference Fehlmann, O’Riain, Hopkins, O’Sullivan, Holton, Shepard and King2017). In our study, confusion between categories with similar neck tilt was more common than between categories with similar locomotion likely due to the placement of the sensor on the neck, making it more sensitive to head movements than leg movements. However, the 12 behaviours differentiated in this study may not all be relevant to fence encounters. Depending on the research question, a reduction of the number of behaviours by combining similar behavioural categories into one may be reasonable and could further improve classification accuracy (Ladds et al., Reference Ladds, Thompson, Kadar, Slip, Hocking and Harcourt2017).
The accuracy of minority categories was influenced by small sample sizes, a well-known problem in supervised behaviour classification (Amrine et al., Reference Amrine, White and Larson2014; Fogarty et al., Reference Fogarty, Swain, Cronin, Moraes and Trotter2020). To address this, future studies could use over-sampling of minority categories (Bom et al., Reference Bom, Bouten, Piersma, Oosterbeek and Van Gils2014) or under-sampling of majority categories (Fogarty et al., Reference Fogarty, Swain, Cronin, Moraes and Trotter2020) to balance the dataset and improve model performance (Chakravarty et al., Reference Chakravarty, Cozzi, Dejnabadi, Léziart, Manser, Ozgul and Aminian2020). Another factor influencing classification accuracy was the segmentation of accelerometer bursts. We used a fixed burst length of 3.3 seconds to optimise collar battery life and data storage. However, this approach could lead to misclassification if bursts contained mixed behaviours. Flexible segmentation methods, such as moving windows or Hidden Markov Models, could help overcome this problem by detecting behaviour change points (Bom et al., Reference Bom, Bouten, Piersma, Oosterbeek and Van Gils2014; Hammond et al., Reference Hammond, Springthorpe, Walsh and Berg-Kirkpatrick2016; Kröschel et al., Reference Kröschel, Reineking, Werwie, Wildi and Storch2017) and may be especially useful for classifying brief behaviours such as jumping. Since the model can only predict behaviours included in the training dataset, rare or unobserved behaviours are likely to be misclassified as the most similar behaviour. Moreover, training classifiers on a small number of individuals can limit their robustness (Bao and Intille, Reference Bao, Intille, Ferscha and Mattern2004). Nonetheless, previous studies have shown that reliable behaviour predictions can still be made with limited samples (Giese et al., Reference Giese, Melzheimer, Bockmühl, Wasiolka, Rast, Berger and Wachter2021; Yu et al., Reference Yu, Deng, Nathan, Kröschel, Pekarsky, Li and Klaassen2021).
Behavioural responses to fence encounters
Significant interaction effects between time period (before, during, after) and encounter type (crossing vs. non-crossing) across all five main behaviours indicate that springbok respond to fences in fundamentally different ways depending on whether they cross them or not. During non-crossing encounters, behavioural changes were minor but suggest hesitation: walking decreased slightly while ruminating and resting increased, consistent with animals pausing at an impassable barrier and temporarily reducing activity and energy expenditure. Feeding behaviour (browsing and grazing) remained largely stable, implying that non-crossings primarily interrupted movement rather than foraging. During crossings, on the other hand, springbok exhibited pronounced shifts in behaviour. Browsing increased while grazing decreased, indicating a switch from head-down to head-up feeding, possibly reflecting vigilance (Bøving and Post, Reference Bøving and Post1997) or avoidance of open grazing areas near the fence where predation risk may be elevated (Dupuis-Desormeaux et al., Reference Dupuis-Desormeaux, Davidson, Pratt, Mwololo and MacDonald2016). Walking increased after crossings, consistent with the directed post-crossing movement observed by Hering et al. (Reference Hering, Hauptfleisch, Kramer-Schadt, Stiegler and Blaum2022b). At the same time, ruminating and resting decreased, indicating increased locomotor effort and reduced recovery immediately after the fence was negotiated. Together, the results show that fences cause disruptions in behaviour which may affect foraging efficiency and overall energy balance. This emphasises the importance of maintaining permeable fence designs to allow animals to move freely between resource patches and minimise the cumulative costs of repeated fence encounters.
By combining predicted behaviours with individual movement tracks, we furthermore observed considerable variability in responses to fence encounters, which may reflect the environmental context of the encounter, such as season, time of day, or social interactions, none of which were analysed in this study. Tracks also suggest purposeful movement, with individuals who appeared to know the location of a fence gap walking directly towards it, often to forage or drink (Figures 5A and 5B). In contrast, individuals who failed to find a gap exhibited more variable behaviours, either staying near the fence (Figure 5C) or travelling along it (Figure 5D).
The random effects analysis revealed substantial variance with regard to both individual animals and specific encounters. Some of the high inter-individual variation for ruminating and resting behaviours may be explained by the misclassification of these two behaviours, given their similar acceleration patterns (Figures 2 and 3). Nonetheless, behavioural responses to fences may also be influenced by intrinsic traits, such as age or temperament (Hertel et al., Reference Hertel, Niemelä, Dingemanse and Mueller2020), previous experiences with barriers or factors such as group composition and habitat conditions during encounters.
Conclusion
Our study demonstrates the utility of accelerometer data for remotely monitoring springbok behaviour, overcoming constraints related to accessibility, visibility and observer bias and enabling quantification of fine-scale responses to anthropogenic barriers. We show that fences alter behaviour of springbok antelope, with clear contrasts between crossings and non-crossings. Behavioural changes, such as the increase in walking and decline in ruminating and resting after crossings, indicate energetic and physiological costs that may accumulate over time. Frequent fence encounters could reshape energy budgets, reduce foraging efficiency and modify space-use patterns. Given the expansion of fencing across African rangelands, our results emphasise the importance of fence permeability and managed fence gaps to minimise behavioural disruption and facilitate ecological connectivity for mobile and migratory species.
Open peer review
For open peer review materials, please visit https://doi.org/10.1017/dry.2025.10012.
Data availability statement
The datasets for this study are stored on the Movebank online platform (https://www.movebank.org), Movebank ID 904829042.
Acknowledgments
We express our sincere appreciation to the owners, management and staff of the Etosha Heights and Sophienhof private reserves for their support during our fieldwork. The Ministry of Environment, Tourism, and Forestry, Namibia, provided further support, and we are grateful for the permission granted by the Namibian National Commission on Research, Science & Technology to conduct this research (certificate number RCIV00032018, with authorisation numbers: 20190602, 20190808 and AN202101048). We extend our thanks to Mathias Mwaetako and Milka Indongo for their contributions to data collection.
Financial support
This work was part of the ORYCS project within the SPACES II programme supported by the German Federal Ministry of Education and Research (grant no. FKZ01LL1804A). Paul Berry and Anna Kraus were funded by the SPACES II.2-CaBuDe scholarship programme of the German Academic Exchange Service (programme numbers 57531823 and 57535685). The publication of this work was funded by the Deutsche Forschungsgemeinschaft (DFG, German Research Foundation) – project number 491466077.
Competing interests
The authors declare none.

 Open access
Comments
No accompanying comment.