
Imagine a situation in which two individuals, one man and one woman, are taking a public opinion survey. Both are asked a series of political knowledge questions. One of these questions asks them to list the five freedoms of the First Amendment. Though uncertain, the first individual takes a stab at it. The second individual, also uncertain, decides to choose the “don't know” option instead of guessing. Assume that both individuals are of equivalent political sophistication. In this scenario, which individual is the man and which is the woman? In light of prior evidence from political knowledge research, the gender gap in political knowledge, and risk aversion, the likelihood is greater that the first individual, the guesser, is the man while the second is the woman. We argue that it is this propensity to guess under conditions of uncertainty that consistently produces political knowledge scales that underestimate the ability of women. The following discussion and analyses will demonstrate that women are indeed more risk averse than men and, therefore, less likely to guess responses to questions for which they are uncertain of the answers. Not accounting for the increased likelihood of women giving “don't know” responses produces scales that underestimate the political knowledge of these respondents and exaggerates the gender gap in such knowledge.
For normative reasons, public opinion matters in a democratic society. Evidence in political science confirms that it matters to decision makers (Hill Reference Hill1993; Holsti Reference Holsti1992; Holsti and Rosenau Reference Holsti and Rosenau1993; Powlick Reference Powlick1991, Reference Powlick1995; Zaller Reference Zaller1992, Reference Zaller, Bennett and Paletz1994). Political knowledge is clearly an important facet of public opinion; without an informed public, opinion polls may lose their importance to decision makers. Political knowledge can and does influence public opinion, which in turn influences policymakers. Empirical evidence indicates that decision makers not only take into account public opinion when making policy decisions but also seek to persuade the public to gain support of their policy ventures (Powlick Reference Powlick1991).
Prior work on political knowledge has often revealed a significant gender gap in which men appear to know more about politics than women (Delli Carpini and Keeter Reference Delli Carpini and Keeter1996; Garand, Guynan, and Fournet Reference Garand, Guynan and Fournet2004; Gidengil et al. Reference Gidengil, André, Nevitte, Nadeau, Tremblay and Trimble2003; Kenski and Jamieson Reference Kenski and Jamieson2001; Mondak Reference Mondak1999; Verba, Burns, and Schlozman Reference Verba, Burns and Schlozman1997). This gap has been demonstrated both in the United States and internationally, even when controlling for various demographics (Claibourn and Sapiro Reference Claibourn and Sapiro2001). The gap exists across generations and, according to some studies, begins as early as adolescence (Hess and Torney Reference Hess and Torney1967; Jennings and Niemi Reference Jennings and Niemi1981; Niemi and Junn Reference Niemi and Junn1999). Moreover, prior research has failed to explain the gender gap using a variety of factors. The gap continues to be sizable even when controlling for age, race, vocabulary ability, education, political efficacy, political interest, income, media exposure, and occupation (Garand, Guynan, and Fournet Reference Garand, Guynan and Fournet2004; Mondak and Anderson Reference Mondak and Anderson2004).
A potential answer for the persistence of the gap in political knowledge lies in how the concept is measured. As a measure of political sophistication, political knowledge scales have been included as dependent, independent, and moderating variables (Delli Carpini and Keeter Reference Delli Carpini and Keeter1996; Goren Reference Goren1997; Neuman Reference Neuman1986; Pettey Reference Pettey1988; Price and Zaller Reference Price and Zaller1993; Verba, Burns, and Schlozman Reference Verba, Burns and Schlozman1997; Zaller Reference Zaller1990, Reference Zaller1992). Yet debate continues as to the validity and reliability of these measures. There are questions as to which items should be included (Delli Carpini and Keeter Reference Delli Carpini and Keeter1993; 1996), whether knowledge is general or specific to particular political domains (Iyengar Reference Iyengar, Ferejohn and Kuklinski1990; Zaller Reference Zaller1992), and, most importantly for this article, the treatment of incorrect and “don't know” responses (Mondak Reference Mondak1999, Reference Mondak2001; Mondak and Anderson Reference Mondak and Anderson2004; Mondak and Davis Reference Mondak and Davis2001).
With this question comes the problem of what these responses indicate about the respondent. Do incorrect responses indicate misinformation or guessing? Do “don't know” responses indicate a complete lack of knowledge or a fear of guessing wrong based on partial knowledge? Michael X. Delli Carpini and Scott Keeter (1996) argue that there is a difference between being misinformed and uninformed. Philip E. Converse (Reference Converse and Apter1964) also acknowledges that these may be different from each other, and the researcher should not simply lump them together in the analysis. He created an ordinal scale that gave incorrect answers higher rank than “don't know” responses. Others have disagreed with this approach, arguing that the difference is not indicative of political sophistication differences, but rather personality differences (Luskin Reference Luskin1987; Mondak Reference Mondak1999). If it is the case that these types of answers fundamentally differ, as Jeffrey J. Mondak (Reference Mondak1999) demonstrates, how should researchers handle them? Some suggest discouraging guessing (Delli Carpini and Keeter Reference Delli Carpini and Keeter1993; 1996). Other work, however, has shown that this has unintended consequences. In fact, knowledge tests that discourage guessing are widely seen as being good measures of risk taking (Cronbach Reference Cronbach1946; Sherriffs and Boomer Reference Sherriffs and Boomer1954; Slakter Reference Slakter1969). More support is found for encouraging guessing. Mondak (Reference Mondak1999; Reference Mondak2001) and Mondak and Belinda Creel Davis (2001) find that discouraging “don't know” responses generally results in higher scores on political knowledge scales.
Piecing together the work on the gender gap in political knowledge and the discussions of measurement problems, we may begin to see an explanation for the size and persistence of the gap. Building on the theory that personality differences (Luskin Reference Luskin1987; Mondak Reference Mondak1999) are, at least in part, driving measurement error, we return to the explanation offered at the outset. Specifically, risk aversion drives individuals under conditions of uncertainty to avoid risk. In the case of political knowledge scales, the “risk” lies in the possibility of answering questions incorrectly; thus, risk aversion should lead to a greater frequency of “don't know” responses when respondents are unsure of the correct answers. Furthermore, we contend that women display higher risk aversion, meaning that men are more likely to guess (Frazer and Macdonald Reference Frazer and Macdonald2003; Kenski and Jamieson Reference Kenski, Jamieson and Jamieson2000) and receive “credit” on those questions they answer correctly. To quote Mondak and Mary R. Anderson, “Such a gender-based differential propensity to guess would mean that the gender gap stems at least partly from a source unrelated to knowledge” (2004, 496).
RISK AND RISK AVERSION
In the behavioral decision making and psychology literatures, there exists conceptual and definitional confusion in terms of the operationalization of concepts such as risk, loss, and security. Lola A. Lopes (Reference Lopes, Goldstein and Hogarth1987, 681–682) acknowledges the definitional differences of the meaning of risk
Technically, the word risk refers to situations in which a decision is made whose consequences depend on the outcomes of future events having known probabilities. … But most of the time our knowledge of probabilities is not so exact. … When our knowledge of probabilities is very inexact (or lacking entirely) we say that decisions are made under uncertainty or ignorance. Obviously, risk shades into ignorance and most important decisions are made part way between poles.
As this quotation suggests, the literature has defined risk in many different ways. It is necessary, therefore, to be clear about the definition of risk utilized in the current discussion. Economists define risk as decision making under uncertainty with known probabilities of outcomes (Kahneman and Tversky Reference Kahneman and Tversky1979; Tversky and Kahneman Reference Tversky and Kahneman1992). Risk, in the economics framework, is not synonymous with loss; it includes decisions involving gains as well. Other definitions of risk are closer to popular conceptions of the term. These other definitions, such as those used in psychology, define risk as being decision making with multiple outcomes for which one or more of the outcomes entails loss, danger, or negative consequences (Byrnes, Miller, and Schafer Reference Byrnes, Miller and Schafer1999). This definition is often used in the study of risk-taking behavior (Cooper et al. Reference Cooper, Wood, Orcutt and Albino2003; Gullone and Moore Reference Gullone and Moore2000). Our work adopts this latter definition, which involves decision making under uncertainty with particular outcomes having negative consequences.
There is an abundance of evidence showing gender differences when it comes to risk. Numerous studies show that women tend to be more risk averse or that women are more likely to demonstrate risk-averse behavior. Several studies have found that women estimate a higher probability of negative events such as nuclear war (Gwartney-Gibbs and Lach Reference Gwartney-Gibbs and Lach1991; Plous Reference Plous1989). Similar findings exist for support of nuclear power for which women are more concerned about the safety risks (Brody Reference Brody1984). Evidence of gender differences in risk assessments also extends to opinions concerning the environment (Bord and O'Connor Reference Bord and O'Connor1997; Flynn, Slovic, and Mertz Reference Flynn, Slovic and Mertz1994). Moreover, prior work demonstrates that gender differences emerge early, showing greater risk taking in male children and more risk aversion in female children (Ginsburg and Miller Reference Ginsburg and Miller1982; Kass Reference Kass1964; Slovic Reference Slovic1966), and these differences exist in self-reported behavior, observed behavior, and intellectual risk taking (Byrnes, Miller, and Schafer Reference Byrnes, Miller and Schafer1999).
One may speculate about the causes of these differences in risk assessment and risk taking. Some theorists contend that there exists a sensation-seeking personality (Byrnes, Miller, and Schafer Reference Byrnes, Miller and Schafer1999); this explanation does not explicitly attempt to explain gender differences. Others argue for a risk-as-value hypothesis, in which risk taking is considered more masculine, to explain why men are more likely to exhibit risk-taking behavior. Jeffrey Arnett (Reference Arnett1992) argues for a socialization and individual factors explanation. More specifically, Arnett argues that socialization, such as the risk-as-value hypothesis, and individual factors, such as sensation seeking, could both help to explain observed differences. The socialization aspect could be a viable explanation if evidence shows that across cultures, men are more likely to engage in risk-taking behavior, while the individual factors explain why all men do not engage in such behavior. Of course, it is also possible that these differences could be a result of evolution; the process of natural selection may have favored risk taking in men more so than it did in women. In particular, risk taking should be adaptive in competitive contexts in which there is a large disparity between the rewards of winners and losers, but possibly maladaptive in other contexts.
Regardless of why such gender differences in risk acceptance exist, we propose that these differences will help to explain the gender gap in political knowledge. In particular, because women are more likely to be risk averse, they are more likely to choose “don't know” on questions for which they are uncertain as compared to their male, risk-seeking (or simply non-risk-averse) counterparts who choose to guess. If political knowledge is our best indicator for political sophistication, about which so much work is done, then it is important to ensure that we are measuring real differences in knowledge instead of in risk. Especially since it is expected that the propensity to guess varies systematically (by gender), failure to correct for this expectation will produce different knowledge estimates for respondents of identical ability (Mondak Reference Mondak2001; Mondak and Davis Reference Mondak and Davis2001). In particular, male respondents, on average, will appear more knowledgeable than female respondents not because they are more knowledgeable but because they are more willing to guess (Mondak and Anderson Reference Mondak and Anderson2004). Thus, the scales that we believe tap political knowledge also measure risk taking, reducing the validity of these knowledge scales (Mondak Reference Mondak2001; Mondak and Davis Reference Mondak and Davis2001).
That women are more risk averse than men implies the following questions. First, are women more likely than men to identify when they do not, or believe they do not, know the answers to political knowledge questions? Second, given a greater propensity for men to guess, what are the implications for measures of knowledge that do not account for this gender-based difference? Finally, what happens to the gender gap in political knowledge once we account for this difference? In response to these questions, we hypothesize the following:
- H1:
Being female will have a positive effect on the likelihood of responding “don't know” to political knowledge questions.
- H2:
When not accounting for gender differences in measurement models, the mean knowledge scores for men will be significantly greater than the mean knowledge scores for women.
- H3:
The mean scores for women derived from models that do account for gender differences will be significantly greater than the mean scores for women derived from models that do not account for such differences.
- H4:
In measurement models that do account for gender differences, the mean scores for men will not be significantly greater than the mean scores for women.
These hypotheses have been addressed in various forms, most pointedly by Mondak and Anderson (Reference Mondak and Anderson2004). We build on this work in two significant ways. First, we make use of 12 surveys conducted mostly between 1986 and 2004, with an additional survey from 1972, including more than 16,000 respondents. More importantly, the core of our analyses make use of three-parameter item response models, which are discussed in far more detail in the “Scaling and Item Response Models” section. These models allow us to directly estimate knowledge for both women and men while accounting for potentially elevated scores derived from guessing.
THE “DON'T KNOW” RESPONSE AND MEASURING POLITICAL KNOWLEDGE
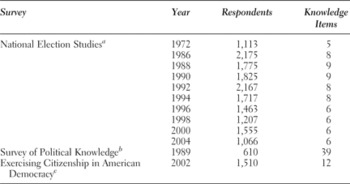
In order to produce findings that are as generalizable as possible, we used data that met the following criteria. Generally, our preferences were for surveys that employed national samples, offered a wide range and, where possible, a large number of political knowledge items, and spanned several years. In total, this research uses data from 12 surveys. Ten of these are from the American National Election Studies (NES), sponsored by the Center for Political Studies, University of Michigan. We also used survey data from the Survey of Political Knowledge, sponsored by Virginia Commonwealth University, and the Exercising Citizenship in American Democracy survey, sponsored by the Center on Congress, Indiana University. Table 1 provides brief summaries of each of the surveys used in the analyses that follow.
Table 1. Summaries of political knowledge surveys

aAmerican National Election Studies, University of Michigan, Center for Political Studies.
bSurvey of Political Knowledge, Virginia Commonwealth University, Survey Research Laboratory.
cExercising Citizenship in American Democracy, Indiana University, Center on Congress.
Theories of risk aversion and the results of other studies imply that women are more likely to respond “don't know” to political knowledge questions and, therefore, less likely to try to guess the correct answer. A simple test of this proposition is a difference in proportions test between the proportion of men and women who responded “don't know.” For this quick test, we looked at 11 of the surveys; responses from the Exercising Citizenship in American Democracy survey are not included because the coding within the data set made it impossible to distinguish between respondents who answered “don't know” and those who refused to answer or were otherwise missing. Of the 7,558 men in the samples, 14.8% responded “don't know,” as did 23% of the 9,115 women in the sample. Note that the “don't know” response rate for women is roughly 1.5 times the rate for men, which is consistent with Elizabeth Frazer and Kenneth Macdonald (2003), who report a rate for women that is almost double the rate for men. The difference between women and men here is 8.1%, which is significant beyond the 0.001 level. While the simple test is informative, the propensity to guess may vary due to other factors.
In looking at the political knowledge items, it is clear that not all items are created equal. Some items ask respondents to identify political leaders, while others attempt to gauge respondents' knowledge of the U.S. Constitution. We grouped the 122 knowledge items from the 12 surveys into five topics.
1. Identification of U.S. politicians
Example: “Do you happen to know what job or political office Jim Wright holds?”
2. Identification of foreign political leaders
Example: “Do you happen to know what job or political office Margaret Thatcher holds?”
3. Constitution and structure of government
Example: “For how many years is a president of the United States elected — that is, how many years are there in one term of office?”
4. Current events and policy
Example: “Do you happen to know which party had the most members in the House of Representatives in Washington before the elections last month?”
5. U.S. political history
Example: “Do you know about when the New Deal occurred?”
It was important to identify item topics because both men and women may be more (or less) likely to hazard guesses on questions that fall under a particular topic. For example, we might be less likely overall to observe “don't know” responses to current events questions, especially questions regarding party control of Congress. Having a 50–50 chance in these questions could provide a stronger incentive to guess than in questions asking which offices certain foreign leaders hold.Footnote 1 Different topics may also provoke differing propensities to guess, specifically in women; thus including more questions on a particular topic may produce a more exaggerated gender gap. In addition to topics, we also consider the possibility that the propensity to guess may be affected by time. Most of the data employed here come from election studies. Since political interest tends to be greater in presidential election years, these years might show smaller “don't know” rates as opposed to nonpresidential election years.
We therefore examine gender differences using a three-level hierarchical model (multilevel model) with a dichotomous dependent variable coded 1 if the respondent answered “don't know,” 0 for a substantive answer, correct or otherwise. Individual factors (i) are nested within the five item types (j) that are described in the topics list, which are nested within the 11 time points (t). The model is presented as follows:
The reduced form of this model, which may be more readily understood, is presented as
Don't Know is the dependent variable, as described. Gender is also a dummy variable, scored 1 if the respondent is female, 0 if the respondent is male. In general, γ represents coefficients, and ɛ, r, and u represent random error components; γ 000 is the intercept, which varies randomly both across topics, as modeled by r 0jt, and across time, as modeled by u 00t. Thus, there could be a different intercept for respondents answering current events questions in 1986 than there is for respondents identifying U.S. leaders in 1994. In addition, γ 100 is the effect of Gender, which also varies randomly across topics (r 1jt) and time (u 10t). Important for this analysis is the estimation of the coefficients themselves and the variance of these coefficients that can be explained by topics and time. Results are presented in Table 2.
Table 2. Multilevel model estimates predicting “don't know” responses
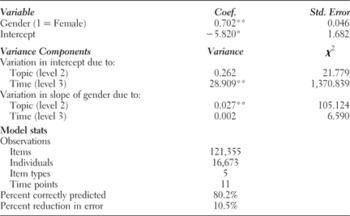
Note: As described in the text, variance components are estimated for the intercepts at levels 2 and 3 and the effect of gender at levels 2 and 3. The only respondents not included are from the Exercising Citizenship Survey. The coding of the data made it impossible to discern a “don't know” response from a missing response.
* p < 0.01; ** p < 0.001.
Table 2 yields strong support for hypothesis H1, which posited that women would be more likely to answer “don't know.” The average effect of being female is positive and highly significant. Looking first at the intercept, there is significant variation over time (level 3), but not by topic (level 2). This can be seen in the “Variance Components” panel of Table 2, which reports a small, insignificant χ2 for topic-level variance of the intercept and a large, very significant χ2 for time-level variance. Regardless of topic, the intercepts are around –11 from 1990 through 1998 and –1 for all other years. It is most likely the case that our time level is picking up variation in how the NES was administered in those years. The opposite is observed for the effect of gender, which varies significantly across topics but not time. Thus, across time, the effect of gender is strong and significant, but on different topics, women have a varied propensity to guess. Specifically, women are most likely to respond “don't know” to current events–type questions and least likely to respond “don't know” to questions on the Constitution or structure of government. In order to more clearly present the gap between men and women in their likelihood of giving a “don't know” response, we offer Figure 1.

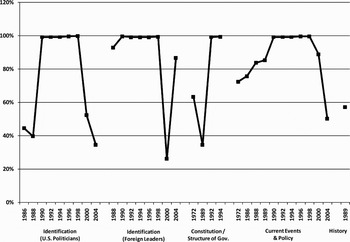
Figure 1. Percent change in the predicted probability of a “don't know” response between males and females. Note: Percent changes are based on the probabilities of responding “don't know” for men and women given a particular survey and topic. The curves represent how much more likely women are to respond “don't know” than men for each survey and question type. Predicted probabilities are based on the estimated intercepts and slopes for gender unique to each question type/year combination.
Each point in Figure 1 represents the percent change in the predicted probability of a “don't know” response between men and women for a particular topic on a particular survey.Footnote 2 Years are presented on the horizontal axis along with topics. As a reminder, 1989 represents the Survey of Political Knowledge, and the remaining years are NES surveys. Each predicted probability is calculated for males and females, incorporating the year and topic-specific variation in the intercepts and effects of gender. At its lowest, women are still around 25% more likely to answer “don't know” than men (identification of foreign leaders in 2000). At its highest (for several years and four of the five topics), women are 100%, or twice as likely to respond “don't know.” For the most part, regardless of time or type, women are far more likely to express or claim lack of knowledge on these items, very clear evidence that gender differences exist at least in the propensity to give any answer at all. Given that “don't know” responses are usually coded as incorrect, measurement models that do not account for gender-based differences to guess are likely to produce estimates of ability or knowledge that are greater for men. Hypothesis H2 directly addresses this possibility. To test hypothesis H2, we first need to derive a knowledge scale for men and women based on the items in each survey.
SCALING AND ITEM RESPONSE MODELS
There are different approaches to scaling items in order to place respondents on an underlying trait, like political knowledge. One could, for example, simply create an additive scale of correct responses. Simply, the more items a respondent answers correctly, the higher on the underlying trait the respondent is. This approach, however, assumes that all of the items are equally effective at predicting the trait. That is, there is no difference between asking respondents to identify one freedom listed in the Fifth Amendment and asking which party currently holds the majority in the House of Representatives. To be more specific, such an approach assumes that both of the items are equally difficult to answer and that there is no accounting for how the items distinguish those who are more knowledgeable from those who are less knowledgeable. This first property is referred to as an item's difficulty; some items require more knowledge to be able to answer them. The second is an item's discrimination. Put simply, a very discriminating item is one that practically everyone who is knowledgeable can answer correctly and practically everyone who is not knowledgeable cannot answer correctly. In this brief example, consider a respondent who answered the first question correctly and the second incorrectly. Consider another respondent who did the opposite. The simple additive scale would consider both respondents equally knowledgeable: Both answered one question correctly. Common sense, however, might dictate that the first respondent is at least a little more knowledgeable, owing to the more difficult nature of the first question. The ability to answer the first question may also more easily distinguish someone who is more knowledgeable from someone who is less knowledgeable. Guttman scaling loosely addresses these properties. In this approach, items are rank ordered such that a respondent who answers the last (presumable most difficult) question correctly should also have answered all previous questions correctly. The underlying assumption here is that when ranked, each successive item is incrementally more difficult than the one preceding it.
Given the importance of these characteristics, such as difficulty and discrimination, scaling items has increasingly been done using item response models.Footnote 3 Rather than make assumptions regarding item characteristics, these characteristics are empirically estimated. Each item is modeled as a logit (correct responses indicative of higher knowledge are coded as 1, 0 otherwise), with the item's difficulty and discrimination included as parameters in the model. The most basic item response model includes only the difficulty parameter and is referred to as the one-parameter logit model. The two-parameter logit (2PL) model includes parameters for difficulty, denoted β, and discrimination, denoted α. Returning to the previous example, the 2PL would identify the first respondent as more knowledgeable than the second because the first item is both more difficult and more discriminating; thus, being able to answer it is indicative of higher knowledge. Because they empirically estimate these characteristics, item response models can provide for the more accurate scaling of respondents on a trait, like political knowledge, when there are a wide variety of items. Central to this work, however, are two additional abilities of item response models.
First, item response models are not limited to two parameters; there are also three-parameter logit (3PL) models. This extra parameter is often referred to as the guessing parameter and provides a floor for the probability that an item is answered correctly. Given our reliance on risk aversion and the differing propensity of men and women to guess, we make extensive use of 3PL models. It is also important to note that some argue that the estimates of the 3PL are not consistent. We recognize these criticisms of the 3PL and take steps to improve their estimation; specifically, all of the item response model estimates are bootstrapped with 10,000 replication samples.Footnote 4
Second, item response models can also be jointly estimated for different groups of respondents. In the item response literature, this is referred to as differential item functioning. As an example, consider that our Fifth Amendment question is asked to a group of first year high school students and a group of constitutional lawyers. We would expect the item to have larger difficulty and discrimination parameters for the high school freshman than for the constitutional lawyers; that is, the parameter estimates are different for different groups of respondents. Naturally, the groups focused on here are women and men. Accounting for differential item functioning means that the same item could have a different difficulty estimate, a different discrimination estimate, and, most importantly, a different guessing estimate for women and men. For identification purposes, all that is required for a set of items is that the parameter estimates be held constant between women and men for one item; parameters for all remaining items are allowed to vary between groups.
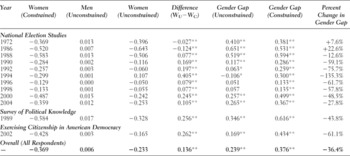
AN INITIAL ESTIMATE OF THE GENDER GAP IN KNOWLEDGE
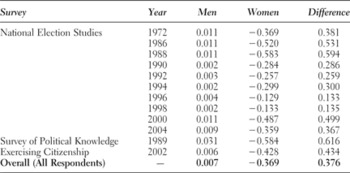
In this section, we use the 3PL to generate political knowledge scales for respondents in all 12 surveys that do not account for gender-based differences. We do this in order to test hypothesis H2, which posited that the mean scores for men would be greater than the mean scores for women on scales that do not model gender-based differences. We call this first set of 3PL models the constrained models—constrained because the parameters of every item are forced to be equal between men and women. Put another way, in this first set of models, we do not account for the possibility that the knowledge estimates for men could be inflated because of their greater propensity to guess. Use of the constrained models will allow for an examination of how knowledge estimates are typically derived for survey respondents and, more importantly, how these estimates change once we allow item parameters to differ between groups (men and women). Again, we estimated the constrained 3PL models for all 10 NES surveys, the Survey of Political Knowledge, and the Exercising Citizenship in American Democracy survey.Footnote 5 From these estimates, we derived ability scores in political knowledge bound at –5 and 5. The boundaries are arbitrary; what is important is that the scale is standardized with a mean of zero and a standard deviation of 1, which will allow comparisons in the following section. The mean political knowledge scores for men and women for each survey are presented in Table 3. Consistent with prior research on the gender gap, for every survey the difference between men and women is positive (suggesting a higher mean for men) and significant, which yields strong support for hypothesis H2.
Table 3. The gender gap in knowledge from constrained models

Note: Differences are calculated at the mean for men minus the mean for women. All differences, according to difference in means tests, are significant beyond the 0.001 level. The test of overall means includes every respondent to every survey listed above.
ACCOUNTING FOR GENDER DIFFERENCES
Unequivocally, measuring political knowledge with models that assume no differences between men and women produces scales in which women perform significantly worse than men. The gender gap in knowledge is also persistent, existing at least in this research from 1972 through 2004. We demonstrate previously, however, that women are significantly less likely to guess the answers to questions to which they do not know the answers. In most models of political knowledge, including the 3PL models discussed here, these “don't know” responses are counted as incorrect, which clearly stacks the deck against women when gauging their level of political knowledge (Mondak Reference Mondak2001; Mondak and Anderson Reference Mondak and Anderson2004; Mondak and Davis Reference Mondak and Davis2001). The persistence of the gender gap in knowledge has two possible explanations. The first we have already spent much time discussing and believe to be true: Men are more likely to guess and will get at least some answers correct. Women, on the other hand, are getting no credit for their “don't know” answers. The second possibility is that men are not guessing at all and simply are more knowledgeable than women.
In order to examine both of these possibilities, we estimate the same 3PL models, only now the item parameters, including the guessing parameter, are allowed to vary between men and women.Footnote 6 We call these 3PL models the unconstrained models. If men are not guessing correct answers (or not guessing at all), there should be little difference in the gender gap. More generally, if there are minimal differences between men and women, the gap should not be affected. If, on the other hand, there are differences between men and women in the way they respond to political knowledge items, particularly in the propensity to guess, the free, unconstrained item parameters should pick up these differences and there would be a noticeable closing of the gender gap. Such a result would be evidence of differential item functioning, which is briefly described earlier.Footnote 7
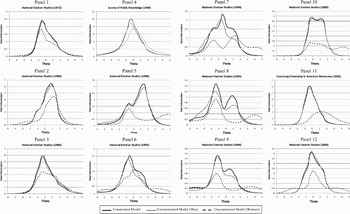
Unconstraining so many parameters can be costly for model efficiency, but such losses are appropriate if accounting for differential item functioning produced better measures of the underlying trait. Before discussing the scores derived from the unconstrained models, we first look at these models more generally. There are different ways to compare models, items, and fit. One way, which we do not do here, would be to examine the item characteristic curves. While one could plot curves for a handful of items, it would be imprudent to present graphs for all 122 items. Instead, we present Figure 2, which plots the total information curves for each survey.

Figure 2. Total information curves for item response models.
Each panel in Figure 2 represents one survey, with each panel containing three curves. The solid black line is the total information curve of the constrained models. The solid gray line is the total information curve of the unconstrained models, but only for men. The dashed black line is the total information curve for women, again from the unconstrained models. In general, item information curves tend to indicate that the “test” provides a lot of information about individuals who are of midlevel ability and practically none about individuals toward the tails of the distribution, those of very high or very low ability. This is exactly what is observed for the constrained models and for men in the unconstrained models. In fact, there are very few differences in the amount of information the surveys provide for the entire sample when parameters are modeled as equal across groups and for men when parameters are free. For women, there is a remarkably different story. For nearly every survey, the unconstrained models provide more information about women, particularly at higher levels of knowledge, than the constrained models. This suggests that allowing parameters to vary by gender is yielding no worse estimates of knowledge for men, but better estimates of knowledge for women.
Using scales derived from the unconstrained model will allow for testing of hypotheses H3 and H4, which stated that the mean knowledge scores for women would be greater using the unconstrained models than using the constrained models, and that the gender gap would be eliminated (no significant difference between women and men would exist) using the unconstrained models. These results are presented in Table 4, which represents the knowledge estimates for women using the constrained models from Table 3 and presents the knowledge estimates for men and women derived from the unconstrained models. Looking first at changes within women as a group (column 5), the unconstrained models, which as explained earlier appear to better estimate political knowledge particularly for women, consistently produce larger estimates of political knowledge. Only the NES in 1972 and 1986 produced scales in which women appear more knowledgeable when not accounting for gender differences. The remaining 10 surveys clearly show that political knowledge scales derived from the unconstrained models provide estimates of knowledge for women that are significantly greater; all of the differences are significant beyond the 0.001 level. These findings demonstrate strong support for H3.
Table 4. The gender gap in knowledge from unconstrained models

Note: The table presents three difference columns. The first presents differences between mean knowledge scores for women based on the unconstrained models and scores from the constrained models. The second presents the gender gap for the unconstrained models. The third represents the gender gap from the constrained models originally presented in Table 3. The final column is the percent change in the gender gap when moving from constrained models to unconstrained models.
*p < 0.01; ** p < 0.001.
Lastly, we now turn to column 6, which is the gender gap itself—the difference between men and women—and we see a much different gap than was estimated using the constrained models. Hypothesis H4 stated that knowledge scales derived from unconstrained models would show no significant differences between men and women. While this hypothesis is not supported in full, for most of the surveys, with the exception of the NES in 1972 and 1986, the gap has narrowed appreciably. There is support for hypothesis H4 looking at the NES in 1996 and 1998, where there are no significant differences between men and women, and for the NES in 1994, in which the gap is significant and negative, meaning that women are gauged as more knowledgeable than men. To place these changes in perspective, the last two columns of Table 4 present the gender gap reported in Table 3, which was estimated from the constrained models, and the change in the gender gap when we move from constrained to unconstrained—that is, the change once we account for gender differences when deriving knowledge scales. Again, for the 1972 and 1986 NES surveys, the gender gap does increase, with the largest increase, 22.6%, in 1986. In subsequent surveys, the gap decreases. These drops range from 12.6% up to 135.3%, depending on the survey. Overall, simply by accounting for gender-based differences in item responses, we are able to explain 36.4% of the gender gap in political knowledge—a decrease in the gap that is consistent with Kenski and Jamieson (Reference Kenski, Jamieson and Jamieson2000), where the gap is reduced between 20% and 40% when converting “don't know” responses to substantive answers. Similarly, the decrease in the gap is consistent with Frazer and Macdonald (Reference Frazer and Macdonald2003), where the gap is reduced by 25%, and with Mondak and Anderson (Reference Mondak and Anderson2004), where the gap is reduced by almost 50%.
CONCLUSION
The existence of a gender gap in political knowledge is not a new phenomenon. Numerous studies have documented this gap, and this research has identified a persistent gap dating back to at least 1972. Where many studies have failed to identify factors that explain this gap, we find success by accounting for a recognized psychological difference between men and women: acceptance of risk. Men are far more likely to hazard guesses than women, which leads to inflated estimates of their political knowledge relative to that of women. Other studies have demonstrated the effectiveness of eliminating “don't know” responses (Mondak Reference Mondak2001; Mondak and Anderson Reference Mondak and Anderson2004; Mondak and Davis Reference Mondak and Davis2001; Prior and Lupia Reference Prior and Lupia2008). In this research, we also show the pitfalls of failing to account for these responses, but also demonstrate the use of item response models to account for the differing propensity of men to guess. Simply by accounting for differential item functioning, we are able to show that the gap is not as large as is estimated by most conventional measures of political knowledge. Furthermore, the item response models estimated here show no loss of information about men and provide more information about women, particularly at higher levels of knowledge, as compared to models that do not account for gender differences. Comparing the two sets of models, we find that models that do account for gender differences produce knowledge estimates for women that are much closer to and sometimes exceed the estimates for men.
One result we find troubling is that even when we allow item parameters to vary by gender, a significant gap still persists despite a closing of the gap. Our analysis is basic in that its primary concerns are to see if women are more likely to say they do not know the answers to questions, to show that models that do not account for this simple gender difference produce a significant gap in political knowledge, and to demonstrate that this gap narrows once these differences are modeled. Future endeavors in this area will clearly need to synthesize theories of risk aversion, accounting for the propensity to guess, and more general theories of political knowledge. We recognize that differential item functioning has not fully discounted the effect of gender. Likewise, looking at factors such as education, political interest, and income, as previous studies have done, has not explained away the role of gender in differences in levels of political knowledge either. We believe that the fundamental flaw in these studies is that they have tried to “close” the wrong gap. Especially for historical data, it may be the case that women have lower political efficacy, lower interest, lower income, and less education—all of which lead to a larger gap between men and women. While these factors alone have not diminished the significance of gender in assessing political knowledge, including them in measurement models that more accurately estimate knowledge for women should go a long way toward achieving that goal.
Looking toward the future, we agree strongly with the work of Mondak (Reference Mondak1999; Reference Mondak2001), Mondak and Davis (Reference Mondak and Davis2001), and Prior and Lupia (Reference Prior and Lupia2008). Surveys gauging political knowledge need to be designed to minimize the desire to opt out of answering questions. Instructions encouraging guessing, multiple choice formats, extended time, and, where appropriate, monetary incentives have all been shown in these studies to decrease the deleterious effects of the “don't know” response. Removing these effects is of the utmost importance for the study of the gender gap in knowledge, given their significant role in the underestimation of political knowledge among women.