


Politicians are central actors in representative democracies. They raise money for campaigning at elections, canvass citizens to gain their support, participate in different party activities, aggregate social interests, sit in legislative committees, consult interest groups, develop and adopt legislative bills, scrutinize the government, take positions on and advocate for policies, and they may even inspire a sense of unity and identity among individuals or incite hate and prejudice against others. Given these responsibilities and functions, one may wonder how these central actors of the democratic process evaluate the working of democracy. Indeed, politicians are in a unique position to evaluate the success and failure of representative democracies from different angles, by their involvement in the electorate, in political organizations, and in governments and legislatures (Dalton and Wattenberg Reference Dalton and Wattenberg2002; Key Reference Key1958).
To date, the scholarship on political support has mostly considered the view of citizens. Easton (Reference Easton1965, Reference Easton1975) initially distinguished citizens’ diffuse support toward the political community or the regime from more specific forms targeted at political authorities. Norris (Reference Norris1999) expanded the authorities, regime, and community classification and proposed distinguishing between evaluations of political actors, regime institutions, regime performance, regime principles, and the political community. In theory, these classifications may refer to both citizens and politicians. In practice, however, only citizens have been thoroughly scrutinized in public opinion research.
Regime performance is the type of political support that informs the questions we examine in this research note. As indicated by Norris (Reference Norris1999, 11), regime performance ‘taps a “middle level” of support which is often difficult to gauge’ in between specific support for actors and institutions and support for the regime (e.g., democracy), which captures ‘how democracy functions in practice as opposed to the ideal’. The most well-known indicator of regime performance is perhaps ‘satisfaction with democracy’ (SWD). This indicator has come to be understood as gauging ‘how well people generally think politics or governance is working’ in practice instead of being an evaluation of the ‘democratic-ness’ of the political system (Singh and Mayne Reference Singh and Mayne2023, 9). Importantly, SWD is different than ‘an indicator of support for the principles of democracy’ (Linde and Ekman Reference Linde and Ekman2003, p. 405).
As reported recently by Singh and Mayne (Reference Singh and Mayne2023), a considerable scholarship has investigated citizens’ democratic satisfaction in the last decades. On the one hand, scholars considered the role of SWD as a predictor of different forms of political attitudes and behaviors. For instance, studies examined the role of democratic satisfaction on support for radical parties (Arzheimer Reference Arzheimer2009; Ramiro Reference Ramiro2016), voter turnout (Kostelka and Blais Reference Kostelka and Blais2018), and citizens’ support for democracy and institutional reforms (Claassen, Reference Claassen2020). On the other hand, the bulk of the scholarship considered factors that influence citizens’ levels of democratic satisfaction (Singh and Mayne Reference Singh and Mayne2023). In particular, scholars highlighted the importance of winning elections (Anderson and Guillory Reference Anderson and Guillory1997; Blais and Gélineau Reference Blais and Gélineau2007), ideological congruence with parties and governments (Ferland Reference Ferland2021; Kim Reference Kim2009; Mayne and Hakhverdian Reference Mayne and Hakhverdian2017), compulsory voting (Singh Reference Singh2018), quality of governance (Anderson and Tverdova Reference Anderson and Tverdova2003; Dahlberg and Holmberg Reference Dahlberg and Holmberg2014), and good economic conditions, among other things (Cutler et al. Reference Cutler, Nuesser and Nyblade2022; Daoust and Nadeau Reference Daoust and Nadeau2021). While this scholarship has expanded significantly, to our knowledge, scholars have yet to examine politicians’ evaluations of the democratic process.
In this research note, we intend to lay the foundation of a new research agenda that aims at better understanding politicians’ evaluation of the functioning of democracy. This might be important for several reasons. Identifying areas of friction or success in their assessment of the policy-making process may inform or complement work on institutional design and reform. It could also be valuable in identifying disconnects between citizens’ and politicians’ views about the working of democracy. Normatively, we would hope both actors share a similar understanding about the way their political system works. For example, dissatisfied citizens coupled with satisfied politicians would be a case of disconnected political elites, which could open the way to political cynicism, apathy, or unrest. Alternatively, dissatisfied politicians may also be consequential for how citizens perceive the working of democracy, given the evidence of politicians’ influence on public opinion (Clayton et al. Reference Clayton, Davis, Nyhan, Porter, Ryan and Wood2021; Lenz Reference Lenz2013). Maybe more importantly, politicians are pivotal for democratic stability and preventing backsliding (Levitsky and Ziblatt Reference Levitsky and Ziblatt2019). Given the possible role of democratic satisfaction on support for democracy (Claassen Reference Claassen2020) and the current erosion of democratic norms and institutions (V-Dem Institute 2025; Lührmann and Lindberg Reference Lührmann and Lindberg2019), it seems crucial to undertake an investigation of politicians’ democratic satisfaction.
The study
As an initial step in understanding politicians’ SWD, we seek to accomplish two objectives. First, we want to compare levels of democratic satisfaction across citizens and politicians in different countries to evaluate whether mass-elite gaps are apparent and identify whether politicians or citizens are systematically more or less satisfied. Second, we want to replicate core findings from the research on citizens but with politicians. As such, we examine two hallmark findings in the literature on SWD with respect to the role of ideological extremism and the winner-loser gap at elections. In the next three sections, we investigate each question in turn by summarizing the state of the citizens’ literature, contextualizing how it might pertain to politicians, and presenting the corresponding empirical results.
To this end, we combine data from modules 1 and 2 of the Comparative Candidates Survey (CCS 2016; CCS 2022) and modules 2–4 of the Comparative Study of Electoral Systems (CSES 2024). The CCS project surveys candidates running in national (semi-)parliamentary elections worldwide by administering a standardized questionnaire. Respondents are elected and unelected candidates to national parliamentary elections. The CSES also administers a standardized questionnaire to citizens in the context of their national elections in several countries around the world. In total, we were able to match citizens-candidates survey data comprising our key variables of interest for 16 election studies across 10 (semi-) parliamentary democracies between 2005 and 2015 (Australia, Finland, Germany, Greece, Iceland, Ireland, Norway, Portugal, Romania, and Sweden). Our study includes 21,286 citizens and 8,975 candidates who ran for 71 political parties.Footnote 1
Our results show that politicians’ level of democratic satisfaction is not systematically higher than citizens’ in these elections. In about half the countries we study, politicians are more satisfied than citizens, while we observe the opposite in the other countries. We also found that both more ideologically extreme politicians and citizens and those from niche parties are less satisfied than moderate mainstream individuals. Additionally, these relationships are stronger among politicians. This makes extreme politicians even less satisfied than their corresponding citizens and moderate politicians more satisfied than moderate citizens. We also report a greater winner-loser gap among politicians than citizens. In examining the different configurations of the winner-loser gap that are specific to politicians, we show that winning at the individual and at the party level both matter for SWD. We also replicate the established result about the conditional role of majoritarian and proportional electoral systems in connection to the winner-loser gap.
Overall, we believe our study contributes to the growing scholarship on political elites’ attitudes and behaviors (Broockman and Skovron Reference Broockman and Skovron2018; Kertzer Reference Kertzer2022; Sheffer et al. Reference Sheffer, Loewen, Soroka, Walgrave and Sheafer2018; Walgrave et al. Reference Walgrave, Jansen, Sevenans, Soontjens, Pilet, Brack and Loewen2022) in identifying some of the conditions that may favor and undermine the SWD of key political actors in representative democracies. In doing so, we hope that our research will initiate further investigations of politician-specific factors. As we discuss in the conclusion, there are several related research questions that might be considered in the future.
Comparing levels of citizens’ and politicians’ satisfaction with democracy
Our first objective is to compare citizens’ and politicians’ levels of SWD over the same elections. In both the CCS and CSES projects, citizens’ and politicians’ SWD is measured with the typical question: ‘On the whole are you very satisfied (coded 4), fairly satisfied (coded 3), not very satisfied (coded 2) or not at all satisfied (coded 1) with the way democracy works in [respondent’s country]?’. In using this common indicator with politicians, two questions arise. First, are politicians answering this question as citizens or as politicians? It is important to note that the data collection for the CCS generally starts as soon as possible after an election finishes and that candidates are told they are being contacted because they ran in that election. Moreover, the first two modules of the questionnaire survey their political background and campaign experience, followed by questions on the works and responsibilities of legislators, and then their SWD. This sequence emphasizes their role as a candidate as they participate in the study.
Second, does the SWD indicator measure the same information for politicians as it does for citizens? We believe it does. As indicated previously, scholars have come to understand this indicator as broadly capturing what citizens think of ‘the everyday working of politics and governance’ (Singh and Mayne Reference Singh and Mayne2023, 10) and the outcomes it generates, such as its representativeness or even its economic outputs. One way of showing this similarity is with construct validity (Adcock and Collier Reference Adcock and Collier2001; Canache et al. Reference Canache, Mondak and Seligson2001) and the replication of core findings from the research on citizens and testing whether it also applies to politicians. To prelude those analyses, we found similar results for politicians and citizens when it comes to ideological extremism and the winner-loser gap. That said, we also assume that politicians’ SWD might be influenced by factors that are specific to their unique involvement in the democratic process. This does not mean that the indicator has a substantively different meaning for citizens and politicians, but rather that politician-specific determinants of democratic satisfaction may also exist.
Figure 1 displays the distribution of democratic satisfaction across the ten countries for which it was possible to match citizens and politicians over the same elections.Footnote 2 For different reasons, we might expect politicians to be more satisfied with how democracy works in their country than citizens. Politicians, presumably, believe that they could contribute to future political change by being elected. Individuals with high socioeconomic status, typical of politicians (Phillips 1998), are more likely to show high levels of political efficacy (Campbell et al. Reference Campbell, Converse, Miller and Stokes1960) and to participate in politics (Verba et al. Reference Verba, Schlozman and Brady1995). Politicians are also directly involved in the electoral process through their participation in elections and generally have some resources to publicize their policy views. Moreover, elected politicians have the opportunity to influence the policy-making process and have access to many resources (office, budget, employees, etc.) to achieve their legislative and constituency responsibilities and to promote their political agenda. Even if politicians’ influence on the legislative process varies greatly and depends on their parliamentary and cabinet responsibilities, such influence is not shared by most citizens.
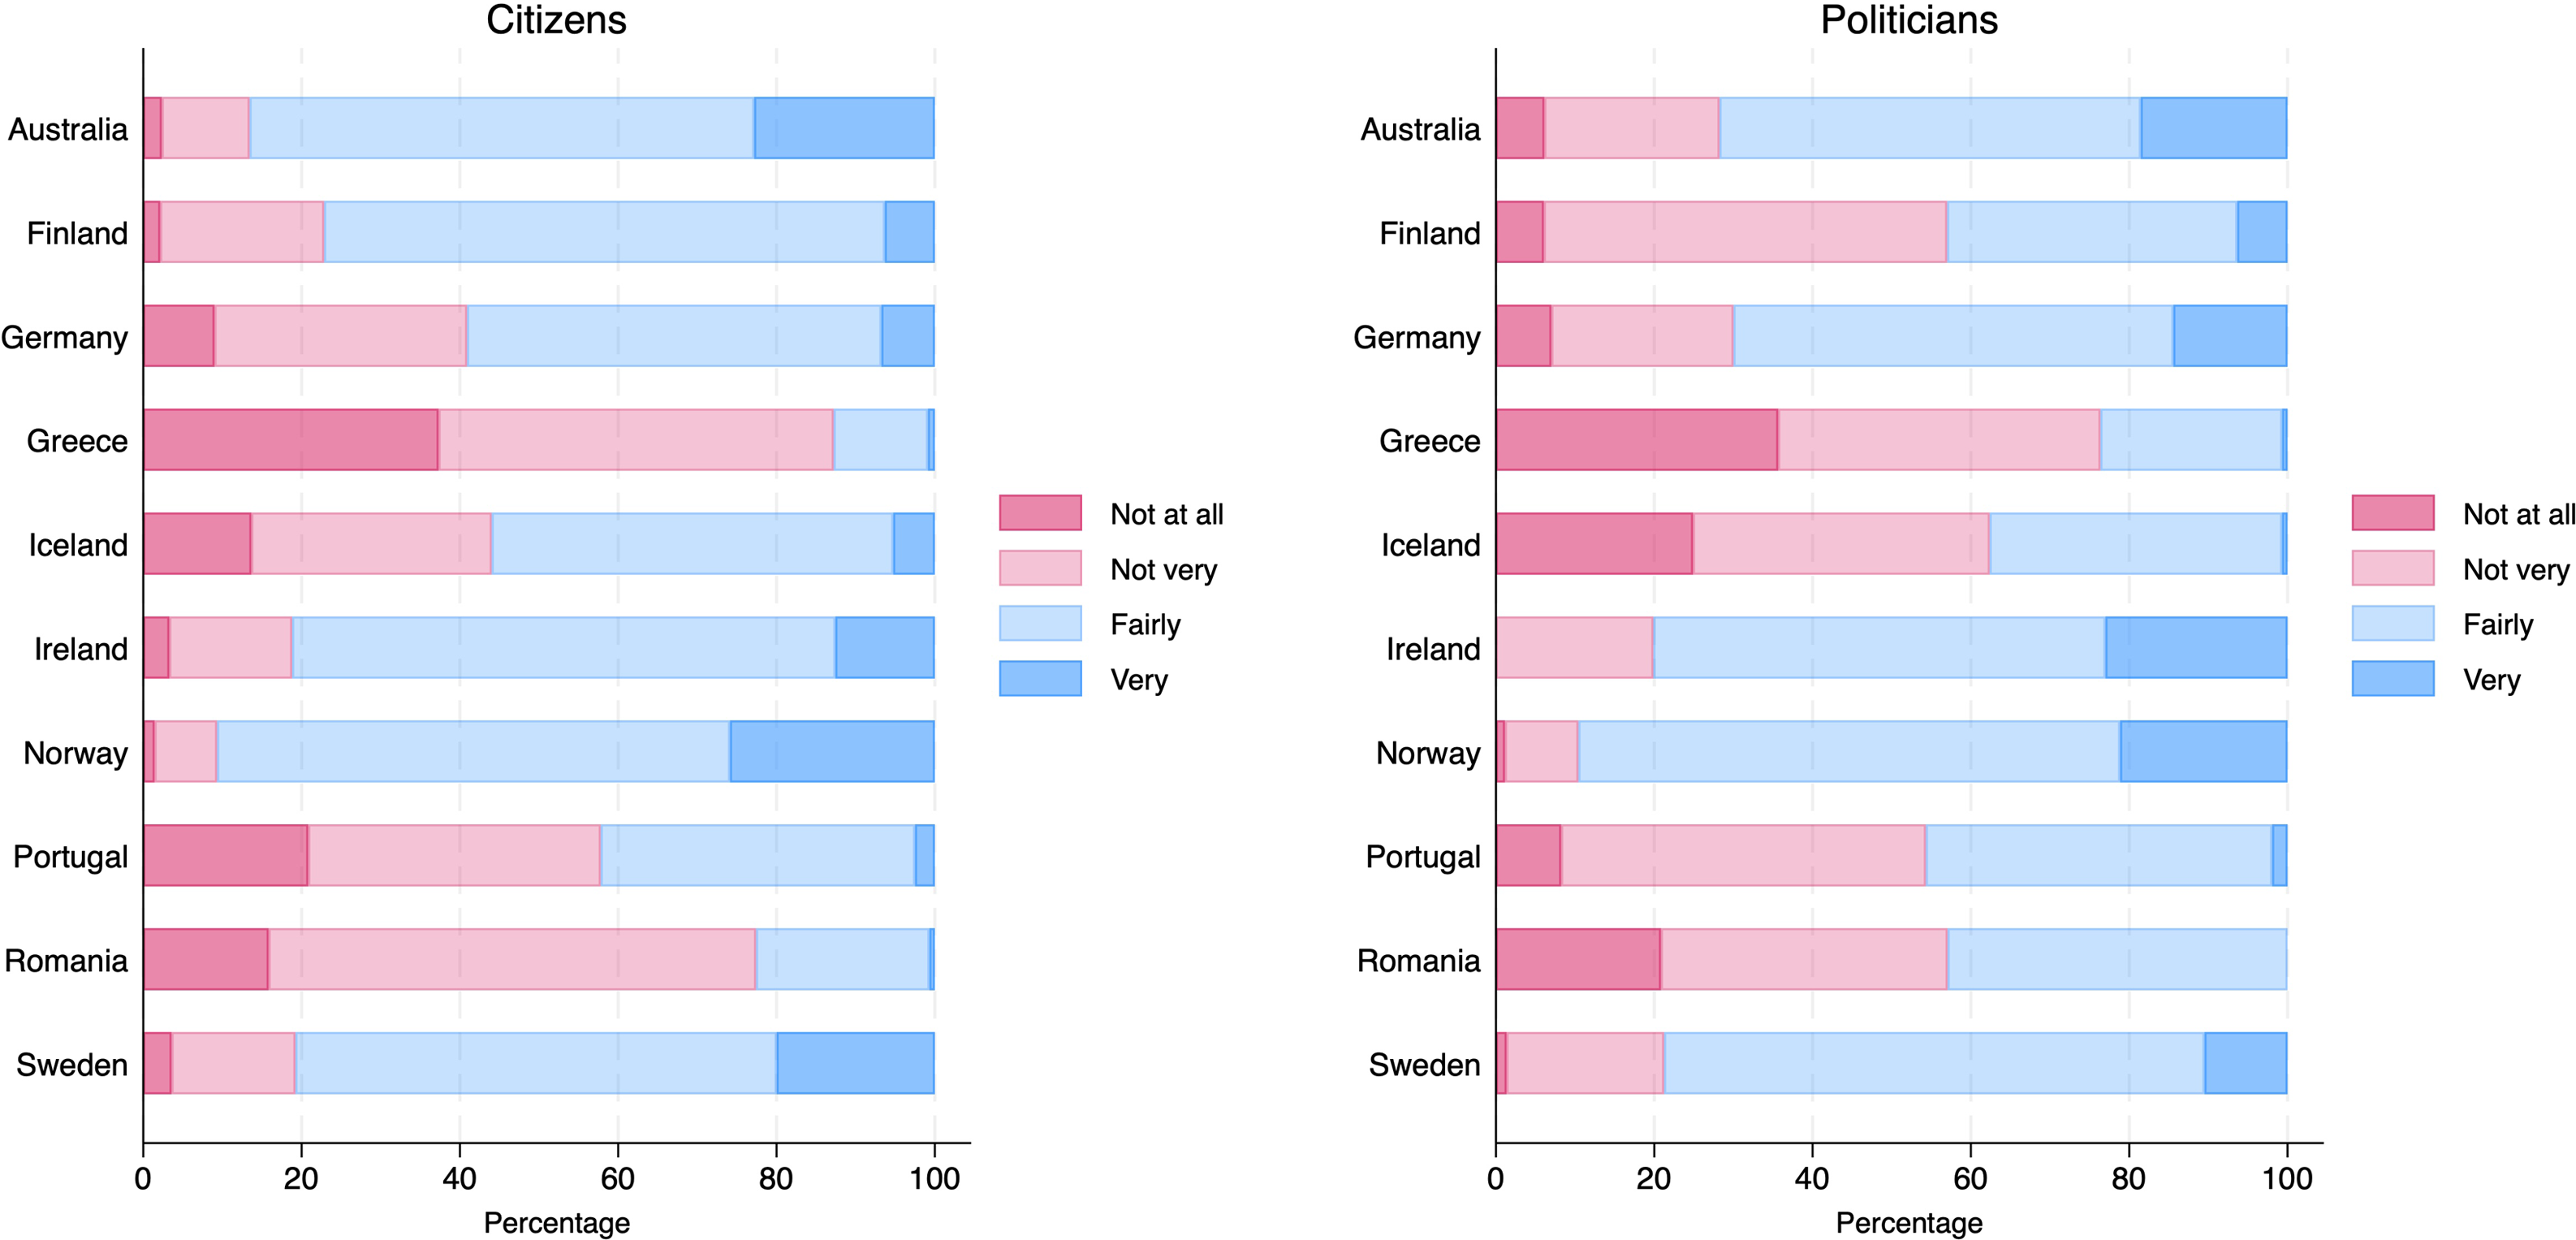
Figure 1. Distribution of democratic satisfaction among citizens and politicians.
Figure 1 shows that both citizens and politicians seem satisfied with the working of democracy in many countries. For example, in Australia, Germany, Ireland, Norway, and Sweden, more than 60% of the citizens and politicians are very or fairly satisfied, with democracy. However, politicians and citizens in Greece, Portugal, and Romania are the most unsatisfied with about 60% of the respondents being not at all or not very satisfied. The most likely reason that Greece’s citizens and politicians are the most dissatisfied out of the countries we analyzed in Figure 1 is because the 2015 Greek election was held just after the government agreed to a bailout agreement, even though the population voted against the proposal in a referendum. Such turnover might have generated a lot of frustration among citizens and politicians alike. Finland, and to a lesser extent Iceland, on the other hand, present a surprising pattern where a majority of politicians are unsatisfied with the way democracy works while a majority of citizens appear to be satisfied.
In Figure 2, we present the average difference in democratic satisfaction (the dots) between politicians and citizens by country with corresponding 95% confidence intervals (the horizontal lines). Dots to the right (left) of the vertical line 0 mean that politicians (citizens) are more satisfied on average.Footnote 3 While politicians seem more satisfied in many countries (Germany, Greece, Ireland, Portugal, and Romania), they also appear less satisfied in several others (Australia, Finland, Iceland, as well as Norway and Sweden to a lesser extent). While contextual factors specific to some elections might possibly explain those differences (e.g., the rise of the right-wing populist True Finns party during the 2011 Finnish election or the 2009 Icelandic election following the country’s 2008 financial crisis), temporal reasons are less apparent in other elections. It is also important to keep in mind that the results in Figures 1 and 2 are based on 16 elections across 10 countries. It would thus be imprudent to characterize those results as countries’ latent tendencies since contextual and idiosyncratic reasons may be prevalent. As such, it would be interesting in future studies to more attentively consider situations that generate such disconnect between citizens’ and politicians’ democratic satisfaction and then verify if similar tendencies are reported.
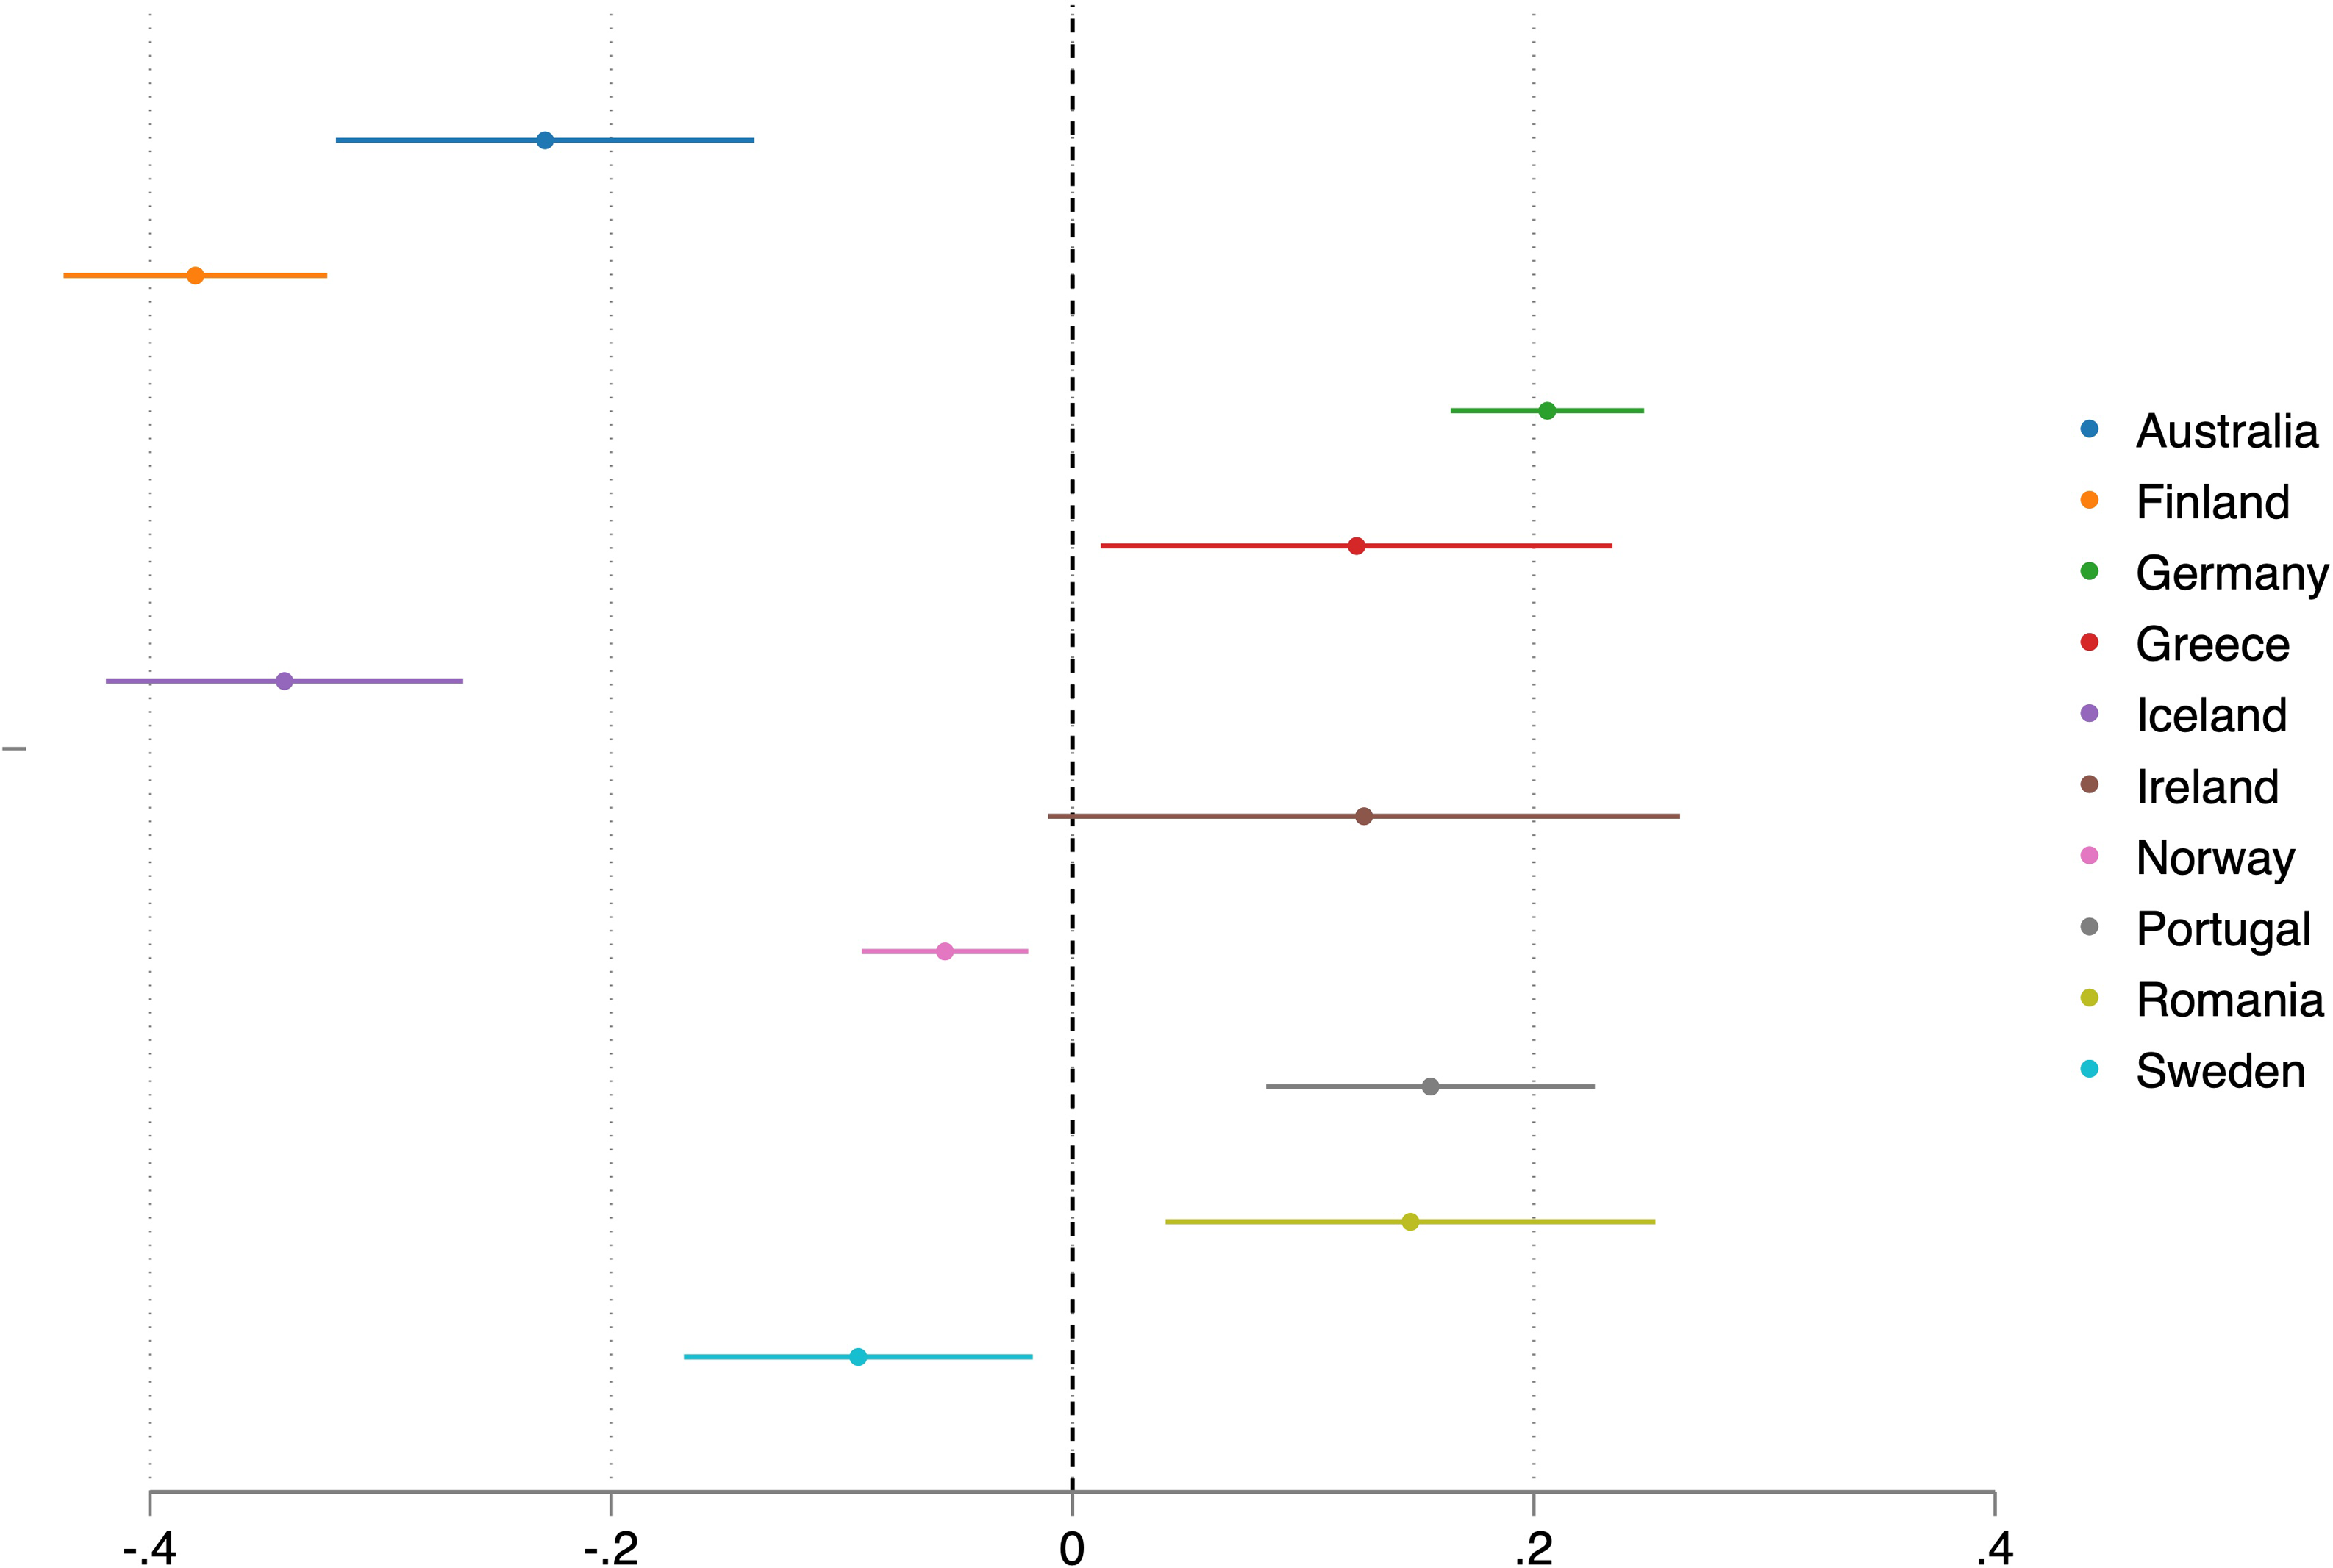
Figure 2. Difference in democratic satisfaction between politicians and citizens.
The role of ideological extremism and nicheness on citizens’ and politicians’ SWD
Studies highlighted the role of democratic dissatisfaction in voters’ support for radical left (Ramiro Reference Ramiro2016) and radical right (Arzheimer Reference Arzheimer2009) political parties. Radical voters have generally more extreme ideological positions and should thus be less satisfied than more centrist citizens.Footnote 4 Views from extreme left and right parties are often less represented in legislatures than the perspectives of mainstream centrist parties. Those parties therefore often form with the objective of heavily championing a small number of policy issues such as immigration (radical-right parties) or the environment (green parties) (Bélanger and Meguid Reference Bélanger and Meguid2008; Wagner and Meyer Reference Wagner and Meyer2014). As such, these niche parties often challenge the political system in which they compete, and their creation is often the result of a lack of coverage of those issues by mainstream political parties (Bischof Reference Bischof2017).
While individuals with more extreme ideological positions are less satisfied with the way democracy works, we might think this relationship to be stronger for politicians than citizens. In particular, more extreme and niche politicians who decide to engage politically and represent parties that challenge the status quo of the political system should be even more dissatisfied with the current state of affairs than citizens with similar ideological dispositions. However, we should expect the opposite for mainstream and centrist citizens and politicians – these politicians should be even more satisfied than their corresponding citizens. Centrist and mainstream parties are generally part of the government or have more influence among opposition parties because of their size in legislatures. They are clearly those who benefit more from the political system. Among politicians and citizens, we might therefore expect moderate and mainstream politicians to be those most satisfied with the working of the democratic system.
Analyses
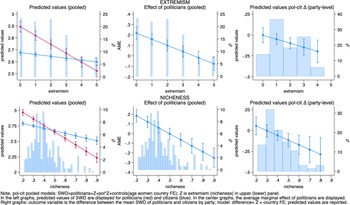
In Figure 3, we display the relationship between citizens’ and politicians’ democratic satisfaction and measures of extremism and party nicheness. To locate the ideological position of politicians and citizens, we use a common measurement strategy that consists of positioning respondents on a 0–10 left-right ideological scale. As such, we use respondents’ answers to the question, ‘In politics, people sometimes talk about the “left” and the “right.” Where would you place your own views on a scale from 0 to 10, where 0 means the most left and 10 means the most right?’. We transformed this individual-specific metric into 0–5 scores of extremism, where extreme left and right are combined. Parties’ nicheness is measured based on the indicator developed by Bischof (Reference Bischof2017), which considers whether a party is dominant in niche segments of the party competition and the broadness of its party platform. This indicator also has the benefit of being continuous and dynamic over time.

Figure 3. Citizens’ and politicians’ democratic satisfaction across extremism and nicheness.
We employ two empirical strategies in Figure 3. First, we pooled citizens’ and politicians’ data and estimated two separate OLS regressions where we regressed respondents’ democratic satisfaction on an interaction effect between politicians and extremism and nicheness, respectively.Footnote 5 The models control for gender and age and include country fixed effects (see Table A2 in the online Appendix for the full results). The upper (lower) left graph displays the predicted values of those regressions across values of extremism (nicheness) for politicians (red) and citizens (blue). The dots represent the predicted values, and the lines illustrate the 95% confidence intervals. In both panels, we observe that centrist and mainstream citizens/politicians are the most satisfied (scores of about 2.7–3.0). In contrast, as scores of extremism and nicheness increase, democratic satisfaction decreases for both politicians and citizens. It also appears that moderate and mainstream politicians are more satisfied, while extreme and niche politicians are less satisfied, than their corresponding citizens. This is why the red dots (politicians) are above blue dots (citizens) under low scores of extremism and nicheness, but below the blue dots under higher scores. In the center panels, the graphs display the corresponding average marginal effects (AME) of politicians across values of extremism and nicheness (this is literally the distance between the blue and red dots of the left panels with the associated 95% confidence intervals). The benefit of this visualization is to better identify which values of extremism and nicheness are statistically significant in differences of SWD across citizens and politicians (i.e., the AME of politicians). Under extremism, this is the case for scores between 0 and 2, as well as 5 (the most extreme position). Under nicheness, the AME of politicians are all statistically significant at the 0.05 level except when nicheness equals 0.5.
The second empirical strategy consists of comparing the democratic satisfaction of politicians with their own voters (citizens that support their party). We thus calculate the difference between the average democratic satisfaction of politicians and citizens by party and transform the pooled dataset into a party-level dataset of about 70 parties. We then regress this differential outcome variable on extremism and nicheness, respectively, while controlling for country fixed effects. In these new analyses, we kept the same parties’ nicheness scores as above. For locating parties’ extremism, we need a party-specific measure instead of the individual-specific measure that was used initially. We thus rely on the 0–10 left-right expert placement provided by the national election study teams that collaborated with the CSES.Footnote 6 In the right panels of Figure 3 (i.e., under ∆ pol-cit party-level), we show the predicted values of these two regressions across values of extremism and nicheness. Recall here that the predicted values now represent the difference between the average democratic satisfaction of politicians and citizens by party. Positive (negative) scores indicate that politicians are more (less) satisfied than their voters. The results are similar to those observed in the previous panels. Politicians are significantly less satisfied than their voters in niche and extreme parties. The situation is a bit more nuanced with respect to centrist and mainstream parties, where the differences fail to reach the conventional level of statistical significance, but the number of observations remains relatively low with about 70 parties.
Citizens, politicians, and the winner-loser gap in SWD
An established finding in the literature on citizens’ SWD is that winners at elections (citizens who voted for a party that formed the government) are typically more satisfied than losers (citizens who did not vote for a party that formed the government) (Anderson and Guillory Reference Anderson and Guillory1997; Blais and Gélineau Reference Blais and Gélineau2007). This is because winning procures satisfaction in itself (who prefers to lose a competition?) and winners might expect their preferred party in power to implement policies that better correspond to their preferences (Ferland Reference Ferland2017, Reference Ferland2021). In addition, one may claim having won or lost their election at the district and/or national level. Indeed, citizens – as it is for politicians – might face different configurations of victory/defeat when looking at who wins in their district and which party is part of the new cabinet. For example, Henderson (Reference Henderson2008) showed that winning at the national level generally matters more for voters than winning at local elections (see Blais and Gélineau (Reference Blais and Gélineau2007) for opposite findings).
Politicians might also face different configurations of victories or defeats. They could either win/lose in their district election and their party could be part or not part of the government. If their party joins a coalition government, it might also hold the position of the prime minister. All these types of wins should influence politicians’ democratic satisfaction. An individual win should be, arguably, much more significant for politicians since it assures them a job among other things. We might also expect the magnitude of the winner-loser gap to be greater for politicians than citizens given the time, energy, and financial resources politicians personally invest in their own electoral campaign and political party.
Similarly, we might expect incumbents to be more satisfied with democracy. Curini et al. (Reference Curini, Jou and Memoli2012) show that winning previous elections increases SWD, especially if voters are losers in the current elections. Incumbents also have firsthand experience of the policy-making process. They have access to many resources (office, budget, employees, etc.) to achieve their legislative and constituency responsibilities, and to promote their political agenda. While some representatives might encounter frustrations due to legislative gridlocks or even a lack of individual influence, we assume that incumbents generally enjoy their status, and this translates into higher SWD.
Analyses
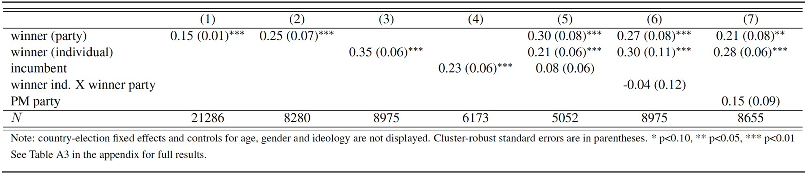
Data from the CSES and CCS combined with the ParlGov dataset (Döring et al. Reference Döring, Quaas, Hesse and Manow2022) identifies whether one’s party won the election – i.e., if citizens voted for a party that forms the government or if politicians ran under that party. CCS data also provides candidates’ self-reported answers to whether they were elected in the current election (17% of the respondents were elected) and in the previous election to identify incumbents (15% of the respondents). The results associated with citizens’ and politicians’ winner-loser gap are presented in Table 1. All models control for respondents’ gender, age, and ideological position and include country-election fixed effects. In columns 1 (citizens) and 2 (politicians), we compare the effect of a party win on citizens’ and politicians’ democratic satisfaction over the same pool of elections. The results support the classic finding that winners are more satisfied with the working of democracy. As expected, the effect is almost twice as big for politicians (0.25; p-value < 0.01) as it is for citizens (0.15; p-value < 0.01).
Table 1. The winner-loser gap in democratic satisfaction

In the remaining columns 3–7 of Table 1, we examine different configurations of politicians’ wins. We now leverage all data from the CCS project that permits such an investigation (i.e., not only data that matches CSES elections; see Table A1 in the online Appendix for the list of additional elections we use). The number of observations varies across columns 3–7 since not all questions were asked in each country-election survey (e.g., candidates were not always asked whether they were individually elected or incumbents, presumably because of ethical issues associated with the possibility of identifying them). Columns 3–4 present, respectively, the effect of individual wins and incumbency. The effect of an individual win (0.35; p-value < 0.01) seems slightly greater than a party win. Incumbents are also more satisfied by about 0.23 points (p-value < 0.01) as reported in column 4. In column 5, we examine the effects of all three variables simultaneously and notice that current election wins mostly drive the effect of incumbency reported in column 4 since the latter effect becomes not statistically significant when winner (individual) and winner (party) are in the model.
We then examine the interaction effect between winner (individual) and winner (party) in column 6 to establish which kind of win matters more for politicians. Indeed, a candidate could win their election in a district but see their party not joining the government, and vice versa, or could win or lose at both the individual and party levels. Modelling an interaction effect between the two variables allows distinguishing the effect of each scenario. The results in column 6 indicate that an individual win (coefficient of 0.30; p-value < 0.01) and a party win (coefficient of 0.27; p-value < 0.01) influence democratic satisfaction similarly. Note that each of these coefficients indicates the effect of the variable when the other variable equals 0. This is because the effect of the winner (individual) indicates the effect of an individual win when the candidate party did not join the government (i.e., winner (party) equals 0) – and vice versa. Moreover, an individual win combined with one’s party joining the government does not seem to increase one’s satisfaction. This effect is given by the coefficient of winner ind. The X winner party is in column 6 and is not statistically significant. Finally, the results in column 7 (restricted to situations of coalition governments) also indicate that one’s party holding the position of the prime minister in a coalition does not increase one’s satisfaction.Footnote 7
The role of electoral systems
A well-known finding in the SWD scholarship is that the winner-loser gap differs under majoritarian and consensual institutions. Anderson and Guillory (Reference Anderson and Guillory1997) found that the type of democratic system directly impacts how satisfied a winner or loser will be with their democracy. Winners in majoritarian systems are more satisfied than winners in consensual systems, while losers in consensual systems are more satisfied than losers in majoritarian systems, indicating that how power is distributed in political institutions affects SWD. According to Anderson and Guillory, this is because ‘consensual systems provide the political minority with a voice in the decision-making process […while] the more majoritarian the country’s institutions, the more winners get to have a say and impose their will on the minority’ (Anderson and Guillory Reference Anderson and Guillory1997, 68). This expectation has been confirmed in several studies; the winner-loser gap in democratic satisfaction is greater under majoritarian institutions than consensual institutions (Bernauer and Vatter Reference Bernauer and Vatter2012; Martini and Quaranta Reference Martini and Quaranta2019; Wells and Krieckhaus Reference Wells and Krieckhaus2006). The same gap also appears across majoritarian and proportional representation electoral systems since power-sharing is more prominent in the latter due to a higher number of coalition and minority governments (Anderson et al. Reference Anderson, Blais, Bowler, Donovan and Listhaug2005; Ferland Reference Ferland2015). We should therefore observe the same pattern among politicians.
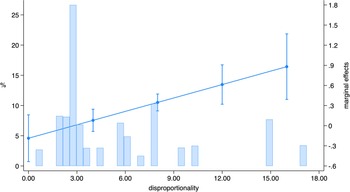
In Figure 4, we present the results of an interaction effect between the winner (party) and the Gallagher index of votes-seats disproportionality.Footnote 8 The model is based on a linear multilevel regression with random intercepts for political parties and countries, as well as a weighting procedure that balances the country samples (see the data, control variables, and the full results in Table A5 of the Appendix).Footnote 9 Corroborating the state of the literature about the conditional role of electoral systems on the winner-loser gap, the marginal effect of the winner (party) increases as disproportionality increases. When electoral results show no disproportionality, the effect of the winner is not statistically different than zero. In these cases, there is no gap between winners’ and losers’ democratic satisfaction. Then, as expected, we notice that the winner-loser gap in democratic satisfaction widens as electoral results become more disproportional. When disproportionality equals 15, winners are more satisfied than losers by about 0.8 points. This is almost an entire point on the democratic satisfaction scale.

Figure 4. The winner-loser gap across votes-seats disproportionality.
Discussion
In a recent literature review on democratic satisfaction, Singh and Mayne (Reference Singh and Mayne2023) reported more than 400 publications studying citizens’ SWD. Surprisingly, to our knowledge, none of these publications directly considered politicians’ democratic satisfaction. Given the crucial role that politicians play in representative democracies, this omission represents an important gap in the literature. Combining data from the CCS and the CSES, we show that politicians’ levels of SWD are not systematically higher than citizens’. In many democracies, citizens exhibit higher satisfaction. This is surprising given the role of politicians in the democratic process and the associated socialization mechanism that should presumably make them more satisfied. We also confirm that more ideologically extreme politicians and those from niche parties are both less satisfied than mainstream centrist politicians and are also less satisfied than corresponding extreme voters. Our results also corroborated empirical findings reported in previous studies, which relate to the winner-loser gap and the conditional role of electoral systems in the latter.
On a positive note, the similarity between the results for politicians and citizens validates the meaning (to some extent) of the SWD indicator and its use with politicians. The results also suggest that politicians, like citizens, are responsive to the democratic outcome of winning and losing, which corroborates studies challenging elite exceptionalism (Kertzer Reference Kertzer2022). Some results, however, are more worrying in terms of the state of democracy. For example, moderate and mainstream citizens are less satisfied than their corresponding politicians. For some, this might be just another instance of ‘critical citizens’ or ‘dissatisfied democrats’ (Dalton Reference Dalton2004; Norris Reference Norris1999). That said, if mainstream politicians are more satisfied than their corresponding voters, they are, presumably, less likely to address the causes of citizens’ dissatisfaction. This disconnect, where mainstream and moderate politicians are the most satisfied while all other politicians and citizens are less satisfied, also parallels some of the claims made by populists who challenge representative democracies on the basis that the ‘system’ is working for these specific elites. Better unraveling of this mass-elites gap seems especially important to consider in future studies.
We hope this research note lays the groundwork for a new research agenda in the scholarship on democratic satisfaction with a new focus on politicians. While several known determinants of citizens’ SWD might be considered in the future, such as corruption (Anderson and Tverdova Reference Anderson and Tverdova2003), quality of governance (Dahlberg and Holmberg Reference Dahlberg and Holmberg2014), and economic conditions (Cutler et al. Reference Cutler, Nuesser and Nyblade2022), scholars might also consider new determinants of democratic satisfaction specific to politicians, such as their campaign experience and resources, their internal efficacy as policymakers, party discipline, coalition dynamics, and their interaction with electoral management bodies during electoral campaigns, among other topics. Finally, in this period of democratic backsliding (Lührmann and Lindberg Reference Lührmann and Lindberg2019; V-Dem Institute 2025), investigating politicians’ democratic satisfaction appears to us to be even more essential. Democratic erosion often occurs through a slow period of deconsolidation in which political elites are pivotal (Levitsky and Ziblatt Reference Levitsky and Ziblatt2019). Evidence of dissatisfied politicians might be a prelude to this process.
Supplementary material
The supplementary material for this article can be found at https://doi.org/10.1017/S147567652510039X.
Data availability statement
The data that support the findings of this study are openly available in SWISSUBase at https://doi.org/10.48573/gy6m-ft70 (CCS I data) and https://doi.org/10.48573/hda9-am65 (CCS II data).
Acknowledgements
None.
Funding statement
This research was supported by the Social Sciences and Humanities Research Council of Canada under Grant #435-2023-0684.
Conflict of interests
None.


 Open access