


Introduction
The number of parties running in elections is determined mainly by the district magnitude (i.e. the number of seats awarded in a district). In Taagepera's and Shugart's words (Reference Taagepera and Shugart1993, p. 455), ‘… if one had to give a single major factor [that] determines the number of parties … it would have to be the district magnitude’. As the district magnitude increases, the number of effective and actual parties also increases, although the marginal impact of the district magnitude decreases (Carey & Hix, Reference Carey and Hix2011; Taagepera & Shugart, Reference Taagepera and Shugart1989). The coordination between candidates and voters on more parties when increasing the carrying capacity of electoral systems or districts constitutes the link between the district magnitude and the number of parties (Cox, Reference Cox1997).
This paper revisits the relationship between the district magnitude and the number of parties. We contend that electoral systems scholarship has omitted a crucial variable: whether the number of seats to be filled in a district is even or odd. We argue that elections are more competitive in low‐magnitude districts (i.e. districts with five or fewer seats) when the district magnitude is odd than even because votes are more quickly translated into seats in the former scenario. At the elite level, a district election's competitiveness relates to the marginal benefit of parties’ efforts to mobilise voters (Cox et al., Reference Cox, Fiva and Smith2020). At the voter level, the propensity to vote strategically increases with small margins between the last winning party and the first losing party (Cox, Reference Cox1997). The incentives for electoral coordination are thus expected to be stronger in odd district magnitudes than in even ones. Therefore, we expect more parties to receive votes in even district magnitudes than in odd ones, which we term the ‘odd–even effect’.
Our argument has important implications for research on electoral systems. The conventional wisdom establishes that the relationship between the district magnitude and the effective number of parties is not linearly but monotonically increasing (i.e., an increase in the district magnitude leads to an increase in the number of parties, but never to a decrease; Taagepera & Shugart, Reference Taagepera and Shugart1989). Conversely, we claim that in countries where national legislatures are elected using districts that vary in magnitude, the relationship between the district magnitude and the number of parties is non‐monotonic. In low‐magnitude districts, as the district magnitude increases by one unit, the number of parties increases when the number of seats to be awarded becomes even; however, this effect is unclear when the number of seats to be awarded becomes odd. The marginal impact of allocating an odd or even number of seats decreases, thus making no difference in high‐magnitude districts. The odd–even effect is expected to play a role in many electoral systems worldwide, particularly in proportional representation (PR) systems. According to the data compiled by Cox (Reference Cox1997, pp. 50−54) about district structures in 77 democracies circa 1992, 25 of them (i.e. 32.5 per cent) had low‐magnitude districts with varying magnitudes.Footnote 1 Our argument also has important implications for allocating resources when parties deploy their mobilisation strategies. Roughly speaking, parties should invest more heavily in low‐magnitude districts with odd numbers of seats than those with even numbers; concurrently, voters should have a greater propensity to vote strategically in the former districts than in the latter.
To demonstrate how an odd or even number of allocated seats in a district shapes the number of parties, we employed a quasi‐experimental design that explores lower house elections in Spain. Spanish elections are held under PR across 50 multi‐member and two single‐member districts (SMD). Each multi‐member district receives two seats (2 × 50 = 100), while the remaining 248 are apportioned according to population. As the electoral system has not been changed between 1977 and 2019 (including 15 elections), two features of Spain's elections allow us to estimate the odd–even effect. First, while the district magnitude ranges from 1 to 37 seats, there are no gaps in the district magnitude from 1 to 13 seats. Second, the number of seats increases or decreases in some districts from one election to the next only by one unit, such that even (or odd) district magnitudes become odd (or even) district magnitudes.
To determine the odd–even effect, we performed a pooled cross‐sectional time series analysis of 780 districts’ votes. The mechanisms for this effect were examined at the elite and voter levels. In addition, to explore the elite‐level causal mechanism driving the odd–even effect, we relied on a counterfactual comparison of mobilisation efforts in the lower house and European Parliament elections in Spain. Using data from low‐magnitude districts in lower house elections, we found that the percentage of wasted votes is smaller when the number of seats to be allocated is odd than when it is even.
Arguments
The precursor to our research is the received wisdom within electoral studies: the competitiveness of district elections shapes the behaviour of parties and voters. For instance, Cox et al. (Reference Cox, Fiva and Smith2020, p. 170) consider an election to be more competitive ‘when the competing parties have greater incentives to exert effort – which depends both on how uncertain the outcome is and how important it would be to change it’. With this definition in mind, a crucial implication becomes clear: parties’ decisions to mobilise depend on the distance in the shares of votes needed to gain a marginal seat in the district. Unsurprisingly, the closeness of districts’ electoral contests and turnout is strongly correlated, as people are likelier to feel that their vote ‘counts’ when an election is close, promoting higher turnout (Blais, Reference Blais2000, Reference Blais, Dalton and Klingemann2008). As candidates and parties are influential actors in providing voters with the necessary information to vote strategically, this point also has consequences for strategic voting (Cox, Reference Cox1997, p. 148).
Accordingly, we argue that in low‐magnitude districts, competitiveness is correlated with an unexamined feature of many electoral systems: whether the number of seats to be awarded in the district is odd or even. Cox et al. (Reference Cox, Fiva and Smith2020, p. 182) explain that, in low‐magnitude districts, large variations in vote share distances can occur, with the expectation that local elites would respond by adjusting their mobilisation efforts (i.e. more time spent getting out the vote when the race is close and less when the outcome appears inevitable). Our central point is that the marginal benefit of parties’ efforts to mobilise voters only increases when the district magnitude is odd. All else equal, the gain in vote shares that would earn an additional seat for a single party is smaller when the number of seats to be filled in a low‐magnitude district is odd than when it is even.
To further explain this observation, imagine a hypothetical area in which two large parties (A and B) and several small parties compete; their supporters are uniformly distributed across this area, which is carved into a mix of one‐seat, two‐seat, three‐seat, four‐seat and five‐seat districts to reflect population distribution. The seats are allocated by the d'Hondt rule – the most popular in multi‐member districts (Bormann & Golder, Reference Bormann and Golder2013).Footnote 2 For instance, suppose that the expected vote shares of A and B are 45 per cent for each. In the districts with an odd number of seats, very few votes can make the difference when deciding the winner of the last‐allocated seat. In a three‐seat district, the result in seats will be 2−1; whether the third seat is for A or B will depend on a relatively small number of votes. Conversely, in the two‐seat and four‐seat districts, the winning party must double the vote share of the runner‐up (strictly speaking, double plus one vote) to secure one more seat. Thus, it is highly likely that the result in seats for A and B would be 1−1 in the former and 2−2 in the latter. In other words, parties A and B must bear the cost to gain a marginal seat which is much lower in low‐magnitude districts that allocate an odd number of seats than in low‐magnitude districts with an even number of seats. In high‐magnitude districts, whether the district magnitude is odd or even does not play any role.
The strength of the odd–even effect depends on the number of parties entering the district races and the distribution of partisan support across parties. Imagine the same district structure of the previous example; only now, the vote shares of parties A and B are 60 and 30 per cent, respectively. In low‐magnitude districts with an even number of seats (i.e. those with two or four seats), elections are more competitive than in low‐magnitude districts with an odd number of seats (i.e., in single‐member or three‐seat districts). In the two‐ and four‐seat districts, the winner of the last‐allocated seat will depend on a relatively small number of votes; in the single‐member or three‐seat districts, the result in seats will assuredly be 1−0 and 2−1, respectively. Generally, the smaller the vote percentages separating the two largest parties (A and B in the examples) and the greater the vote shares of the remaining parties, the stronger this odd–even effect. Although these two distributions of partisan support are possible, the most conventional district‐level party system comprises two large parties with a relatively similar level of support and several small or medium‐to‐large parties. In the empirical analysis, we rely on different party system configurations to show the robustness of our argument.
Similarly, any change in the distribution of partisan support is more likely to benefit the largest parties when the electoral formula is more disproportional; thus, the more disproportional the electoral formula employed in multimember districts, the stronger the odd–even effect. There are infinite combinations of the number of parties and the distribution of partisan support. Nevertheless, our example of two large parties and several small or medium‐to‐large parties is the most conventional district‐level party system.
We claim that an odd or an even district magnitude has noticeable partisan political consequences, which we term the odd–even effect. All else equal, if the district magnitude varies across low‐magnitude electoral districts, so should the nature of party competition. There will be less fractionalisation and fewer parties receiving votes within low‐magnitude districts with an odd number of allocated seats than within low‐magnitude districts with an even number of seats. Two mechanisms at the elite and voter levels explain this relationship.
The elite‐level mechanism
An uncontroversial claim in the literature on electoral systems is that the process of voting strategically is mediated by elites – indeed, elites will observe that a race is close and that votes for weak candidates are wasted. Voters, in turn, buy this argument and act accordingly (Cox, Reference Cox1997, pp. 90, 98). This is a reasonable argument, given the negligible influence of a vote on the outcome (Meehl, Reference Meehl1977; Riker, Reference Riker1982). For instance, through a series of lab experiments, Merolla (Reference Merolla2009) shows that information signals from candidates and interest groups on the competitive context of a race will increase the likelihood of strategic voting. As low‐magnitude districts with an odd number of allocated seats are more competitive than low‐magnitude districts with an even number of allocated seats, large parties’ mobilisation efforts – and thus, district‐level coordination – should be greater in the former than in the latter.
The few incentives to mobilise voters when the number of seats to be filled in low‐magnitude districts was even were exemplified by the binomial electoral system employed in Chile from 1989 to 2013.Footnote 3 As explained by Carey and Siavelis (Reference Carey and Siavelis2005, p. 6 and 18), in a district where the coalition is willing to settle for the one‐one split between first‐ and second‐place lists, most common in Chilean elections, a strong candidate has every reason to prefer being paired on a list with a relatively weak partner. To be the strong candidate on such a list is a guarantee of personal victory. To be nominated in a district where one's coalition aspires to double means facing competition not only from other lists but also from one's list partner. In other words, if the coalition does not double its opponents, a given candidate may even lose the intra‐list competition to that candidate's coalition partner, thus losing the legislative seat.
The voter‐level mechanism
According to conventional wisdom, ties are more likely to occur in close races, so strategic voting should be boosted (Aldrich et al., Reference Aldrich, Blais, Stephenson, Stephenson, Aldrich and Blais2018; Alvarez & Nagler, Reference Alvarez and Nagler2000; Cain, Reference Cain1978; Cox, Reference Cox1997). McKelvey and Ordeshook's (Reference McKelvey, Ordeshook, Herndon and Bernd1972) model demonstrated that, in a multi‐party election, a voter might be willing to vote for her secondfavourite party under two conditions: if the favourite party is unlikely to win and if there is a close contest between the second‐ and third‐ranked parties. The closer the contest between the leaders, the more an elector will feel she can influence the result by casting a strategic vote. Since the distance in vote shares needed to gain a district seat is smaller in low‐magnitude districts with an odd number of allocated seats than in those with an even number of allocated seats, strategic voting should be greater in the former than in the latter.
When combining the elite‐ and voter‐level mechanisms, an important consequence of the odd–even effect emerges. In low‐magnitude districts, when increasing the district magnitude by one seat, thereby moving from an odd to an even number of seats to allocate (i.e. from a SMD to a two‐seat district or from a three‐seat district to a four‐seat district), the number of effective parties should increase. That is, the carrying capacity of the district becomes greater, and the incentives to coordinate the large parties drop. Conversely, when moving from an even to an odd number of seats to allocate (i.e., from a two‐seat to a three‐seat district or from a four‐seat district to a five‐seat district), we may expect a lower degree of party system fragmentation. Although the carrying capacity of the district is greater, coordination from the large parties should also increase. Thus, when increasing (decreasing) the district magnitude by one unit, the increase (decrease) in the effective number of parties should be greater in districts with an even (odd) number of seats.
In districts with an odd number of seats, the effective number of parties should increase with the district magnitude (e.g. when moving from a SMD to a three‐seat district) because the incentives for coordination are more or less similar, and the carrying capacity of the district increases. Finally, in high‐magnitude districts, whether the number of seats is odd or even is irrelevant, given that the marginal impact of an additional seat on the number of parties is decreasing.
Although scholarship on electoral systems has overwhelmingly focused on the role of the district magnitude in shaping the number of parties, surprisingly, the impact of even and odd district magnitudes remains unexplored. The basic insight is that the number of effective parties increases with the district magnitude across (Carey & Hix, Reference Carey and Hix2011; Cox, Reference Cox1997; Rae, Reference Rae1971) and within (Benoit, Reference Benoit2001; Kedar et al., Reference Kedar, Harsgor and Tuttnauer2021) electoral systems. More specifically, the relationship between the district magnitude and fragmentation follows a curvilinear function: the marginal effect of the district magnitude on the number of parties diminishes as district size increases (Taagepera & Shugart, Reference Taagepera and Shugart1989). One of Taagepera's (Reference Taagepera2007) research's key findings is that the effective number of parties (ENP) increases according to the formula $ENP\ = {( {MS} )}^{1/6}\ $, where M is the seats in the districts and S is the seats in the legislature.Footnote 4
In summary, the conventional wisdom establishes that the relationship between the district magnitude and the ENP is not linearly but monotonically increasing (i.e. an increase in the district magnitude in general leads to a rise in the number of parties but never a decrease). Unlike countries using exclusively SMD or multi‐member districts that each return the same number of seats (e.g. Malta), most national legislatures are elected using districts that vary in magnitude – thus allocating an even or odd number of seats. Moreover, the most prevalent electoral system in the democratic world is a districted PR with varying district magnitudes (Kedar et al., Reference Kedar, Harsgor and Tuttnauer2021; Monroe & Rose, Reference Monroe and Rose2002).
Accordingly, we argue that, in districted PR systems, the relationship between the district magnitude and the number of parties is non‐monotonic. In low‐magnitude districts, as the district magnitude increases by one unit, the number of parties increases when the number of seats to be awarded is even; however, this effect is uncertain when the number of seats to be filled is odd. More specifically, when the number of seats to be filled in low‐magnitude districts increases, there is an upward trend in the number of parties. However, when the district magnitude is odd, the number of parties increases; when the district magnitude is even, it seems to level off – or even fall. In high‐magnitude districts, the marginal impact of allocating an odd or even number of seats decreases, so it makes no difference. We must explore this odd–even pattern in low‐magnitude districts to accurately explain or forecast the effective number of parties in a specific district or country.
The following discussion generates three hypotheses:
-
Hypothesis 1. Conventional wisdom.
The relationship between the district magnitude and the effective number of parties is monotonically increasing.
-
Hypothesis 2. The odd–even effect.
The relationship between the district magnitude and the effective number of parties is non‐monotonic, with more parties in low‐magnitude districts with an even number of allocated seats than in low‐magnitude districts with an odd number of seats.
-
Hypothesis 3. The scope of the odd–even effect.
The odd–even effect is confined to low‐magnitude districts.
Data and methods
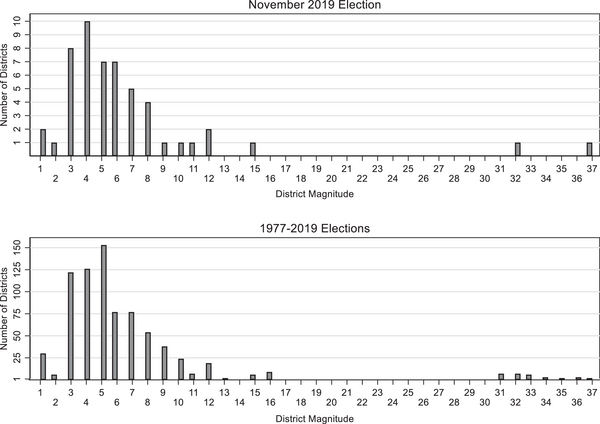
To investigate whether the odd–even effect is associated with the number of parties, we focused on the 15 lower house elections held in Spain from 1977 to 2019. Spain's electoral system offers a unique opportunity to examine the odd–even effect. lower house elections in Spain are held under a PR system using the d'Hondt formula and closed lists across its 52 districts, with no upper tier or compensatory seats. The number of MPs totals 350. Two (Ceuta and Melilla, semi‐enclaves in Morocco) are SMD, while the remaining 50 districts are multi‐member and use the existing administrative divisions (provinces) established in 1833 (unchanged since). Each multimember district receives two seats (2 × 50 = 100), while the remaining 248 seats are apportioned according to population. Figure 1 shows the district structure of the most recent election (November 2019) and the cumulative data from the 15 elections since 1977.

Figure 1. District structure in Spain.
Spain meets the conditions needed to identify the odd–even effect far more effectively than others, making it the ideal case study for this exploration. First, its district magnitude ranges from 1 to 37 seats; from 1 to 13 seats, there are no gaps in its district magnitude. In the 15 elections we examined, we had data from 780 districts (52 × 15). The average district magnitude is 6.73, the standard deviation is 5.96, and the mode is 5. As visible in the bottom panel of Figure 1, there are 30 SMD, 6 two‐seat districts, 122 three‐seat districts, 126 four‐seat districts, 153 five‐seat districts, 77 six‐seat districts, 77 seven‐seat districts, 54 eight‐seat districts, 38 nine‐seat districts, 24 ten‐seat districts, 7 eleven‐seat districts, 19 twelve‐seat districts, 2 thirteen‐seat districts, 6 fifteen‐seat districts, 9 sixteen‐seat districts, 7 thirty‐one‐seat districts, 7 thirty‐two‐seat districts, 6 thirty‐three‐seat districts, 3 thirty‐four‐seat districts, 2 thirty‐five‐seat districts, 3 thirty‐six‐seat districts and 2 thirty‐seven‐seat districts. By contrast, in the legislative electoral systems employed in some Latin American countries, such as Argentina, Colombia, Dominican Republic or Ecuador, the distribution of district magnitudes has no gaps or few gaps, according to the data provided by Cox (Reference Cox1997, pp. 50−53). However, the number of seats in these countries’ districts is relatively small (24, 26, 30 and 22, respectively) and reliable district‐level results for all districts and elections were unavailable.
Second, due to changes in apportionment, in 31 out of 52 districts, the number of seats increased or decreased from one election to the next only by one unit – meaning that even (odd) district magnitudes became odd (even) district magnitudes.
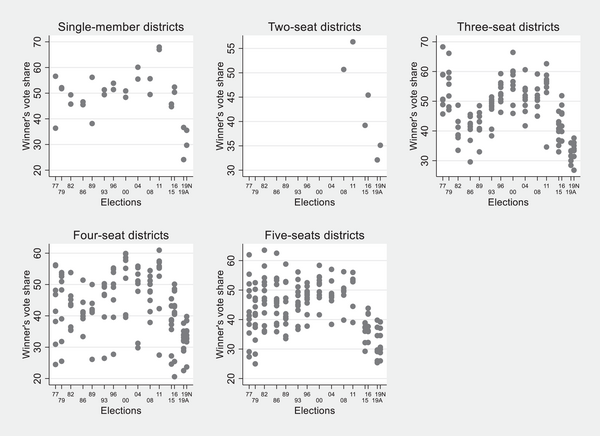
Third, Spain is regionalised and fractionalised to the degree that different party system configurations emerge across districts and over time. This allows us to show the robustness of the odd–even effect to a different number of parties entering the district races and varying distributions of partisan support across parties. In Figure 2, we show the variation of the district winner's vote share in low‐magnitude districts across elections in our sample of elections in Spain. For instance, in the three‐seat districts, it ranges from 26.7 in November 2019 to 68.3 per cent in 1977. If we focus on specific elections, for instance in the last election included in the sample, in November 2019, the district winner's vote share ranged from 21.95 to 39.79 per cent.

Figure 2. District winners’ vote shares in low‐magnitude districts in Spain.
The empirical analysis proceeded in two steps. First, we examined 780 districts in Spain's lower house elections for evidence of the odd–even effect. Second, the causal mechanisms accounting for this effect are explored at the elite and voter levels. To accomplish this, we employed data from Spain's party mobilisation efforts in lower house and European Parliament elections and the district variation in the percentage of wasted votes in lower house elections.
The odd–even effect
To examine the odd–even effect, we built a data set including all district election data for the 15 lower house elections held since the restoration of democracy in 1977. The dependent variable is the effective number of electoral parties, ENP, as previously defined. The data source is Spain's Ministry of the Interior (https://infoelectoral.interior.gob.es/opencms/es/elecciones‐celebradas/resultados‐electorales/). The key explanatory variable was whether the number of seats to be filled in a district was even or odd. To show the robustness of our results, we used four measures.
-
• We created a variable, inverse of odd district magnitude, which is equal to $\frac{1}{{{\mathrm{District}}\;{\mathrm{magnitude}}}}$ when the number of seats to be filled in the district is odd and equal to 0 when the number of seats to be filled in the district is even. For instance, the score is 1 in a SMD, 0.33 in a three‐seat district and 0.03 in a 31‐seat district. Our general expectation was that as the district magnitude rises, the effective number of parties would increase. But we also expected this relationship would be weaker when the number of seats to be allocated was odd in low‐magnitude districts. Thus, the estimated effect on the inverse magnitude variable would take the opposite sign from that of the simple magnitude variable. As even district magnitudes were coded 0 in the inverse magnitude variable, the variable exclusively captures the effect for odd district magnitudes. The expected effect of the variable is negative: the greater the value, the greater the negative impact of odd district magnitudes on ENP.
 -
• We also created a dummy variable to distinguish three types of districts: small districts with an odd number of seats, large districts with an odd number of seats and districts with an even number of seats. We considered low‐magnitude districts to be those with five or fewer seats. Following Carey and Hix (Reference Carey and Hix2011, p. 385), the strategic calculations for voters in a low‐magnitude multi‐member district should resemble those for SMD. The empirical evidence from Colombia, Japan and Spain shows that strategic voting does not explain much about the number of parties in districts with a magnitude above five (Cox, Reference Cox1997: Ch. 5; Cox & Shugart, Reference Cox and Shugart1996). The main reason is that the larger the district's magnitude, the smaller the vote percentages separating winners from losers. Accordingly, voters’ expectations regarding who wins and loses become less clear and less well‐coordinated. Relying on observational data, Carey and Hix (Reference Carey and Hix2011) found that increasing the district size from one to five seats increases the number of effective parties in a parliament by around one and increases the number of parties in government by about half. Similarly, when replicating Carey's and Hix's findings in a lab, St‐Vincent et al. (Reference St‐Vincent, Blais and Pilet2016) found that the growth in the number of parties mostly occurs between low‐ and medium‐district magnitude and that the shape of the curve is almost flat after a district magnitude of five. We thus expected that ENP would be lower in the small districts with an odd number of seats than in the other two groups of districts.
-
• A dummy variable, odd district magnitude, was coded 1 when the number of seats allocated in a district is odd; else, it was coded 0. We tested an interaction term, (log) District mag. × Odd district magnitude, to determine whether the effect of the district magnitude drops when the district magnitude is odd. Given that we expected the odd–even effect to only influence low‐magnitude districts, it was particularly important to generate predictions about how the marginal effect of an odd district magnitude on the number of parties varies in line with the number of seats to be filled in the district (Berry et al., Reference Berry, Golder and Milton2012).
-
• We tested the model, including the interaction (log) District mag. × Odd district magnitude for a subsample, including only small districts (i.e. those with five or fewer seats).

We controlled for the (log of) district magnitude in every district and election. Similarly, the explained variable was lagged by one election and included in the right hand of the equation to deal with using autocorrelation; to capture idiosyncratic district factors and election fixed effects and, thus, differences in party system fragmentation over time, we also include district fixed effects. However, including individual fixed effects and the lagged explanatory variable simultaneously can lead to a bias in the estimates, particularly when the number of time points (T) is not large enough (Beck & Katz, Reference Beck and Katz2011).Footnote 5 In our sample, T was 14 for all districts; thus, the potential bias was not a major concern. We checked the robustness of our results using a two‐step system, the generalised method of moments estimation, through the xtabond2 command in Stata; the results were qualitatively the same.
The basic specification used to test the conventional wisdom was as follows:
 $$\begin{eqnarray} {\it{ENE}}{P}_{ie} &=& {\alpha }_i + {\beta }_1ENE{P}_{ie - 1} + \ {\beta }_2\left( {{\mathrm{log}}} \right){\it{District\;magnitud}}{e}_{ie} + {\beta }_3{\it{District\;fixed\;effect}}{s}_i\nonumber\\ &&+ {\beta }_4{\it{Election\ fixed\ effect}}{s}_e + {\varepsilon }_{ie}, \end{eqnarray}$$
where i refers to the district and e to the election. The odd–even effect was tested in different models by adding the following to (1): the inverse of odd district magnitude, the dummy variable distinguishing three types of districts, odd district magnitude and the subsample of small districts.
The odd–even effect was studied by conducting a pooled cross‐sectional time series analysis of the 780 districts from 1977 to 2019. The models were estimated using the ordinary least squares (OLS) method with cross‐sectional data. Due to the dependency on the data structure, the robust standard errors were clustered by country. Finally, the Levin–Lin–Chi bias‐adjusted t‐statistic was 2.38, statistically significant at the 0.01 per cent level. Thus, we concluded that the series was stationary.
Exploring the mechanisms
The elite level
We examined the elite‐level mechanism that potentially accounts for the odd–even effect. That is, the mobilisation efforts of large parties are greater in low‐magnitude districts with an odd number of allocated seats than in those with an even number. We focused on two of Spain's largest parties, the right‐wing Partido Popular (PP – People's Party) and the left‐wing Partido Socialista Obrero Español (PSOE – Spanish Socialist Workers’ Party), in the 2009 European Parliament election and 2011 Spanish lower house election for three reasons.
First, Spain's lower house elections employ a districted electoral system with varying district magnitudes. However, in European Parliament elections, this is replaced with a single national district that allocates 50 seats. The two elections are held under a PR system using the d'Hondt formula and closed lists. Our first expectation was that parties would have a strong incentive to focus their mobilisation efforts on the most populated areas in lower house and European Parliament elections. In lower house elections, the payoff in seats of any given increment of votes due to mobilisation efforts is greater in high‐magnitude districts; in contrast, the payoff in seats of any given increment of votes is the same everywhere for European Parliament elections, but parties can secure more votes with the same effort in the most populated areas due to economies of scale (Cox, Reference Cox2015). However, the rate at which a mobilising party gains seats by gaining more votes varies between low‐magnitude districts. Thus, should the odd–even effect matter, our second expectation was that parties would also invest in low‐magnitude districts with an odd number of allocated seats in lower house elections but, in European Parliament elections, would not invest in sparsely populated areas. Therefore, we expected that the effect of province population would be stronger in lower house elections when the district magnitude was odd than when even.
Second, given that only 2 years elapsed between the two elections, the party systems were similar; the ‘all else being equal’ assumption thus holds when accounting for how mobilisation efforts should be distributed across geographical areas. The two largest parties, the PSOE and the PP, secured 80.9 per cent of the votes in the 2009 European Parliament election and 73.4 per cent of the votes in the 2011 lower house election.
Third, the PSOE and the PP were viable competitors in all the provinces; therefore, this variable did not drive their mobilisation efforts.Footnote 6
The unit of analysis for the two elections was the administrative divisions (provinces) which constitute the districts in lower house elections, plus Ceuta and Melilla. The sample was restricted to the 27 districts (provinces) with five or fewer seats in lower house elections. The dependent variable was a dummy, coded 1 if a province was visited during the election campaign by the candidate that topped the list in the 2009 European election (Juan Fernando López Aguilar for the PSOE; Jaime Mayor Oreja for the PP) and the candidate that topped the list put out by the district of Madrid in the 2011 lower house election (Alfredo Pérez Rubalcaba for the PSOE; Mariano Rajoy for the PP) and 0 otherwise.Footnote 7 Party leaders’ visits and the public rallies they organised during the 15 days of legal campaigning fulfilled the condition of being a limited resource for parties because they were money‐ and time‐consuming activities. Hence, this measure captures the distribution of mobilisation efforts (Lago et al., Reference Lago, Bermudez, Guinjoan, Rowe and Simon2019). In the 2009 European Parliament election, the PSOE and PP leaders visited six and five out of 27 provinces, respectively; in the 2011 lower house election, the PSOE and PP leaders visited four and eight of these 27 provinces, respectively. The source of these data was the Making Electoral Democracy Work project (Blais, Reference Blais2010).
Three independent variables were included in the models. First, the province population was measured as the national share of individuals entitled to vote in each province. Second, we used a dummy variable, lower house election, coded 1 for the lower house election and 0 for the European Parliament election, to show that mobilisation efforts regarding party leaders’ visits were similar in the two elections. Finally, we used a dummy variable, coded 1 if the province (district) allocated an odd number of seats in the lower house election or 0 if the number of seats was even in the lower house election (and in all provinces in the European Parliament election).
We ran two models. Our first expectation – in both elections, mobilisation efforts are driven by province population – was tested with specification (2):
 $$\begin{equation}Visi{t}_{pie} = {\alpha }_i\ + {\beta }_1Populatio{n}_{pie} + \ {\beta }_2Lower - house\ electio{n}_{pie} + {\varepsilon }_{pie}.\end{equation}$$
where p refers to the party, i to the province and e to the election. The odd–even effect was tested with the interaction $Population\ \times Odd\ district\ magnitude$:
 $$\begin{equation} \def\eqcellsep{&}\begin{array}{l} Visi{t}_{pie} = {\alpha }_i\ + {\beta }_1Population\;s{q}_{pie} + {\beta }_2Odd\;district\;magntiud{e}_{pie}\\ + \ {\beta }_3Population \times Odd\;district\;magnitud{e}_{pie} + \ {\varepsilon }_{pie}. \end{array} \end{equation}$$
The models were estimated using probit regression. The PSOE and PP observations in both elections were merged; due to the dependency in the data structure, the robust standard errors were clustered according to party.
The voter level
According to our argument about the odd–even effect, voters have more incentives to coordinate on viable parties in low‐magnitude districts with an odd number of allocated seats than in low‐magnitude districts with an even number. Our measure of district‐level coordination is the percentage of wasted votes in lower house elections: the greater the number of wasted votes, the less coordination. Therefore, in odd district magnitudes, we expected to find that the percentage of wasted votes would be smaller than in even district magnitudes.
The conventional wisdom about electoral coordination – or the psychological effect of electoral systems – contends that at least two elections must pass for coordination to manifest, given that, in founding elections, political actors do not know the political landscape or competitors’ electoral strength (Taagepera & Shugart, Reference Taagepera and Shugart1989, p. 65). For this reason, we excluded the 1977 founding election from our analysis. In line with our argument and the empirical evidence from our previous analysis, we focused on low‐magnitude districts (i.e. electing five or fewer seats).
In addition, the two SMD of Ceuta and Melilla were removed from the sample because the notion of vote‐wasting is nonsensical in SMD elections. Under SMD, there is only one winner per district, and all votes not cast for the winner are thus ‘wasted’. As Tavits and Annus (Reference Tavits and Annus2006, p. 76) claim, failing to vote for the winner in an SMD election is not the strategic challenge the electorate faces.
We ran two models to test our hypothesis. We first examined whether the percentage of wasted votes at the district level is driven by the (log of) district magnitude:
 $$\begin{eqnarray} {\it{Wasted\;vote}}{s}_{ie} &=& {\alpha }_i\ + {\beta }_1\left( {{\mathrm{log}}} \right){\it{District\;magnitud}}{e}_{ie} + {\beta }_2{\it{District\;fixed\;effect}}{s}_i\nonumber\\ &&+ {\beta }_3{\it{Election\;fixed\;effect}}{s}_e + {\varepsilon }_{ie,} \end{eqnarray}$$
where i refers to the district and e to the election. The odd–even effect was tested with the parameter $Odd\ district\ magnitud{e}_{ie}$ in specification (6):
 $$\begin{eqnarray} {\it{Wasted\;vote}}{s}_{ie} &=& {\alpha }_i\ + {\beta }_1\left( {{\mathrm{log}}} \right){\it{District\;magnitud}}{e}_{ie} + {\beta }_2Odd\;{\it{district\ magnitud}}{e}_{ie}\nonumber\\ &&+ \ {\beta }_3{\it{District\;fixed\;effect}}{s}_i + {\beta }_4{\it{Election\;fixed\;effect}}{s}_e + {\varepsilon }_{ie}. \end{eqnarray}$$
The models were estimated using the OLS method with cross‐sectional data to maximise the number of observations. If we included a lagged value of the dependent variable in a pooled cross‐sectional time series analysis, the number of districts would substantially drop. Due to the dependency on the data structure, the robust standard errors were clustered by the district.
Results
The odd–even effect
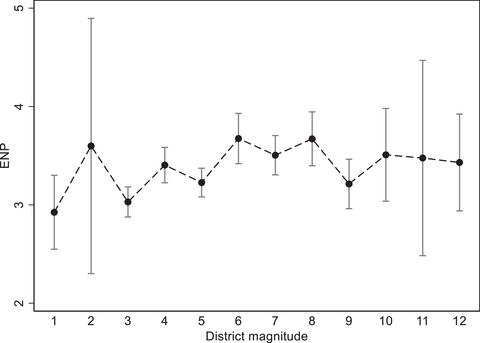
The first evidence supporting the notion that the odd–even effect is real and vital is provided in Figure 3. We focused on the districts in Spain's electoral system with no gaps in the district magnitude – those with 1−12 seats in the 15 elections during the 1977−2019 period. The two districts awarding 13 seats were excluded because of the meagre number of observations. Overall, we studied 733 out of 780 districts (94.0 per cent) ranging from 6 two‐seat districts to 153 five‐seat districts. We plotted the average ENP and 95 per cent confidence intervals for every district magnitude.

Figure 3. The odd–even effect of district magnitude. ENP, effective number of parties.
As evident in the figure, the relationship between the district magnitude and the effective number of parties is far from showing a monotonically increasing trend. Regarding the low‐magnitude districts, in districts with two, four and six seats, we found that ENP is larger than in districts awarding one, three and five seats. This finding coheres with the conventional wisdom, which states that the greater the carrying capacity of districts, the greater the number of parties. However, intriguingly contradicting the conventional wisdom, in districts with two, four and six seats, we observed that ENP is also greater than in districts with three, five and seven seats. This supports our second hypothesis regarding the odd–even effect. However, the only statistically significant differences are between three‐ and four‐seat districts (t = 3.13, p = 0.002) and between five‐ and six‐seat districts (t = 3.24, p = 0.001). In other words, allocating one more seat in a low‐magnitude district only affects the number of parties when the new district magnitude is even.
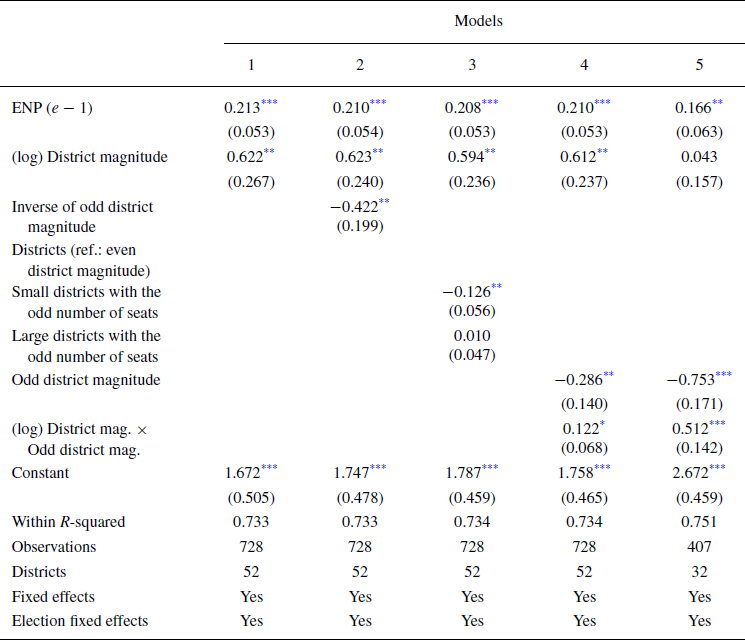
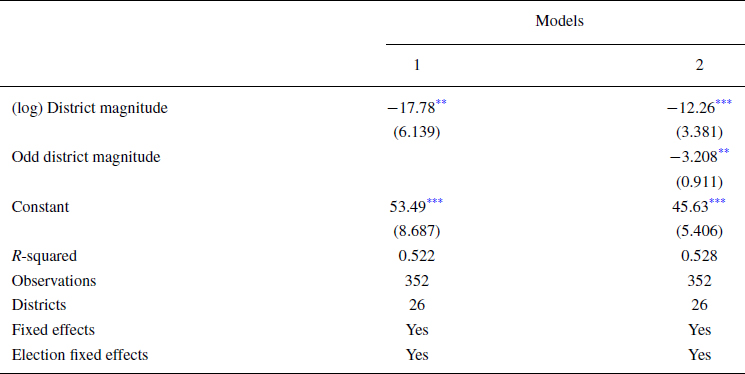
A more sophisticated analysis of the odd–even effect is presented in Table 1, where our specification (1) is estimated. Model 1 tests the conventional wisdom (i.e. the monotonically increasing relationship between the district magnitude and the effective number of parties). The (log of) district magnitude has the expected positive effect on ENP. It is statistically significant at the 0.05 per cent level, meaning that the more permissive a district the greater the number of parties. The coefficient on the lagged ENP is statistically significant at the 0.01 per cent level. It is also relatively small (0.21), reflecting the substantial differences in Spain's party system fragmentation caused by new, strong parties’ emergence after 2015 (Montero & Santana, Reference Montero, Santana, Muro and Lago2020).
Table 1. The odd–even effect

Note: Models are estimated using fixed effects, general least‐squares regression and robust standard errors, which are clustered by district. The term e − 1 refers to the previous election. The figures in parentheses are robust standard errors.
* p < 0.1, **p < 0.05, ***p < 0.01.
The odd–even effect is examined in Models 2–5. In Model 2, the coefficients on
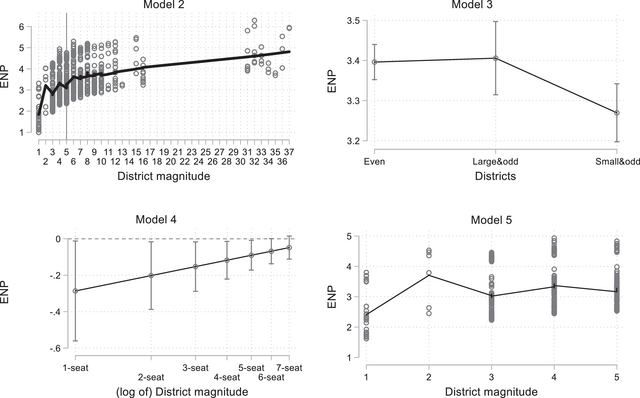
 $EN{P}_{( {e - 1} )}$ and the (log of) district magnitude remain mostly unchanged. They are again statistically significant at the 0.01 and 0.05 per cent levels, respectively. The variable capturing the odd–even effect – statistically significant at the 0.05 per cent level – indicates that having an odd number of seats to allocate reduces the number of parties. The non‐monotonic relationship between the effective number of parties and the district magnitude is displayed in the top‐left panel of Figure 4. We fitted a lowess curve (b width = 0.2) to the predicted ENP values. The sawtooth‐shaped relationship between the number of parties and the district magnitude is apparent between single‐member and five‐seat districts; allocating an even or an odd number of seats does not make any difference when the district magnitude is greater than 5. Interestingly, this aligns with the accumulated evidence regarding when strategic voting fades out.

Figure 4. Simulating the odd–even effect. ENP, effective number of parties.
In the third model, the coefficient on the dummy identifying small districts awarding an odd number of seats (i.e. with five or fewer seats) is negative and statistically significant at the 0.05 per cent level. In contrast, the dummy for the large districts awarding an even number of seats is not statistically significant. This means that the effective number of electoral parties in low‐magnitude districts with an odd magnitude is 0.126 smaller than in districts with an even number of seats. However, districts with an even number of seats and large districts awarding an even number of seats are expected to have the same party system fragmentation. The predicted ENP in the three types of districts is displayed in the top‐right panel of Figure 4. The coefficients on $EN{P}_{( {e - 1} )}$ and the (log of) district magnitude and their statistical significance barely change compared to the previous models.
In Model 4, we add the interaction term (log) District mag. × Odd district magnitude to the baseline in Model 1. As can be seen, the two principal effects are statistically significant and have the expected signs (i.e. the coefficient on the [log of] district magnitude is positive and statistically significant at 0.01 per cent level; the dummy odd‐district magnitude coefficient is negative and statistically significant at the 0.05 per cent level). The interaction term has the expected positive sign (i.e. there is a declining effect of allocating an odd number of seats as the district magnitude increases) and is only statistically significant at the 0.1 per cent level. However, as shown in the bottom‐left panel of Figure 4, the marginal effect of allocating an odd number of seats on ENP is negative and statistically significant when the district magnitude is between 1 and 5 seats. More specifically, the simulation compares the difference in ENP between even and odd district magnitudes, with the former serving as the reference category. Given that districts are either even or odd, this is only an artificial comparison; nevertheless, it does provide a good illustration of the odd–even effect. The effect declines as the district magnitude increases, meaning that in districts with a magnitude above five, the even‐ or oddness of the number of seats does not affect ENP.
Finally, when running the interactive specification for districts that allocate five or fewer seats, only one of the principal effects – the odd district magnitude – remains statistically significant (at the 0.01 per cent level). The interaction term again has the expected negative sign and is statistically significant at the 0.01 per cent level. More importantly, the coefficient on the interaction is more than four times greater than in Model 3. The simulation displayed in the bottom‐right panel of Figure 4 demonstrates that the even‐odd effect is a low‐magnitude phenomenon. The sawtooth patterns are again evident when fitting a lowess curve (b width = 0.2) to the predicted ENP values. Interestingly, the (log of) districts’ magnitude is not statistically significant, and this non‐effect supports the crucial impact of the odd–even effect in low‐magnitude districts.
To summarise, the evidence for the odd–even effect is overwhelming when looking at our analysis and the various measures and approaches used to conduct it. Thus, we can confidently assert that in low‐district magnitudes, whether the number of seats to be allocated is even or odd has a crucial influence on the number of parties. In the online Appendix, we have examined how different configurations of party systems affect the odd–even effect taking advantage of the substantial change in the party system in Spain in the 2015 election. The effective number of parties substantially increased in the 2015−2019 period compared to the 1977−2011 period. As seen in Table A1, the results are qualitatively the same regarding the statistical significance of the variables capturing our argument. However, the effect is more substantial in the 2015−2019 period.Footnote 8
Mobilisation efforts in lower house and European Parliament elections
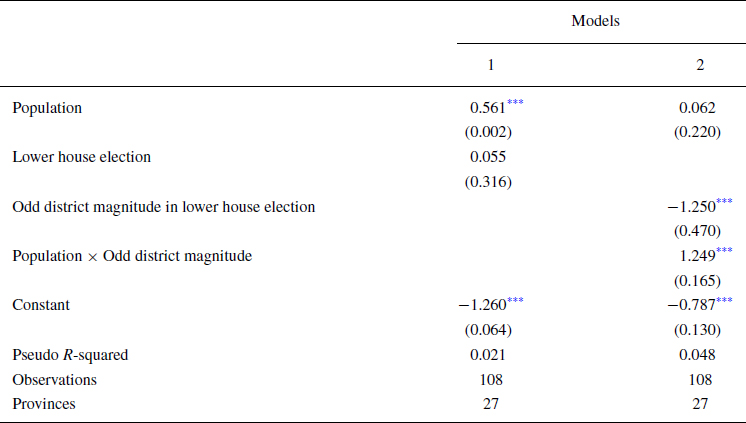
Table 2 displays our results when estimating our specifications (2) and (3) examining the elite‐level mechanism. Model 1 shows that mobilisation efforts in election campaigns are driven by province population: the more populated a province is, the more likely it is to be visited by the party leaders. This variable is statistically significant at the 0.01 per cent level. Additionally, given that the dummy variable identifying the lower house election is not statistically significant, the mobilisation efforts in both elections are similar.
Table 2. The odd–even effect and mobilisation efforts

Note: Models are estimated using probit models and robust standard errors clustered by parties. The figures in parentheses are robust standard errors.
* p < 0.05, ***p < 0.01.
Model 2 tests the elite‐level mechanism through the interaction between the population and whether the province allocated an even or an odd number of seats in the lower house election. The positive coefficient indicates that the impact of population on the probability of the district being visited by the party leader increases in lower house elections when the district magnitude is odd. The interaction is statistically significant at the 0.01 per cent level.
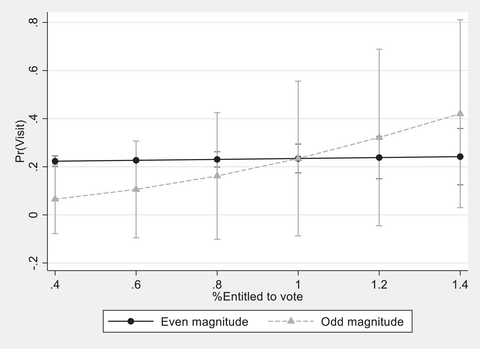
Since interpreting interaction coefficients is not a straightforward task (Brambor et al., Reference Brambor, Clark and Golder2006), in Figure 5, we show how the effect of the province population changes depending on whether the number of allocatable seats is even or odd. As expected, an odd number of seats in the lower house election makes a noticeable difference in the probability that the party leader will visit a province according to its population. However, party strategies do not change with the province population when the district magnitude is even.

Figure 5. Mobilisation efforts and district magnitude.
District‐level wasted votes
Table 3 displays our results from estimating our specifications (5) and (6) examining the voter‐level mechanism. Model 1 shows that the district magnitude drives the percentage of wasted votes: the greater the number of allocatable seats, the smaller the percentage of wasted votes. The variable is statistically significant at the 0.05 per cent level. Next, Model 2 tests whether voter coordination is affected by awarding an even or an odd number of seats in the district. The variable has the expected negative sign and is statistically significant at the 0.05 per cent level. When controlling for the district magnitude, the percentage of wasted votes drops in districts with an odd number of seats compared with districts with an even number of seats.
Table 3. The odd–even effect and wasted votes.

Note: Models are estimated using OLS regression and robust standard errors, which are clustered by district. The figures in parentheses are robust standard errors.
* p < 0.05, ***p < 0.01.
As a robustness check, we estimated specifications (5) and (6) through a pooled cross‐sectional time series analysis and added the lagged value of the percentage of wasted votes; the results are included in the online Appendix. In Table A3a, we include all low‐magnitude districts in the analysis; thus, we conclude that the panel is unbalanced. In Table A3b, we included only those districts whose magnitude is between two and five seats in all elections; therefore, we have a balanced panel. As seen in both tables, the results are qualitatively the same as in Table 3: when allocating an odd number of seats, the percentage of wasted votes drops; the variable is again statistically significant at the 0.05 per cent level.
Conclusions
This paper argues that elections are more competitive in low‐magnitude districts when the district magnitude is odd than even. Two mechanisms account for this link. On the one hand, the marginal benefit of parties’ efforts to mobilise voters increases the smaller the distance in votes’ shares needed to gain a marginal seat in the district. On the other hand, the incentive to vote strategically increases as the contest date for the last‐allocated seat in the district approaches. Consequently, electoral coordination is expected to be greater when the number of allocated seats is odd than when it is even.
To examine the odd–even effect, we utilised data from 780 districts across 15 lower house elections in Spain. In doing so, we found that if the number of seats in a district is odd, the number of parties receiving votes is reduced compared to those numbers in districts with even magnitudes. The odd–even effect is expected to exist in the most prevalent electoral system in the democratic world – districted PR systems – where national legislatures are elected using districts that vary in magnitude. Apart from this quantitative evidence, using qualitative evidence (e.g. interviews with campaign managers) would be instrumental in disentangling the behavioural mechanisms behind the odd–even effect.
Our finding has important implications for the conventional wisdom on this topic. While electoral systems scholarship assumes a monotonically increasing relationship between the district magnitude and the number of parties, we show that in districted PR systems, the relationship is non‐monotonic. The number of seats awarded in a district as even or odd is not a variable previously considered in the vast literature on electoral and party systems. When summarising the distribution of the district magnitude with a single number (e.g. the mean or the mode), we may overlook a crucial dimension that drives district‐level coordination.
The implications of these findings go beyond the academic realm. First, for institutional designers, when selecting or adopting an electoral system, it is crucial to consider whether the number of seats awarded in districts is even or odd. Similarly, for campaign managers, the odd–even effect is a vital piece of information that, if correctly understood, could help them invest their resources in election campaigns more efficiently. However, examining other countries’ uses of districted PR systems is essential to achieve generalisability.
Acknowledgements
Earlier versions of this article were presented at the PolMeth Europe Conference at King's College London (June 2023) and the European Political Science Annual Conference in Glasgow (June 2023). We thank Indridi Indridason for his very helpful comments. Ignacio Lago acknowledges support from ICREA under the ICREA Academia program and Ferran Martinez i Coma from the Australian Research Council Discovery Project (Grant Number: DP190101978).
Open access publishing facilitated by Griffith University, as part of the Wiley ‐ Griffith University agreement via the Council of Australian University Librarians.
Online Appendix
Additional supporting information may be found in the Online Appendix section at the end of the article:
Table A1. The odd‐even effect over time
Table A2. The odd‐even effect
Table A3a. The odd‐even effect and wasted votes (unbalanced panel)
Table A3b. The odd‐even effect and wasted votes (balanced panel)
Figure A1: District structure
Table A4. The odd‐even effect in low‐magnitude districts in Portugal
Supporting Information


 Open access