


Introduction
Anorexia-loss of appetite and/or decreased food intake is reported to occur in 15% to 30% of community-dwelling older individuals.(Reference Malafarina, Uriz-Otano and Gil-Guerrero1) The condition is closely associated with an increased risk of weight loss,(Reference Wilson, Thomas and Rubenstein2) sarcopenia,(Reference Tsutsumimoto, Doi and Nakakubo3) and frailty.(Reference Tsutsumimoto, Doi and Makizako4) Given these serious consequences, it is important to maintain an adequate appetite in older age. As previously reported, dietary intake varies seasonally, as demonstrated in studies across a wide age range and diverse regions.(Reference Stelmach-Mardas, Kleiser and Uzhova5,Reference Fujihira, Takahashi and Wang6) Urban studies in developed countries targeting middle-aged and older adults report that energy intake tends to be higher in winter and spring and lower in summer. In Spain, energy intake is higher in spring and autumn and lower in summer,(Reference Aparicio-Ugarriza, Rumi and Luzardo-Socorro7) while in the Netherlands, intake peaks in November and is lowest in May.(Reference van der Toorn, Cepeda and Kiefte-de Jong8) Among Turkish adults aged 65 and older, a significant increase in intake during winter has been reported.(Reference Ersoy, Taşçi and Özgürtaş9) These findings suggest the possibility of seasonal variation in appetite itself.
Seasonal variations may result from a range of environmental, physiological, and social factors, including outdoor temperature, daylight duration, emotional states, physical activity, and cultural events or holidays.(Reference Fujihira, Takahashi and Wang6) In particular, the impact of ambient temperature on appetite has been thoroughly investigated.(Reference Millet, Siracusa and Tardo-Dino10) A study conducted on physically active males reported that 31°C hot environment whilst in fasting state decreased levels of ghrelin, a hormone that stimulates appetite.(Reference Faure, Charlot and Henri11) A further study found that exercising in a 36°C hot environment increased levels of peptide YY, which suppresses appetite.(Reference Shorten, Wallman and Guelfi12) These findings suggest that seasonal temperature changes may affect appetite regulation and consequently influence overall nutrient status.
Although seasonal factors such as temperature have been shown to influence appetite, research specifically addressing seasonal variation in appetite among older adults remains limited.(Reference Aparicio-Ugarriza, Rumi and Luzardo-Socorro7) Moreover, very few studies have examined how these seasonal fluctuations affect those at greater risk of anorexia due to social and environmental factors. Social factors such as isolation and living alone have been identified as significant contributors to age-related anorexia.(Reference Sánchez-Sánchez and Rolland13) Older individuals who live alone are at higher risk of malnutrition than those living with others.(Reference Ramic, Pranjic and Batic-Mujanovic14) Nonetheless, to the best of our knowledge, no studies have examined seasonal changes in appetite among older individuals aged 65 and older who live alone. Understanding such patterns could be critical for identifying periods when this population is at heightened risk of poor nutritional status due to age-related appetite decline.
Therefore, the present study aimed to (1) examine seasonal variation in appetite across four seasons in a longitudinal study among Japanese individuals aged 65 years and older, and (2) perform stratified analysis focusing on living arrangement, hypothesising that those living alone are more susceptible to seasonal changes.
Experimental methods
Study design and protocol
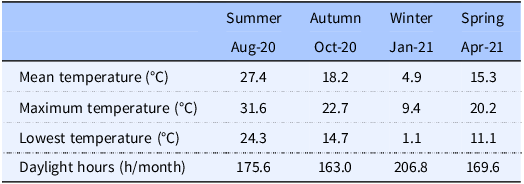
This longitudinal study analysed data from Japanese men and women aged ≥65 years, and was approved by the Ethics Committee of the Tokyo Institute of Technology (Approval number: 2021039). Only those who were informed about the purpose of the study and methods of data collection and provided consent were included in the study. The study was registered in the UMIN Clinical Trials Registry (UMIN: 000051818) and conducted in accordance with the Code of Ethics of the World Medical Association (Declaration of Helsinki). Data were collected through mailed questionnaires from August 2021 to April 2022 in Tokyo, Japan. The analysis includes part of the data from a previous study that focused on summer meal temperatures.(Reference Fujihira, Takahashi and Wang6) In accordance with the Japan Meteorological Agency’s seasonal definitions, questionnaires were distributed in summer (August 2021), autumn (October 2021), winter (January 2022), and spring (April 2022). Participants were asked to submit the survey questionnaire within 10 days of receiving it. Table 1 shows the mean, maximum and lowest temperatures, and daylight hours for each survey period in Tokyo.(15)
Table 1. Meteorological conditions for each survey period

Meteorological data for each survey period in Tokyo were provided by the Japan Meteorological Agency. (Japan Meteorological Agency n.d.).
Participants
The study sample consisted of 60 individuals, with an equal ratio of men and women, all aged 65 years or older and residing in Tokyo. As no prior studies have specifically examined seasonal variations in the SNAQ score, the primary outcome of the present study, the sample size calculation was based on previous research in older adults that evaluated energy intake,(Reference Aparicio-Ugarriza, Rumi and Luzardo-Socorro7) a variable closely associated with appetite scores, as the primary outcome. The required sample size was estimated using G*Power 3.1, assuming an effect size of f = 0.45, an alpha error probability of 0.05, and a statistical power of 0.80. Considering an anticipated dropout, a total of 60 participants were selected as the target population. Participants were recruited through a job-placement agency for older adults and were willing and physically able to work. Individuals with diseases necessitating dietary restrictions or on medications that affected appetite were excluded to eliminate any potential effects on appetite. Questionnaires were mailed to participants, who were instructed to complete them at home. Three participants withdrew during the course of the study, and data from 57 individuals who completed assessments across all seasons were included in the analysis.
Assessment of distributions of study participant characteristics
Demographic variables collected included age, sex, marital status, and living arrangement. Living arrangement was categorised based on whether participants living alone or with others. Participants self-reported their height and weight, which were used to calculate body mass index (BMI); these self-reported values are generally consistent with measured data.(Reference Hodge, Shah and McCullough16) The participants’ mental health status was evaluated using the WHO-5 Well-Being Index.(Reference Awata, Bech and Koizumi17) Participants rated the frequency of experiencing positive emotions over the previous two weeks on a six-point scale, ranging from ‘all of the time’ (5 points) to ‘at no time’ (0 points). Regarding daily living conditions, participants were asked about the duration of their sleep on weekdays and holidays and levels of physical activity. The International Physical Activity Questionnaire Short Form (IPAQ-SF) was used to assess the levels of seasonal physical activity.(Reference Murase, Katsumura and Ueda18)
Assessment of appetite
The Simple Nutritional Appetite Questionnaire (SNAQ) was used to evaluate chronic appetite during each season.(Reference Wilson, Thomas and Rubenstein2,Reference Nakatsu, Sawa and Misu19) The SNAQ includes four items: appetite, satiety, and taste ratings, and number of meals, and is used as a screening tool to assess reduced appetite, as it can predict risk of weight loss and malnutrition in community-dwelling older adults.(Reference Wilson, Thomas and Rubenstein2,Reference Rolland, Perrin and Gardette20) Participants were asked to provide responses to SNAQ regarding their appetite over the previous three months. The study also assessed subjective appetite during fasting in each season using the visual analogue scale (VAS).(Reference Flint, Raben and Blundell21) Participants were asked to evaluate their level of hunger, satiety, and expectation of food intake during fasting after waking on a given day in each season.
Assessment of nutritional status
The Mini Nutritional Assessment (MNA)(Reference Kuzuya, Kanda and Koike22,Reference Kaiser, Bauer and Ramsch23) was used to evaluate the chronic nutritional status of the participants in each season. The MNA is a screening tool to evaluate nutritional status in older people, and comprises six screening and 12 assessment items, including measurements of arm and calf circumference. Participants were instructed to self-assess their nutritional status over the previous month. To measure calf and arm circumference required for the MNA assessment, participants were mailed a measuring tape. The calf circumference was measured in a seated position. Participants located the thickest part of their right calf and measured the circumference using a measuring tape. Arm circumference was measured on the non-dominant arm. Participants first measured the distance from the shoulder to the elbow and identified the midpoint. Subsequently, they measured the circumference of the upper arm at this midpoint. At baseline (i.e., in summer), participants received a detailed explanation of the measurement procedures by telephone from the research staff to ensure that there were no difficulties in performing the measurements. In addition, participants were provided with written instructions describing the measurement procedures, which they consulted while conducting the measurements at home. Daily fluid intake (less than 3 cups, 3 to 5 cups, 5 cups or more) was assessed for each season.
Statistical analysis
Data were analysed using IBM SPSS Statistics 23.0 (SPSS Japan, Inc.) Differences in height, body mass, BMI, calf circumference, and arm circumference for each season were assessed using repeated-measures one-factor analysis of variance (repeated-ANOVA). Non-normally distributed scores of physical activity and mental health were presented as medians (25–75% percentiles) and analysed using the Friedman test. Age-related anorexia is more likely to occur in older adults and its prevalence is known to be sex-dependent.(Reference Malafarina, Uriz-Otano and Gil-Guerrero1) As this study had a 9-month follow-up period (August–April), age was expected to influence the variability in appetite. Therefore, temporal variations in appetite and nutritional status were analysed using repeated-measures analysis of covariance (repeated-ANCOVA), with age and sex as covariates. When significant group effects were detected, post-hoc analysis for multiple comparisons was conducted using the Bonferroni method. Additionally, the analysis of seasonal variability in appetite and nutritional status was stratified based on living arrangement. The 95% confidence intervals for pairwise differences between absolute mean values across the four seasons were calculated using the t-distribution and degrees of freedom (n - 1). Effect sizes (ES) (partial η2) were calculated to describe the magnitude of differences between seasons. Data are presented as the mean ± standard deviation. Statistical significance was set at p < 0.05.
Results
Of the 60 participants who responded to the first survey, three dropped out during the subsequent round (autumn survey). This analysis includes data from 57 participants (data collection rate: 95%) who completed all four rounds.
Distributions of participant characteristics stratified by living arrangement
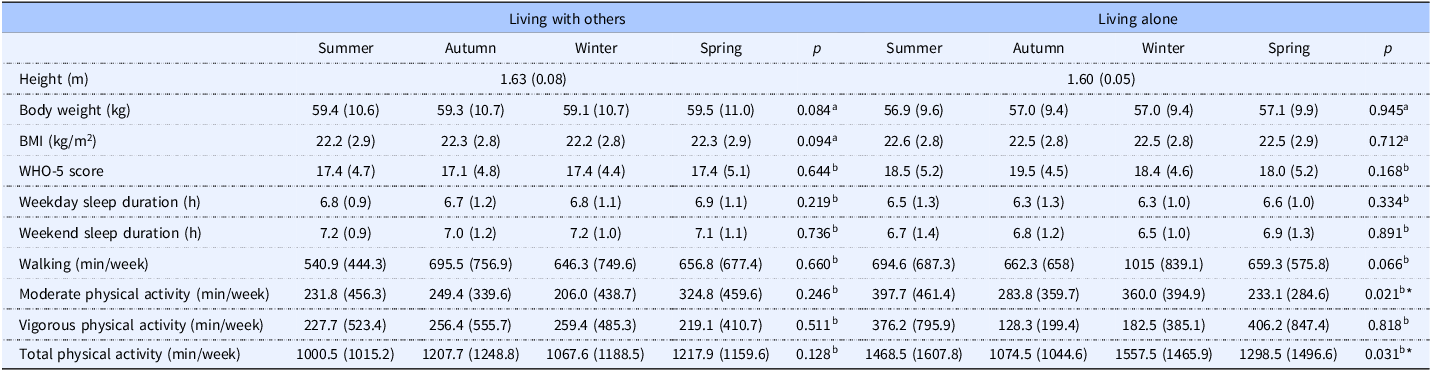
Table 2 presents the characteristics stratified by living arrangement. A two-way ANOVA revealed a significant interaction between living arrangement and season for total physical activity. Simple main effects analysis indicated that among participants living alone, total physical activity time was significantly lower in autumn than in winter (p = 0.027).
Table 2. Distributions of study participant characteristics stratified by living arrangement

Values are presented as mean (standard deviation). N = 57 participants who completed all four seasonal surveys.
BMI, Body mass index; WHO-5 score, World Health Organisation-Five Well-Being Index.
a p-values derived analysis of variance.
b p-values derived from Friedman test. *p < 0.05.
Seasonal variation in appetite stratified by living arrangement
Table 3 presents Model 1, which analysed seasonal variations in appetite by living arrangement using analysis of variance, and Model 2, which analysed the seasonal variations using analysis of covariance with sex and age included. Significant seasonal variability in appetite was observed only for those who were living alone (15.7 ± 0.3, 16.1 ± 0.4, 16.3 ± 0.4, and 15.8 ± 0.3 for summer, autumn, winter, and spring, respectively; main effect of seasons, p = 0.029, ES = 0.280). Post-hoc analysis showed that SNAQ scores were lower in summer than in winter (p = 0.026, 95% CI: 0.076–1.258). No significant seasonal variation in appetite was observed in those living with others (15.6 ± 0.2, 15.6 ± 0.2, 15.6 ± 0.2, and 15.5 ± 0.2 for summer, autumn, winter, and spring, respectively; main effect of seasons, p = 0.337, ES = 0.028). Seasonal variation in experiencing fullness at fasting, as assessed by VAS, was recorded in participants who were living with others (56.2 ± 4.3, 60.1 ± 3.8, 54.6 ± 4.6, and 51.7 ± 4.3 for summer, autumn, winter, and spring, respectively; main effect of seasons, p = 0.005, ES = 0.145). However, the effect was not significant in the post-hoc test (p > 0.05).
Table 3. Stratified analysis of appetite and nutritional status by living arrangement
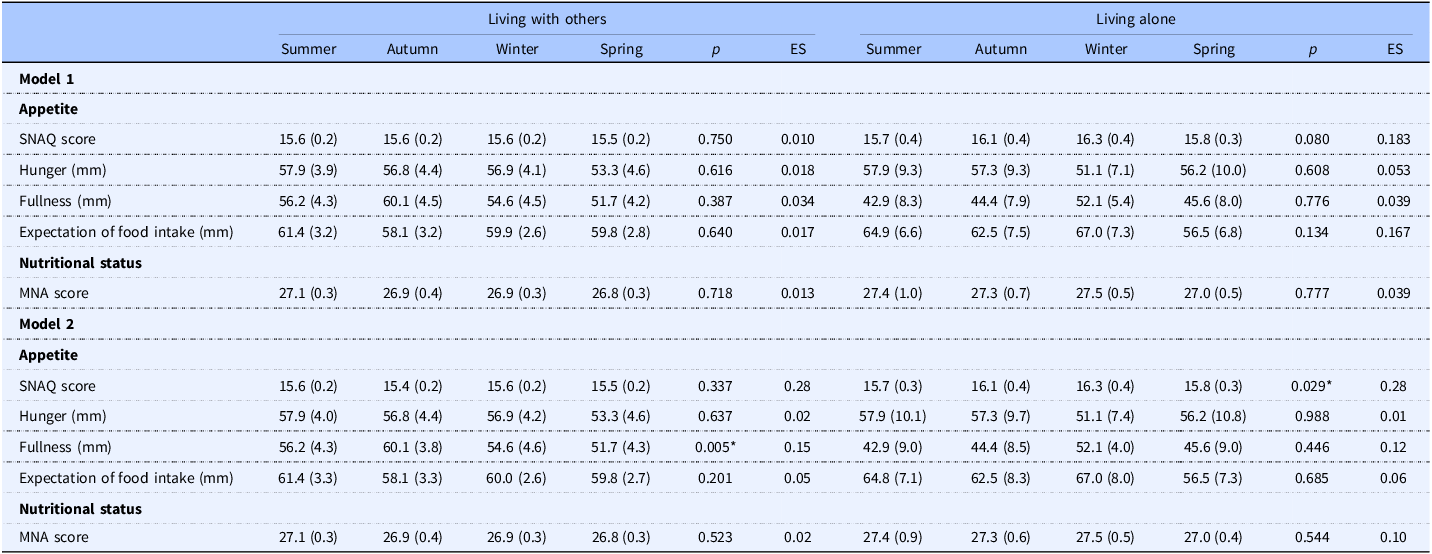
Values are presented as mean (standard error). N = 57 participants who completed all four seasonal surveys.
SNAQ, Simple Nutritional Appetite Questionnaire; MNA, Mini Nutritional Assessment.
Model 1 is an analysis of variance with season as the factor and appetite and nutritional status as the dependent variables. Model 2 is an analysis of covariance with season as the factor, appetite and nutritional status as the dependent variables, and sex and age as covariates. *p < 0.05.
Seasonal variation in nutritional status
Table 3 presents Model 1, which analysed seasonal variations in MNA score by living arrangement using analysis of variance, and Model 2, which analysed the seasonal variations using analysis of covariance with sex and age included. There were no seasonal variations in MNA scores among older adults living alone or with others (p > 0.05). A Friedman test showed no statistically significant difference in daily fluid intake across seasons (p = 0.050). Descriptively, the scores tended to be higher in summer compared with the other seasons.
Discussion
To the best of our knowledge, this is the first study to examine seasonal variations in appetite status among Japanese older adults aged 65 years and older, with a specific emphasis on the moderating effects of living arrangements. A key finding is that appetite significantly declined during the summer among individuals living alone, while no such seasonal variation was observed among those living with others. These results highlight the importance of incorporating both seasonal and social factors into nutritional care strategies for older adults.
The observed decline in appetite during the summer aligns with prior research demonstrating reduced energy intake during summer.(Reference Aparicio-Ugarriza, Rumi and Luzardo-Socorro7,Reference Ersoy, Taşçi and Özgürtaş9,Reference Tanaka, Okuda and Shinohara24) In Japan, where extreme heat days are increasing due to climate change,(25) elevated ambient temperatures may play a critical role in appetite suppression.(Reference Millet, Siracusa and Tardo-Dino10) From a physiological perspective, high temperatures can influence appetite-regulating hormones. Ghrelin, a hormone that stimulates hunger, tends to decrease.(Reference Faure, Charlot and Henri11) In contrast, peptide YY, which suppress appetite, tend to increase.(Reference Shorten, Wallman and Guelfi12) Moreover, heat may modulate the activity of the hypothalamic arcuate nucleus (ARC), particularly the AgRP/NPY and Pro-opiomelanocortin (POMC) neurons, which are central to appetite regulation.(Reference Timper and Brüning26) Animal studies have shown that the appetite-promoting effect of neuropeptide Y is significantly reduced in a hot environment of 30°C.(Reference Bouali, Fournier and St-Pierre27) Despite previous findings, the mechanisms underlying the relationship between chronic temperature changes (i.e., seasonal variations) and appetite homeostasis remain unclear. A study investigating seasonal variations in leptin levels among older adults reported higher concentrations in summer.(Reference Sato, Kanikowska and Sugenoya28) These findings may partially explain the appetite suppression observed during the summer.
Notably, appetite variations were limited to those living alone — a group identified as at high risk of malnutrition. These findings add to existing evidence that living alone and social isolation have a negative impact on dietary behaviour.(Reference Kucukerdonmez, Navruz Varli and Koksal29) Previous studies have found that a significant proportion of older adults who eat alone also live alone,(Reference Tani, Kondo and Takagi30) and that this pattern is associated with a 1.75-fold increased risk of appetite loss.(Reference Mikami, Motokawa and Shirobe31) The findings of this study indicate a necessity for targeted, seasonally tailored interventions to prevent appetite decline among older adults living alone, with a particular focus on the summer.
No significant seasonal variations were observed in MNA scores or VAS appetite scores. This discrepancy may be explained by differences in the timeframe each tool captures: the MNA primarily reflects the current nutritional status, the VAS measures immediate appetite at the time of assessment, whereas the SNAQ reflects the risk of future deterioration in nutritional status due to declines in appetite-related factors. Although no seasonal variation in MNA scores was observed in the present study, previous research has reported seasonal imbalances in dietary intake, such as increased vegetable consumption during summer,(Reference Adachi, Oono and Matsumoto32) and greater intake of fruits during winter(Reference Stelmach-Mardas, Kleiser and Uzhova5). These seasonal shifts in dietary preferences may interact with appetite regulation. Moreover, our findings demonstrated a tendency toward increased fluid intake in summer, particularly among older adults living alone. Seasonal variations in fluid consumption — which may indirectly affect appetite through mechanisms such as gastric distension and enhanced satiety(Reference Harris33) — could partly account for the seasonal variations observed in SNAQ scores. There were no significant seasonal differences in sleep duration, physical activity and mental health. Although total physical activity was slightly higher in winter than in autumn among those living alone, it was not associated with appetite. This suggests that environmental and physiological factors, rather than lifestyle or psychological variables, may be the main drivers of seasonal changes in appetite in this population.
One strength of this study is the stratified analysis based on living arrangement. This helped to identify the population at risk of appetite instability. This approach allowed the identification of the subpopulation most sensitive to seasonal appetite changes. A key limitation of this study is that participants were recruited exclusively through a job-placement agency that serves older adults who are healthy and motivated. Consequently, the magnitude and timing of the seasonal appetite variations we observed may not accurately reflect those experienced by general community-dwelling older adults. Furthermore, the sample sizes for each group in the stratified analyses were small and exploratory. Future research should therefore include more diverse, large-scale populations to better determine how seasonal, environmental, and social factors interact to influence appetite status in older adults. Furthermore, participants’ past occupations and educational level were not assessed in this study. These characteristics may have influenced dietary habits and the accuracy of self-reports, and such potential effects cannot be excluded.
Conclusion
This study reveals for the first time that older individuals living alone experience a decline in their SNAQ scores during the summer compared to the winter. The findings suggest potential implications for designing seasonally tailored interventions to reduce the risk of anorexia.
Acknowledgements
The authors would like to thank Mrs. Ayako Kaneko for her assistance with data collection.
Authorship
Kyoko Fujihira: Conceptualisation, data curation, formal analysis, funding acquisition, investigation, methodology, project administration, validation, writing — original draft, and writing — review & editing. Masaki Takahashi: Conceptualisation, investigation, methodology, project administration, supervision, validation and writing — review & editing. Ai Iizuka: Conceptualisation, methodology, supervision, validation and writing — review & editing. Hiroyuki Suzuki: Conceptualisation, methodology, supervision, validation and writing — review & editing. Naoyuki Hayashi: Conceptualisation, methodology, supervision, validation and writing — review & editing.
Financial support
This study was supported by the Grant-in-Aid for JSPS Research Fellow under Grant 21J01065.
Competing interests
The authors declare none.


 Open access