


Introduction
Organic agriculture employs holistic practices such as crop rotation and crop diversification, as well as the use of naturally derived products for both nutrient and pest management with a focus on improving soil health (Reganold and Wachter, Reference Reganold and Wachter2016). However, there are some that argue that organic agriculture should do more beyond the standard United States Department of Agriculture (USDA) definition (Heckman, Reference Heckman2006). For example, the ‘Beyond Organic’ movement calls for more emphasis to be placed on the ethics of organic such as biological diversity and environmental stewardship (Tscharntke et al., Reference Tscharntke, Grass, Wanger, Westphal and Batáry2021), and social justice (Heckman, Reference Heckman2006; Howard and Allen, Reference Howard and Allen2006). Regardless of which organic definition consumers resonate with, it is clear by the growth within the United States organic sector that the demand for organic agricultural products has steadily increased since 1997 (Reganold and Wachter, Reference Reganold and Wachter2016; Willer et al., Reference Willer, Lernoud, Huber and Sahota2019). In 2017, organic food products accounted for 5.5% of all US food sales with an approximate value of $49 billion USD (Willer et al., Reference Willer, Lernoud, Huber and Sahota2019).
While the demand for organic agricultural products is growing, there are challenges for organic producers. In the United States, organic vegetable production is challenged by pests, diseases, and weeds (Snyder, Schonbeck and Vélez, Reference Snyder, Schonbeck and Vélez2022). A recent survey of the Southeast, Midwest, and Northeast US revealed that organic producers’ top five production challenges included insect pressure, heavy rain events, crop disease, weed pressure, and abundance and health of natural pollinators (Cheng, Zhang and Gleason, Reference Cheng, Zhang and Gleason2023). These challenges highlight the importance of holistic management tools, such as integrated pest management (IPM), to address the multiple concerns that organic producers face. Further, integrated pest and pollinator management (IPPM) may be considered to conserve biodiversity and pollinator health while balancing pest management (Lundin et al., Reference Lundin, Rundlöf, Jonsson, Bommarco and Williams2021). However, the significance and management of each of these challenges varies by each crop and region.
In the United States, cucurbit crops (squash, melons, cucumbers) are challenged by a pest–pathogen complex that limits production, especially in organic production (Schroder, Martin and Athanas, Reference Schroder, Martin and Athanas2001; Pair et al., Reference Pair, Bruton, Mitchell, Fletcher, Wayadande and Melcher2004). Major pests include cucumber beetles (Acalymma vittatum Fabricius, Diabrotica undecimpunctata howardi Barber), squash bug (Anasa tristis De Geer), and squash vine borer moth (Melittia cucurbitae Harris). These pests vector the pathogens of bacterial wilt (Erwinia tracheiphila) and cucurbit yellow vine disease (Serratia ureilytica; hereafter ‘CYVD’) which further threaten cucurbit crop production. The bacterial wilt pathogen is transmitted by striped and spotted cucumber beetles (Mueller et al., Reference Mueller, Gleason, Sisson and Massman2006; Seebold et al., Reference Seebold, Coolong, Bessin and Kaiser2009), whereas the CYVD pathogen can be transmitted by both cucumber beetles and squash bugs (Pair et al., Reference Pair, Bruton, Mitchell, Fletcher, Wayadande and Melcher2004; Seebold and Bessin, Reference Seebold and Bessin2011; Doughty et al., Reference Doughty, Wilson, Schultz and Kuhar2016; Mphande et al., Reference Mphande, Lasarre, Paulsen, Hartung, Badilla-Arias, Gleason and Beattie2025). Cucurbit yield losses due to this pest–pathogen complex can be up to 100% (Pair et al., Reference Pair, Bruton, Mitchell, Fletcher, Wayadande and Melcher2004) and can cost millions of US dollars in management costs (Schroder, Martin and Athanas, Reference Schroder, Martin and Athanas2001).
Not only must organic cucurbit producers manage the pest–pathogen complex, but they must also manage pollination. Cucurbits are among the most pollinator-dependent crops (Klein et al., Reference Klein, Vaissière, Cane, Steffan-Dewenter, Cunningham, Kremen and Tscharntke2007) and a lack of bee visitation to cucurbit flowers results in low-quality, small, misshapen, or aborted fruits (Valantin-Morison et al., Reference Valantin-Morison, Vaissiere, Gary and Robin2006; Bomfim et al., Reference Bomfim, Freitas, De Aragão and Walters2016). Wild pollinators have been shown to provide adequate pollination services to cucurbits (McGrady, Troyer and Fleischer, Reference McGrady, Troyer and Fleischer2020; McGrady et al., Reference McGrady, Strange, López‐Uribe and Fleischer2021) and efforts to support pollinator abundance on farms through floral strips, flowering cover crops, and natural habitat conservation have been effective at increasing wild pollinator populations (Blaauw and Isaacs, Reference Blaauw and Isaacs2014; Lundin et al., Reference Lundin, Rundlöf, Jonsson, Bommarco and Williams2021). However, there are tradeoffs to managing both insect pests and pollinators.
The management of the pest–pathogen complex is best achieved via control of the insect pests (Rojas et al., Reference Rojas, Batzer, Beattie, Fleischer, Shapiro, Williams, Bessin, Bruton, Boucher and Jesse2015). However, organic insecticide options for cucumber beetles and squash bugs are few and ineffective (Doughty et al., Reference Doughty, Wilson, Schultz and Kuhar2016; Dively et al., Reference Dively, Patton, Barranco and Kulhanek2020). In a trial of the Organic Material Review Institute (OMRI)-approved insecticide products (spinosad: Entrust, azadirachtin: Azera, pyrethrins: PyGanic, neem oil: Neemix) for cucumber beetle management, no insecticide achieved greater than 50% control, except Entrust (56.2%), and none prevented the spread of bacterial wilt (Dively et al., Reference Dively, Patton, Barranco and Kulhanek2020). In addition, when managing insect pests with pesticides, nontarget consequences have been found to affect wild pollinator health (Desneux, Decourtye and Delpuech, Reference Desneux, Decourtye and Delpuech2007). Even OMRI-approved pesticides, such as Spinosad, have both sublethal and lethal effects on bumble bee colony health (Morandin et al., Reference Morandin, Winston, Franklin and Abbott2005). This lack of effective insecticide options for organic growers, along with the risk of nontarget effects and the limited availability of resistant cultivars, has led researchers and growers to explore the use of physical pest exclusion with fine-mesh row covers as one of the many IPM strategies for cucurbits.
Row covers act as protective coverings for crop plants and consist of semipermeable fabrics placed over plants with the use of a supportive structure, such as a hoop, to create a tunnel. Depending on the height of the supportive structure, some row covers may be referred to as ‘mesotunnels’, which is the size between high tunnels and low tunnels (Nelson et al., Reference Nelson, González-Acuña, Nair, Cheng, Mphande, Badilla-Arias, Zhang and Gleason2023). Row covers may be manufactured with different types of materials, such as spun-bonded polyethylene and nylon mesh, and are available in different weights or mesh sizes (Castellano et al., Reference Castellano, Mugnozza, Russo, Briassoulis, Mistriotis, Hemming and Waaijenberg2008; Demsar, Znidarcic and Svetec, Reference Demsar, Znidarcic and Svetec2011). While row covers were initially used to extend growing seasons, they can also act as physical barriers to pests (Orzolek, Reference Orzolek2017). Previous studies have successfully used row covers for insect exclusion in cucurbits (Rojas et al., Reference Rojas, Gleason, Batzer and Duffy2011; Skidmore et al., Reference Skidmore, Wilson, Williams and Bessin2019; Athey et al., Reference Athey, Peterson, Dreyer, Harwood and Williams2021; Nelson et al., Reference Nelson, González-Acuña, Nair, Cheng, Mphande, Badilla-Arias, Zhang and Gleason2023) and other crops (Moreno et al., Reference Moreno, Víllora, Hernández, Castilla and Monreal2002; Gogo et al., Reference Gogo, Saidi, Itulya, Martin and Ngouajio2014; Kuesel et al., Reference Kuesel, Scott Hicks, Archer, Sciligo, Bessin and Gonthier2019; Brockman et al., Reference Brockman, Kuesel, Archer, O’hearn, Wilson, Scott, Williams, Bessin and Gonthier2020; Acharya, Welbaum and Arancibia, Reference Acharya, Welbaum and Arancibia2020b). While row covers provide critical protection to the cucurbit seedlings from insect pests in the early growth stages (Fiske et al., Reference Fiske, Cheng, Kuesel, Zhang, Bessin, Williams and Gonthier2024), many studies remove the row covers entirely to allow wild pollinator access to crop flowers. Removal of the row covers leaves the crop vulnerable to pests during later growth stages, but is considered necessary for pollination.
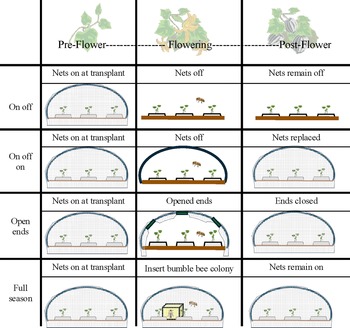
Previous literature describes different strategies for managing pollination beneath row covers. The commonly adopted on–off strategy is used where the row covers are only placed over crops in the early growth stage of the season (pre-flowering phenological stage) and then are completely removed at flowering for the rest of the season (Fig. 1; Mueller et al., Reference Mueller, Gleason, Sisson and Massman2006; Nair and Ngouajio, Reference Nair and Ngouajio2010; Rojas et al., Reference Rojas, Gleason, Batzer and Duffy2011; Lilley and Sanchez, Reference Lilley and Sanchez2016; Skidmore et al., Reference Skidmore, Wilson, Williams and Bessin2019). In the on–off–on strategy, row covers are placed over crops in the early growth stage of the season, then removed at the flowering stage, and replaced after pollination is complete (post-flowering phenological stage; Fig. 1; Athey et al., Reference Athey, Peterson, Dreyer, Harwood and Williams2021; Nelson et al., Reference Nelson, González-Acuña, Nair, Cheng, Mphande, Badilla-Arias, Zhang and Gleason2023; Mphande et al., Reference Mphande, Badilla-Arias, Cheng, González-Acuña, Nair, Zhang and Gleason2024). In other cucurbit row cover studies, an ‘open ends’ strategy has been used to facilitate pollination where row covers are placed over crops in the early growth stage of the season, and then during the flowering stage only the ends of the tunnels are rolled up to allow wild pollinator access. Once pollination is complete, the ends of the tunnel are closed for the rest of the season (Fig. 1; Tillman et al., Reference Tillman, Nair, Gleason and Batzer2015; Mphande et al., Reference Mphande, Badilla-Arias, Cheng, González-Acuña, Nair, Zhang and Gleason2024). For these three strategies, it is important to note that pollination depends on wild pollinators. Another strategy, the full season-stocked bumble bees strategy, introduces commercial bumble bee colonies at flowering so that row covers remain closed throughout the entire season (Fig. 1; Nelson et al., Reference Nelson, González-Acuña, Nair, Cheng, Mphande, Badilla-Arias, Zhang and Gleason2023; Mphande et al., Reference Mphande, Badilla-Arias, Cheng, González-Acuña, Nair, Zhang and Gleason2024; Pethybridge et al., Reference Pethybridge, Damann, Murphy, Diggins and Gleason2024b). Within the literature there is a broad range of modifications or variations on the abovementioned strategies. For instance, the open ends and full season strategies may not be true open ends and full season strategies as described earlier; they may be modified so that after pollination has been achieved, the row covers are completely removed for the duration of the growing season, preventing a true comparison between all four strategies (Rojas et al., Reference Rojas, Gleason, Batzer and Duffy2011; Tillman et al., Reference Tillman, Nair, Gleason and Batzer2015).

Figure 1. Mesotunnel installation for each of the pollination treatments throughout the growing season and what each crop phenology stage corresponds to in the treatment.
Source: Bee and plant images from Biorender.
While previous studies have investigated various pollination management strategies for row covers in cucurbits, these experiments have predominately been conducted on small-scale plots, typically spanning 6–9 m in length (Rojas et al., Reference Rojas, Gleason, Batzer and Duffy2011; Tillman et al., Reference Tillman, Nair, Gleason and Batzer2015; Skidmore et al., Reference Skidmore, Wilson, Williams and Bessin2019; Athey et al., Reference Athey, Peterson, Dreyer, Harwood and Williams2021; Nelson et al., Reference Nelson, González-Acuña, Nair, Cheng, Mphande, Badilla-Arias, Zhang and Gleason2023). However, many producers utilize row covers that span much larger fields, ranging from 30 to 91 m at a time (personal communication with local Kentucky producers). Despite the demonstrated efficacy of full season-stocked bumble bees in the small-scale experiments earlier, the transition to larger scale plots may pose challenges to pollination management. Although one study in Iowa found that one commercial bumble bee colony was sufficient for pollinating larger tunnels and resulted in the highest marketable yield, these results were not consistent with another study in central New York using the exact same treatments (Mphande et al., Reference Mphande, Badilla-Arias, Cheng, González-Acuña, Nair, Zhang and Gleason2024). Therefore, more research is needed to determine whether commercial bumble bee colonies are sufficient for pollinating larger tunnels. Additionally, Kendall et al. (Reference Kendall, Evans, Gee, Smith, Gagic, Lobaton, Hall, Jones, Kirkland and Saunders2021) found that protective covers (glass houses, screen cages, polytunnels, netting, plastic enclosures) may reduce or alter visual cues that bees use when navigating, but there is less information on how row covers specifically impact pollinator navigation. Further investigation is needed about the ability of pollinators to navigate through large-scale tunnels (6 m × 37 m), or whether the small openings (6 m) used in the open ends strategy (Fig. 1) will limit wild pollinator movement throughout the entire tunnel.
The objectives of this study were to compare the pest control and pollination efficacy of four different row cover (hereafter, ‘mesotunnel’) pollination management strategies for organic acorn squash. While much row cover work has focused on muskmelon (Rojas et al., Reference Rojas, Gleason, Batzer and Duffy2011; Nelson et al., Reference Nelson, González-Acuña, Nair, Cheng, Mphande, Badilla-Arias, Zhang and Gleason2023), we chose acorn squash due to the broader set of pests and vectored diseases, including squash bugs and their vectored disease, CYVD, as well as squash vine borers. Additionally, acorn squash was chosen due to the availability of bushing growth forms (rather than vining), which more optimally use the space within mesotunnel systems. Vining cucurbits can climb up the netting, which sometimes presents a management challenge. To make the experiment relevant to commercial production scales, we applied these management treatments on 36.6 m long × 6.4 m wide experimental units in 2020 and 2021. We hypothesized that the use of full season mesotunnels with stocked bumble bees will most effectively suppress pests because the row covers remain closed throughout the entire growing season. The full season mesotunnel was also expected to result in the highest level of pollinator activity due to the introduction of a bumble bee colony, which we expected to result in the highest marketable crop yield (as was found in past work by Nelson et al., Reference Nelson, González-Acuña, Nair, Cheng, Mphande, Badilla-Arias, Zhang and Gleason2023). Second, we hypothesized that the open ends treatment will allow pollinators access to crop flowers and provide comparable pest exclusion to the full season treatment, since the row cover remains over the crop with only a small opening for a limited time period, and will have the next highest marketable yield due to pollinator access and crop protection.
Materials and methods
Site description and experimental design
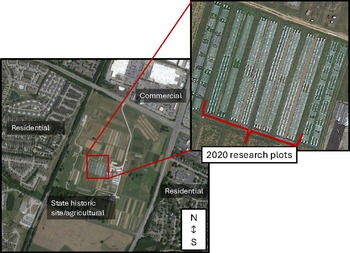
Field studies were conducted at the University of Kentucky’s Horticulture Research farm in Lexington, KY (37°58′25.92″ N, 84°32′5.85″ W) during the summers of 2020 and 2021. This 40.5-hectare fruit and vegetable farm is within USDA plant hardiness zone 7a (USDA, 2023) and is bordered on three sides by commercial and residential zones and agricultural fields on one side (Fig. 2). Soils at the research farm are characterized as Bluegrass-Maury silt loam (USDA-NRCS, 2025). In 2020, the previous plantings in the experimental plots included lettuce, spinach, and beets; in 2021, the previous planting in the experimental plots was a winter cover crop mix of rye, barley, and vetch. The research farm is divided into separate conventional and organic sections. In the USDA-certified organic section of the farm, a Community Supported Agriculture program produces over 50 varieties of vegetables, fruits, and herbs. The fields are holistically managed with crop rotation and cover crops. However, due to the many different crops and research experiments on this farm, there has been a variable history of cucurbit pests and vectored diseases over the years.
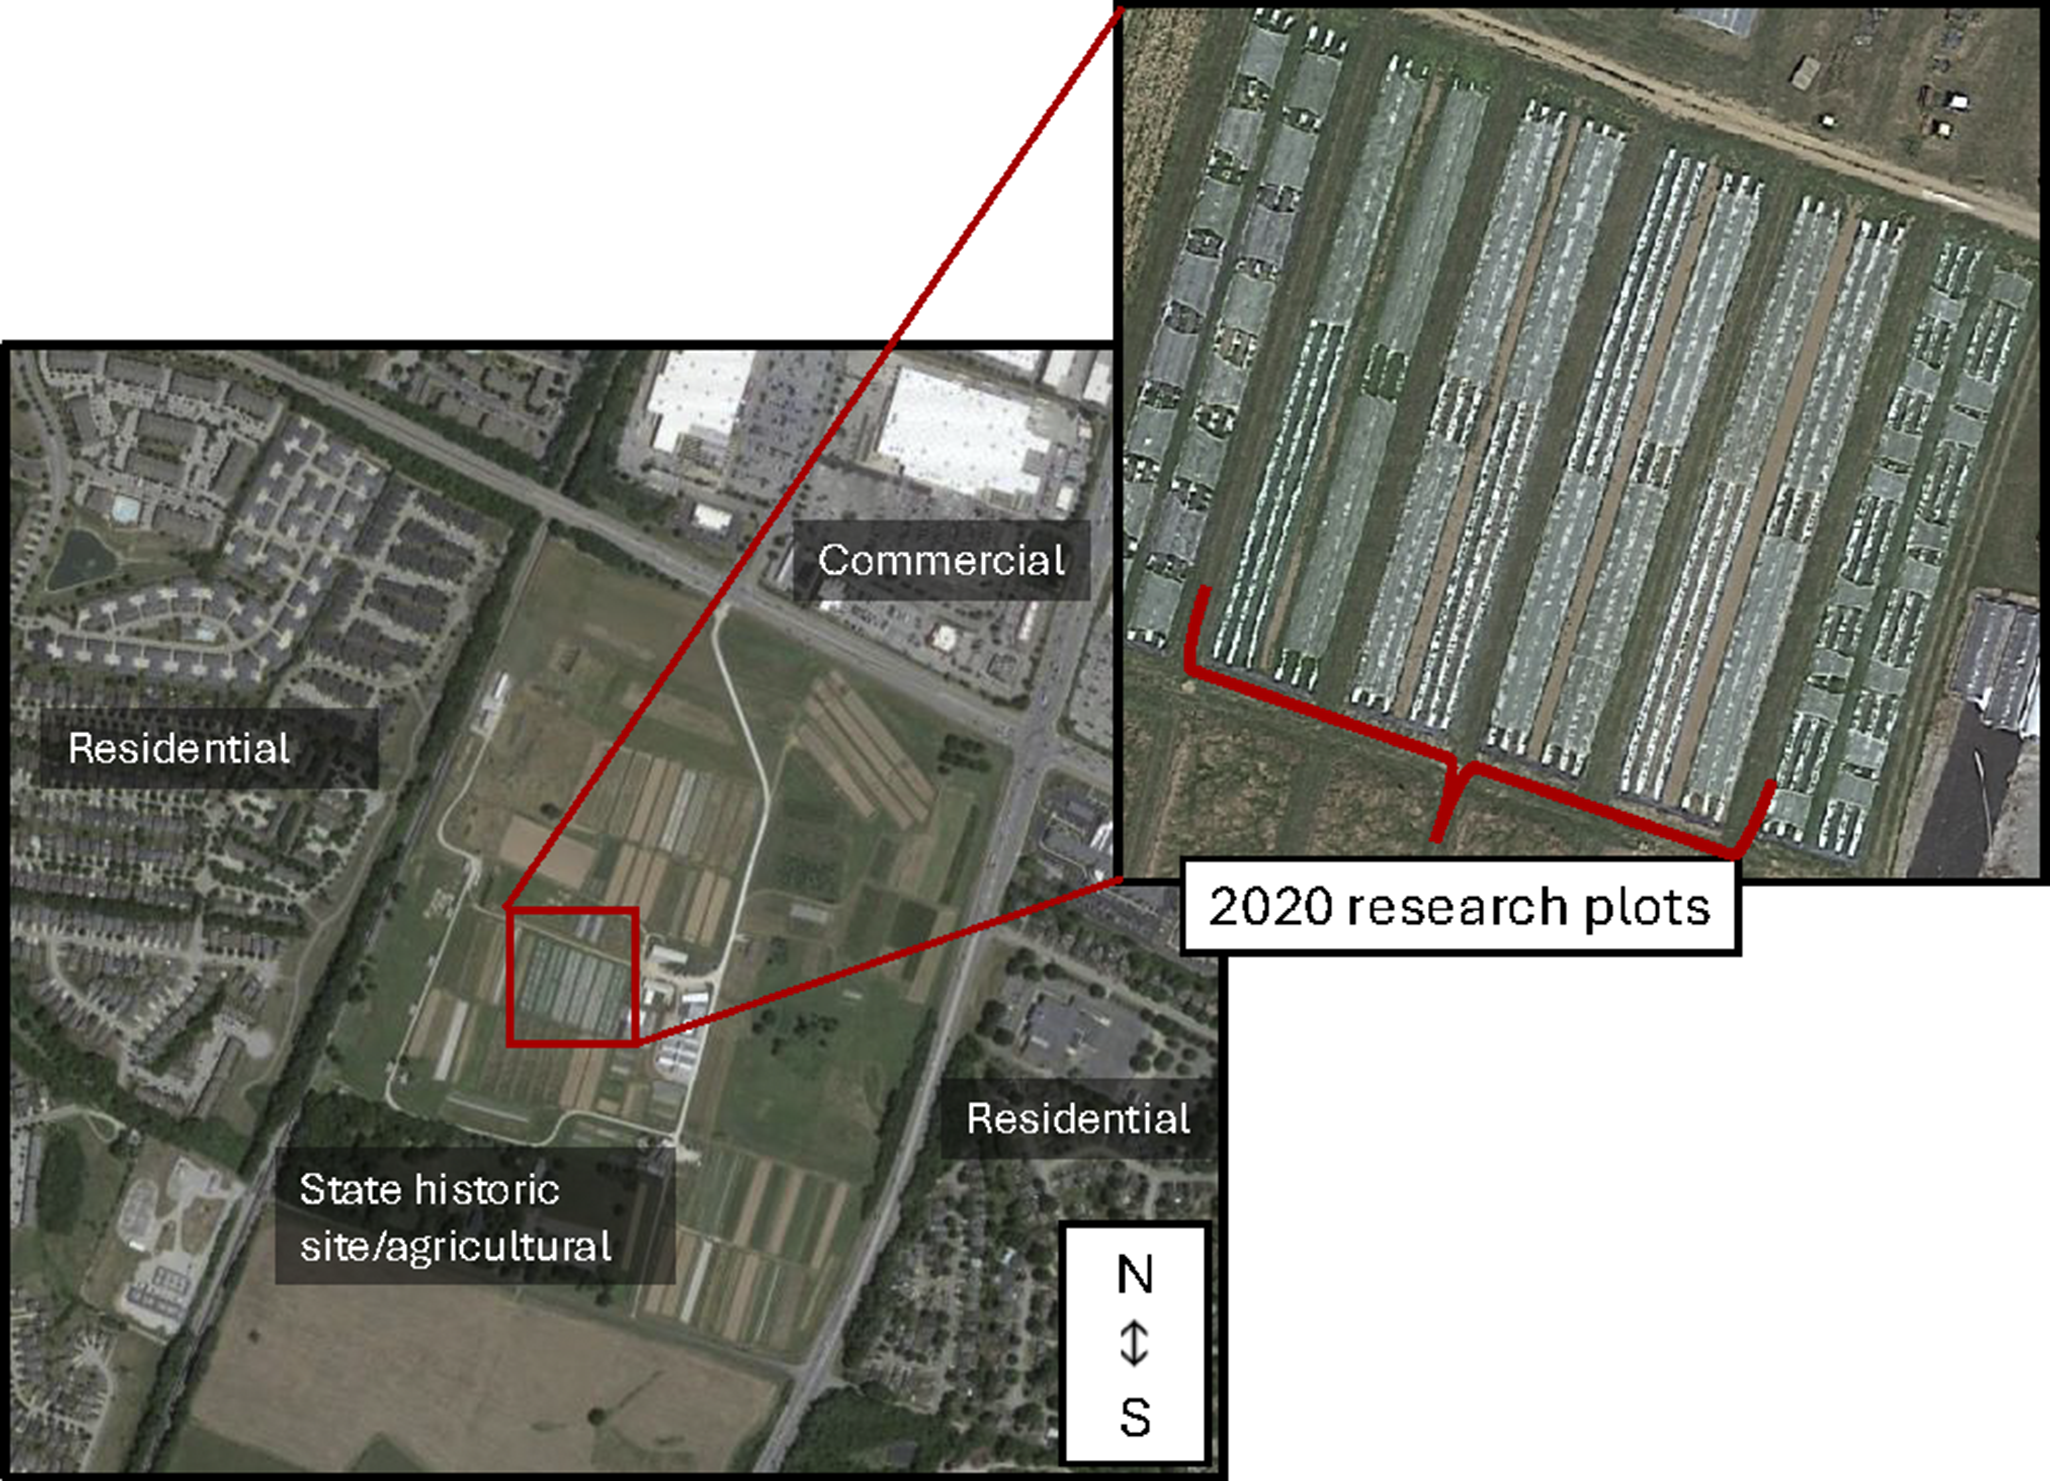
Figure 2. Site location of the University of Kentucky’s Horticulture Research Farm and an example of what the 2020 and 2021 research plots looked like within the farm. The 2021 research plots are similar, but on the southern side of the fields. Map images were generated from Google Earth on July 6, 2025 and edited with Microsoft PowerPoint.
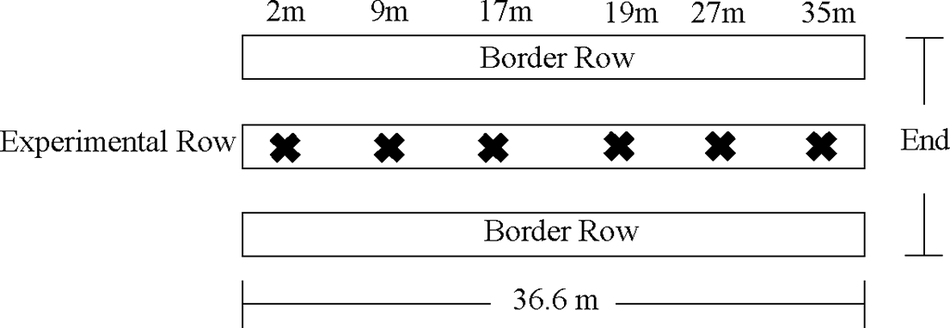
To compare the effects of different pollination strategies, we established treatments in a randomized complete block design. Each block consisted of a separate 15 m × 91 m field. Each block was subdivided into four experimental plots, approximately 6.4 m wide and 36.6 m long. Due to the scale of the experiment and the constraints of the field sizes, each plot was separated by approximately 2.4 m. The experimental plots consisted of three plastic mulch beds (0.9 m wide) spaced 0.9–1.2 m apart. Of the three plastic mulch beds, the outer two beds were considered ‘border rows’ to minimize edge effects on the center bed, and no data were collected (Fig. 3). Data were only collected from the center bed, as illustrated in Fig. 3. The total number of plants within each experimental plot was 180 plants (60 plants per bed). Within each block (N = 4) and each year, we randomly assigned the pollination treatments to each plot (on–off, on–off–on, open ends, and full season-stocked bumble bees).

Figure 3. Experimental set up for the analysis of distance from the ends effects for the mesotunnel pollination treatments. The X in the experimental row represents each focal plant where pest surveys, pollinator surveys, seed, and yield measurements were taken.
Fields were amended at a rate of approximately 4 tons/ha−1 with organic compost from the University of Kentucky Woodford County Farm and spaded in early spring (Table 1). After spading, fields were cultivated, and raised plastic beds were formed with the Rainflo Plastic Layer (Rain-Flo Irrigation, East Early, PA, USA) and the Kubota m9540 tractor (Kubota, Osaka, Japan). White plastic mulch (Berry Global, Evansville, IN, USA) and drip tape (20 cm Aqua-Traxx Drip irrigation; The Toro Company, Bloomington, MN, USA) were used to form the beds. During plastic laying, NatureSafe 10-2-8 coarse fertilizer (Darling Ingredients, Irving, TX, USA) was applied at a rate of 16–18 kg per ha−1 (Table 1).
Table 1. Field activities and date of each operation for each year of the mesotunnel pollination experiment

‘Table Ace’ acorn squash (Cucurbita pepo L.; Seedway, LLC. Hall, NY, USA) seeds were sown into 72-cell trays (3.8 cm × 3.8 cm × 5.7 cm) using Vermont Compost potting media (Vermont Compost Company, Monpelier, VT, USA; Table 1). Seedlings were grown in a USDA-certified organic greenhouse for four weeks. The house temperature conditions were set at 15.5°C heating and 21.1°C cooling. Greenhouse staff watered daily as needed. Four-week-old acorn squash seedlings were transplanted into the plastic mulch beds in single rows with 61 cm in-row spacing, and transplant holes were backfilled with wood chips to prevent weed emergence.
A living mulch of teff (Eragrostis tef; Corvalis-nitro coat; Welter Seed, Onslow, IA, USA) was sown for weed control in the furrows between the raised plastic beds at a rate of 4.4 kg per ha−1 in 2020 (Table 1). In 2021, we increased the rate to 6.5 kg per ha−1 based on the results of another experiment that found that the higher teff seeding rate was more effective at suppressing weeds (Table 1). Additionally, in 2021, the teff was mowed to a height of 5–8 cm with a BCS flail mower (BCS America, Oregon City, OR, USA) to mitigate the possible resource competition between the living mulch and the acorn squash plants as in Mphande et al. (Reference Mphande, Badilla-Arias, Cheng, González-Acuña, Nair, Zhang and Gleason2024) (Table 1).
After transplanting, we immediately installed mesotunnels over each treatment. The supportive structure was installed in each plot with 1 m tall, bent electrical conduit pipe hoops (1.2 m low tunnel hoop bender; Johnny’s Selected Seeds, Winslow, ME, USA) by evenly spacing 20 hoops on each of the two outside beds every 1.8 m and 12 hoops in the center bed every 3 m. Fine-mesh netting (60 gram netting, 1.2 mm × 1.9 mm; Tek-Knit Industries Montreal, Quebec, Canada), cut to the appropriate dimensions, was installed above the hoops. The mesotunnels were secured and weighed down with 7.6 cm irrigation hose (Martin’s Produce Supply, Liberty, KY, USA) filled with water along the long edges of the mesotunnel (36.6 m) and eight rock bags along the narrow edges (6.4 m). One piece of 91 m irrigation hose was used to secure one edge across two blocks for the entire length of the field, rather than cutting it in half to secure only one edge of one block.
To manage the four different pollination treatments (Fig. 1), we implemented the following strategies. The on–off treatment consisted of mesotunnels established at planting until flowering, when nets were removed for the remainder of the experimental season (Table 1). The on–off–on treatment consisted of mesotunnels established at planting until flowering, when nets were removed. Following the completion of pollination, nets were reestablished over the plots until harvest (Fig. 1). The open ends treatment consisted of mesotunnels established at planting until flowering, when the 6.4 m short ends of the plots were opened by lifting and securing the netting to hoops using plastic ties (Fig. 1). Following the completion of pollination (~three weeks), the net ends were reclosed to seal the mesotunnel until harvest. The full season treatment consisted of mesotunnels established at planting until flowering, when one Natupol-Excel bumble bee colony (Koppert Biological Systems, Inc., Howell, MI, USA) was placed in the center bed at the center of the 36.6 m plot (18.3 m inward from each end) to provide pollination services (Fig. 1). Bumble bee boxes were placed on a cinderblock with a paver placed on top of the box and an inverted laundry basket placed on the paver to keep the colony dry. The mesotunnels remained sealed until harvest. Bees were provided with sugar water that was included in the colony box but were not supplemented with any additional food resources. At the end of the growing season, boxes were removed from the plots and disposed of according to Koppert Biological Systems product handling directions (Koppert Biological Systems, 2025).
Sampling and data collection
To determine the pest control efficacy of each treatment, we deployed two measurements of pest abundance. First, one week after transplanting, one sticky card (6.4 cm × 8.9 cm; Arbico Organics, Oro Valley, AZ, USA) was placed 1.5 m inward from each plot end in the center bed in each plot. The sticky cards were removed after seven days (Table 1). A second set of sticky cards was deployed after the completion of pollination for one week and then removed (Table 1). All cucurbit insect pests trapped on the sticky card were identified and quantified. Second, survey subplots consisting of one focal acorn squash plant were marked at approximately 2 m, 9 m, 17 m, 19 m, 27 m, and 35 m locations on the center bed from the south facing edge of the field (Fig. 3), for a total of six plants per subplot. Locations were chosen to capture differences between the center of the bed (17 m and 19 m), the ends of the bed (2 m and 35 m), and equidistant between the ends and the center of the bed (9 m and 27 m). A trained surveyor observed key pests for 60 s on the marked squash plants as in Skidmore et al. (Reference Skidmore, Wilson, Williams and Bessin2019). Surveys were conducted in the morning, before 11 am, and were conducted on days when it was not raining. Striped and spotted cucumber beetles and squash bug adults, nymphs, and egg clusters were monitored in these weekly surveys. In 2020, visual pest surveys began at flowering since all treatments were covered with row covers from transplant and theoretically should have no pests under the row covers until opened or removed for pollination. In 2021, surveys began the week after transplant to collect evidence that no pests were present underneath the mesotunnels until pollination. At the end of the growing season, immediately before harvest, we evaluated wilting symptoms associated with bacterial wilt and CYVD in each plot. We counted the number of wilted plants, including dead plants, in each of the beds across each treatment. However, when plants were submitted to the University of Kentucky Plant Diagnostic Lab, results were inconclusive. Therefore, we have no definitive confirmation that the wilting symptoms we saw were evidence of bacterial wilt or CYVD. No wilt symptoms were observed in the field in 2020, therefore no analysis was conducted.
To determine the activity of pollinators in each experimental treatment, we observed the six marked squash plants (identified in Fig. 3) for 45 s each as in Winfree et al. (Reference Winfree, Williams, Gaines, Ascher and Kremen2008). Surveys were conducted in the morning (8–11 am) on clear days once weekly during the crop’s flowering period. Pollinators were surveyed twice in 2020 and three times in 2021 (Table 1). For each 45-s survey, we observed the number of flower visitations by squash bees (Peponapis pruinosa Say; Hymenoptera: Apidae), honey bees (Apis mellifera Linnaeus.; Hymenoptera: Apidae), small native bee species (such as those in the Halictidae or Megachilidae families), and bumble bees (Bombus impatiens Cresson; Hymenoptera: Apidae), and pollinator activity was defined as the number of bees flying over or present within the survey area. In 2021, two of the harvested mature acorn squash fruits were selected from each of the marked plants to assess the number of seeds per fruit as a proxy for pollination success as in Minter and Bessin (Reference Minter and Bessin2014). Twelve fruits from each subplot were weighed and seeds were counted in order to calculate a seed per fruit and seed per weight ratio (Knapp and Osborne, Reference Knapp and Osborne2019). Seeds were extracted by cutting the fruit in half and scooping out the seeds. Seeds were separated from the pulp by hand and counted.
Organic pesticide application decisions were made based on action thresholds determined from existing literature. For striped and spotted cucumber beetle, the threshold for spraying is one beetle per plant (Brust, Foster and Buhler, Reference Brust, Foster and Buhler1996; Burkness and Hutchison, Reference Burkness and Hutchison1998; Brust and Foster, Reference Brust and Foster1999). We also followed the published threshold of one adult squash bug per plant or one egg cluster per plant to manage for squash bugs (Doughty et al., Reference Doughty, Wilson, Schultz and Kuhar2016). Insecticides used included kaolin clay (Surround WP, Tessenderlo Kerley, Inc., Phoenix, AZ, USA; 28.35 kg/ ha−1), pyrethrins and azadirachtin (Azera, MGK Company, Minneapolis, MN, USA; 3.55 L/ ha−1), and an adjuvant (Nu-Film P, Miller, Hanover, PA, USA; 295.7 mL/ ha−1). After the first observation of adult squash vine borers in two pheromone traps (Great Lakes IPM, Vestaburg, MI, USA) set out on the perimeter of the experimental fields, we also included Bacillus thuringiensis (Javelin WG, Certis Biologicals, Columbia, MD, USA; 1.5 kg/ha−1) in the insecticide mixture. Based on weekly pest survey results, insecticides were applied once weekly in the late evening if the decision threshold was met. In 2020, we applied insecticides twice during the experiment (Supplementary Table 1). In 2021, we sprayed insecticides six times. Of those six times, we sprayed twice for cucumber beetles, and the remaining four times were applications for squash vine borer (Supplementary Table 1). There are two nonvectored diseases of cucurbits, powdery mildew (Podosphaera fusca [Fries] Braun & Shishkov or Erysiphe cichoracearum [de Candolle] Heluta; Pérez‐García et al., Reference Pérez‐García, Romero, Fernández-Ortuño, López-Ruiz, de Vicente and Tores2009; McGrath, Reference McGrath2015) and downy mildew (Pseudoperonospora cubensis (Berkeley & M.A. Curtis) Rostovzev; Sharma, Katoch and Rana, Reference Sharma, Katoch and Rana2016). Given that those diseases can spread rapidly, it is recommended to apply a contact protectant fungicide such as sulfur, chlorothalonil, or copper as a preventative strategy (McGrath, Reference McGrath2015; Barickman, Horgan and Wilson, Reference Barickman, Horgan and Wilson2017). Therefore, we sprayed an OMRI-approved fungicide, cuprous oxide (Nordox 75 WG, Brandt, Springfield, IL, USA; 1.4 kg/ ha−1) at the first incidence of disease once a week in the late evening and continued until a week before harvest. In 2020, we applied fungicide four times, and in 2021, we applied fungicide three times (Supplementary Table 1).
To determine the impact of treatments on marketable yield, acorn squash was harvested once fruits were mature with a dark green color and an orange spot on the bottom (Table 1). The number of fruits and total weight of fruits were recorded from three plants (consisting of the experimental plant plus one plant on either side of the experimental plant within the same bed) located at each of the six sampling locations (Fig. 3), for a total of 18 plants in each subplot. Fruits were quality graded according to USDA standards and divided into marketable yield (USDA number 1 and USDA number 2) and unmarketable yield (USDA, 1983). Fruits deemed unmarketable included culls due to insect damage, disease damage, and pollination issues including misshapen fruits and small size.
Statistical analyses
The pest visual survey data were organized to capture changes resulting from pollination management given that some treatments were opened or removed at flowering. We aggregated measurements by averaging sampling points that fell within three crop phenology stages that corresponded to pollination management (hereafter, net stage). The ‘pre-flowering’ net stage ranged from transplant until the netting was removed for pollination. The ‘flowering’ net stage ranged from netting removal until the netting replacement after flowering. The ‘post-flowering’ net stage ranged from netting replacement until harvest (Fig. 1).
We compared cucumber beetles and squash bug pest abundance across pollination treatments using a linear mixed model (LMM) with the pollination treatment, net stage, and their interaction as fixed effects, and block as random effect. Each year was modeled independently to observe differences between years. Computations were performed using R statistical software, version 4.0.3 (R Core Team, 2020, R Foundation for Statistical Computing, Vienna, Austria) and the function ‘lmer’ (R-package ‘lme4’; Bates et al., Reference Bates, Mächler, Bolker and Walker2015). We tested if model residuals met the assumptions of normality with a Shapiro–Wilks test. For some models, a log (x + 1) or a square root transformation was used to improve model normality. Post hoc pairwise contrasts were performed using the function ‘emmeans’ with a Tukey adjustment (R-package ‘emmeans’; Lenth et al., Reference Lenth, Singmann, Love, Buerkner and Herve2019). For abnormal data that could not be normalized with transformations (culls due to insect damage), the nonparametric Kruskal–Wallis test was used.
To compare pest abundance from sticky traps, pollinator visual surveys, and yield across pollination treatments, we aggregated repeated sampling events using mean values within each experimental unit (plot level, N = 4 per pollination treatment per year). Using mean values circumvents issues with modeling data with many zero data points, improves the fit of models to the assumptions of normality, and avoids overly complex error structures. We then modeled dependent variables using LMM with pollination treatment as a fixed effect and block as a random effect.
To help explain patterns observed within the different pollination treatments, we explored treatment effects along mesotunnel distances to the end through further LMMs. For the open ends treatment, we hypothesized that pests and pollinators would be more abundant nearer to the opened ends of the tunnel during the flowering and post-flowering stages. For the full season treatment with stocked commercial bumble bees, we hypothesized that pollinators would be more abundant in the interior of the tunnel closest to the bee colony. To test these hypotheses, each dataset was subset to only include a single pollination treatment. Although the individual year datasets did not always show statistically significant effects of treatment, they consistently followed the same directional patterns. Therefore, to increase statistical power, and for brevity, we aggregated both years (2020 and 2021) in this analysis (Supplementary Table 2 for individual years). We then modeled pest, pollinator, and yield data using LMM with distance to tunnel end by looking at the two sample plants at each of the distances from the end: 2 m, 9 m, and 17 m distances (Fig. 3). We used distance to tunnel end as a fixed covariate and year and block as random effects.
Results
Cucumber beetles
For the average number of cucumber beetles sampled using sticky cards (Supplementary Fig. 1), we found that there was no effect of pollination treatment during 2020 (F 3,12 = 1.7, p = 0.217) or 2021 (F 3,9 = 2.2, p = 0.152).
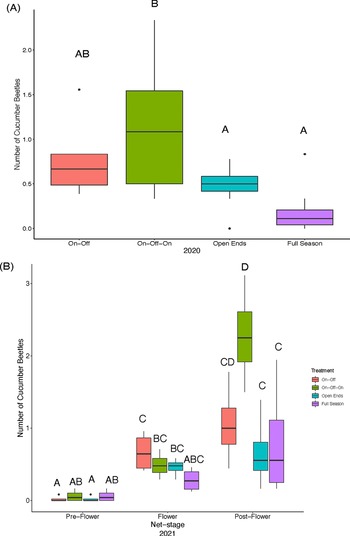
For the visual surveys in 2020, the average abundance of cucumber beetles per plant statistically varied across pollination treatments but did not differ across net stages (Table 2). The on–off–on treatment had significantly more beetles than the full season treatment (5.6 times) and the open ends treatment (2.4 times), but did not differ from the on–off treatment (Fig. 4A and Supplementary Table 3). In 2021, the pollination treatment interacted with net stage (Table 2) such that during the pre-flower net stage, treatments were not significantly different, but during the post-flowering stage, the full season and open ends treatment had significantly fewer cucumber beetles relative to the on–off–on treatment (Fig. 4B and Supplementary Table 4).
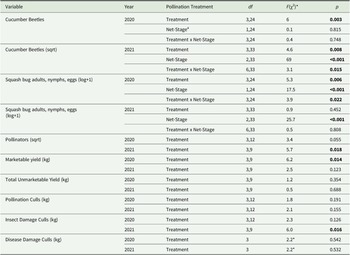
Table 2. Statistical comparisons of mesotunnel treatment effects on pest, pollinator, and yield metrics in 2020 and 2021
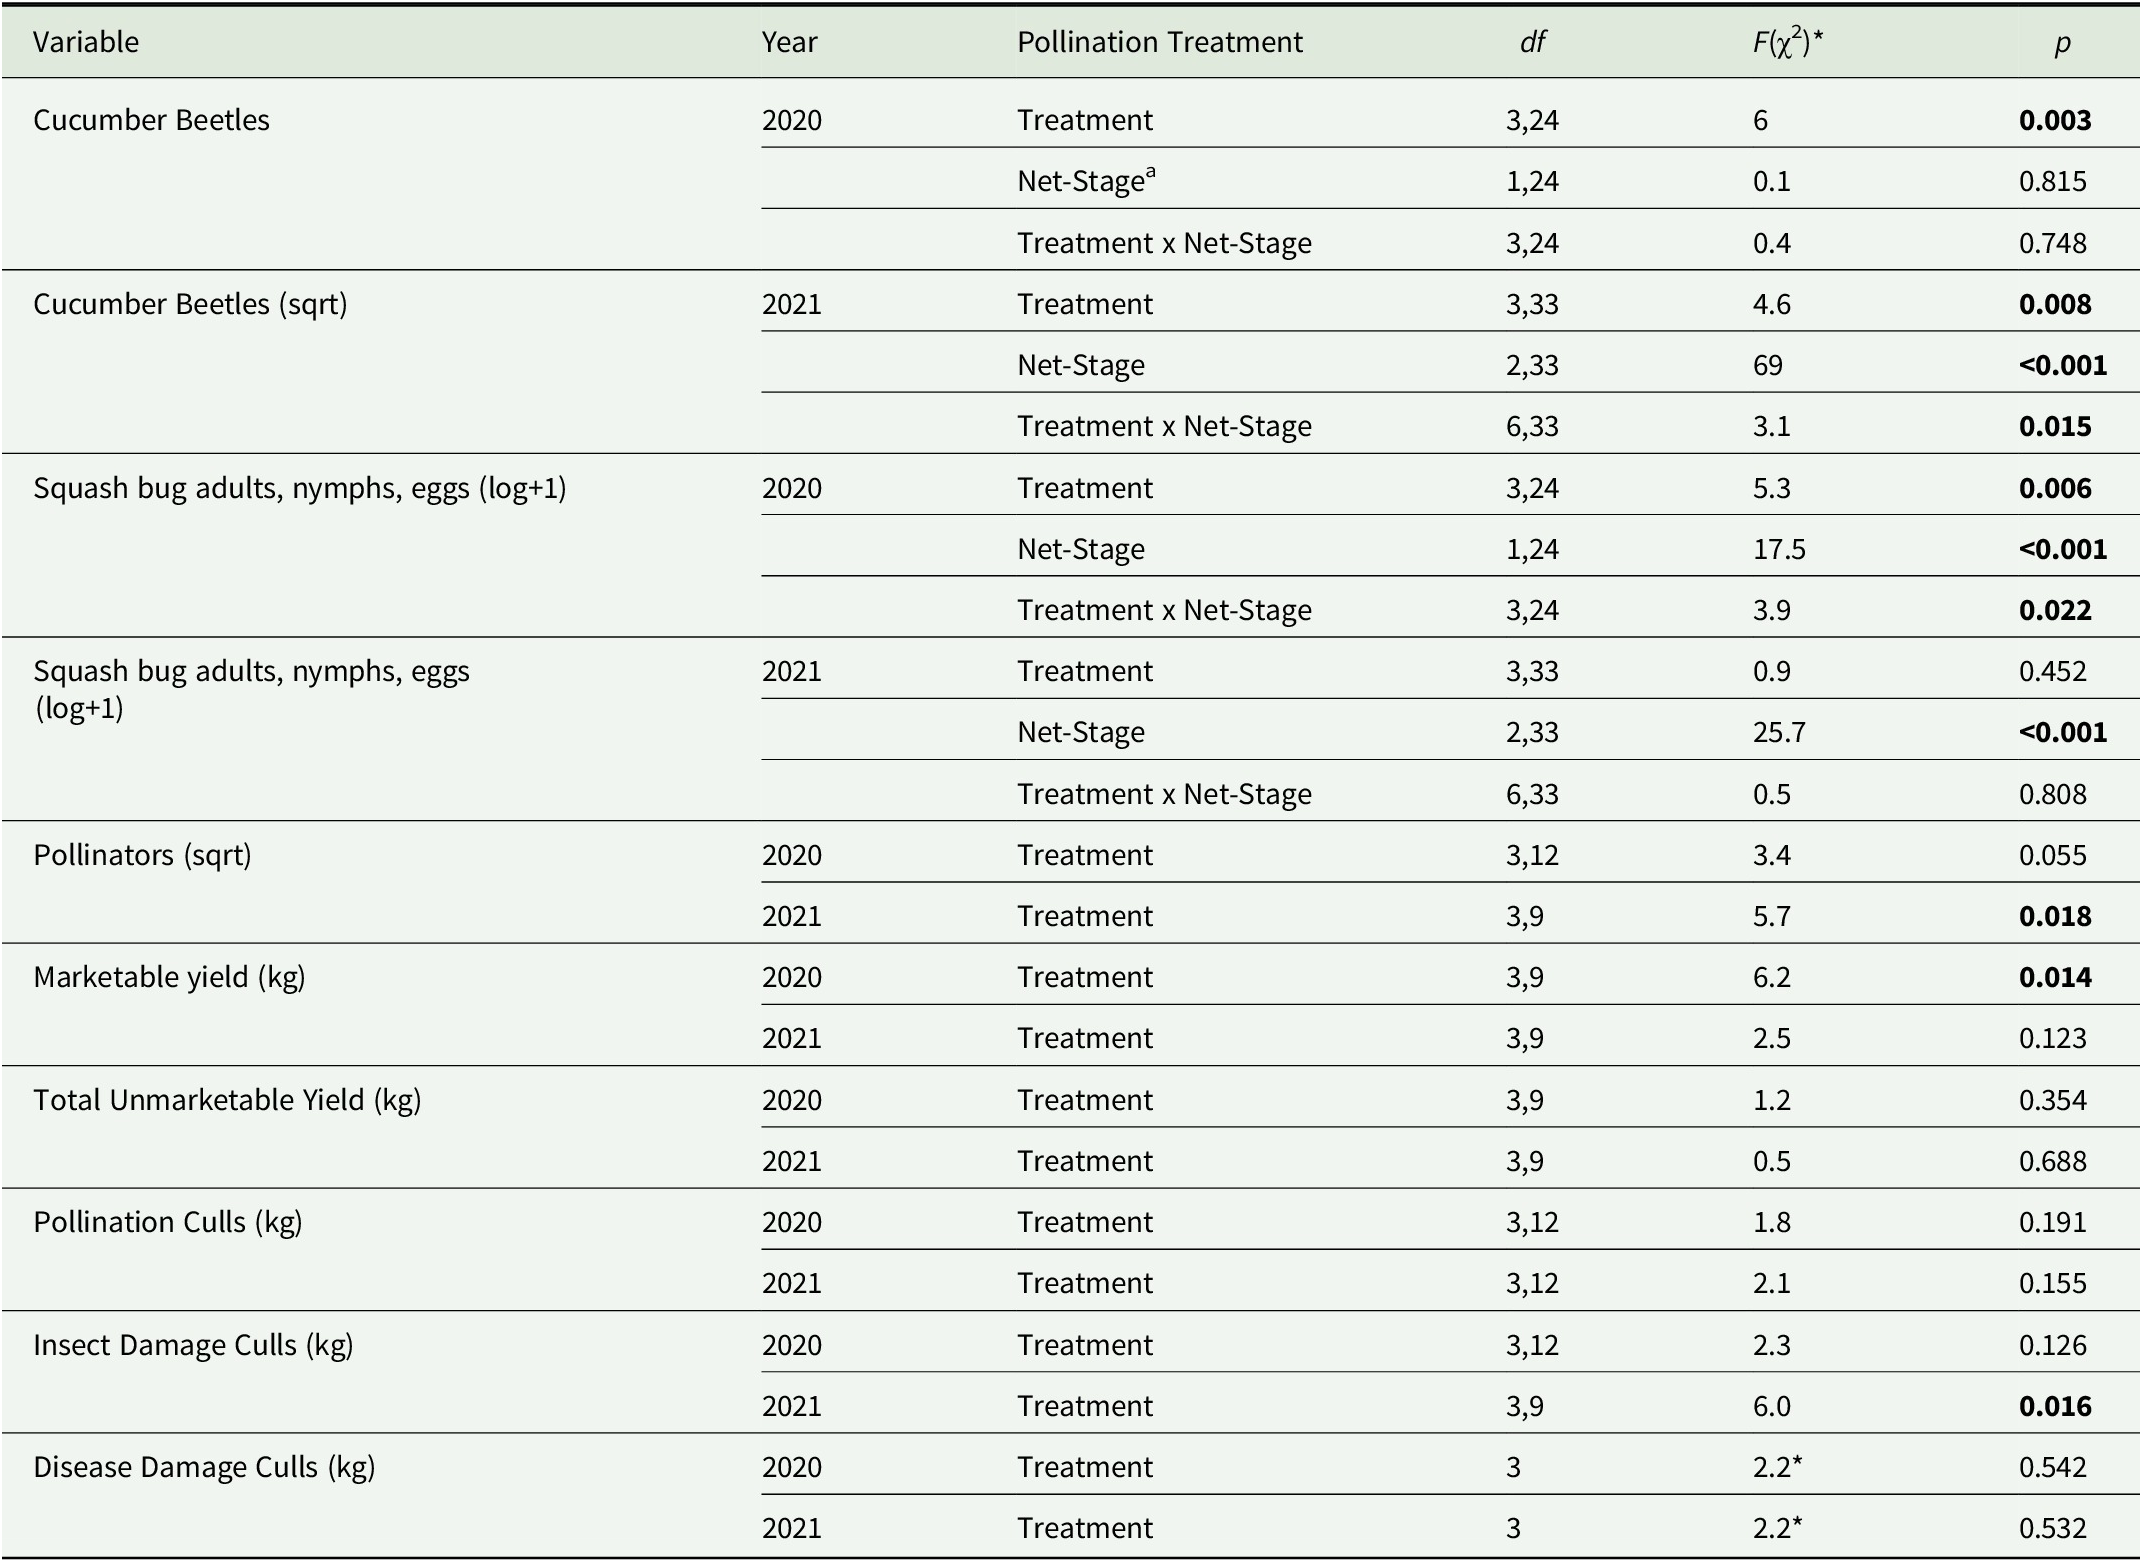
Note: Significant values are indicated in bold with a threshold of p < 0.05. df indicates the degrees of freedom with the first number corresponding to the numerator degrees of freedom and the second number indicating the denominator degrees of freedom. The data were abnormal for disease damaged culls, therefore we used a nonparametric test, Kruskal–Wallis, to compare the effect of treatment on culls due to disease damage.
a Net stage is the phenological plant development stage (pre-flower, flowering, and post-flower). Additionally, mesotunnels were either uncovered (on–off–on) during the flowering net stage or uncovered (on–off) during the flowering and post-flower net stage, or tunnel ends were opened (open ends) during flowering. Full season-stocked bumble bees mesotunnel remained closed the entire growing season.
* The chi-square value is reported instead of the F value as the Kruskal–Wallis test was used to compare treatment effect on culls due to disease.

Figure 4. Average cucumber beetle numbers per plant from visual surveys across 2020 and 2021 for the mesotunnel pollination treatments. (A) Average cucumber beetle numbers per plant from visual surveys in 2020. No visual surveys were completed during the pre-flower net stage in 2020. Therefore, only flowering and post-flowering net stage are presented. There was a significant effect of treatment on cucumber beetles, but no significant effect of net stage. (B) Average cucumber beetle numbers per plant from visual surveys in 2021. There was a significant effect of treatment, net stage, and the interaction of the treatment and net stage on cucumber beetles. Different letters indicate significant differences (p < 0.05) between treatments according to Tukey’s post hoc test.
Squash bug adults, nymphs, and eggs
In 2020, visual surveys of squash bugs (average of summed adults, nymphs, and egg clusters) revealed a statistically significant effect of pollination treatment, net stage, and an interaction between treatments and net stages (Table 2). Squash bug numbers were not significantly different between treatments in the flowering net stage in 2020 (Fig. 5A). However, in the post-flower net stage, the on–off–on treatment had significantly more squash bugs compared to the full season (five times) and open ends (20.3 times) treatments (Fig. 5A and Supplementary Table 5). The on–off treatment did not differ from any of the other treatments in the post-flower net stage (Fig. 5A). In 2021, treatment did not affect squash bugs, but we found that the post-flower net stage had a significantly higher (seven times) number of squash bugs in all treatments compared to both the pre-flower and flowering net stages (Table 2, Fig. 5B, Supplementary Table 6).

Figure 5. Average squash bug adults, nymphs, and eggs per plant across 2020 and 2021 for the mesotunnel pollination treatments. (A) Average squash bug adults, nymphs, and eggs per plant across 2020. There were no surveys conducted during the pre-flower net stage in 2020, therefore there is only flower and post-flower net stage presented. There was a significant effect of treatment, net stage, and the interaction between treatment and net stage. (B) Average squash bug adults, nymphs, and eggs across 2021. There was only a significant effect of net stage on the numbers of squash bugs. Different letters indicate significant differences (p < 0.05) between treatments according to Tukey’s post hoc test.
Disease
No wilting symptoms were observed in 2020. In 2021, pollination treatments did not significantly differ in wilting symptoms (F 3,12 = 0.9, p = 0.482). Less than 17% of the plants in all plots and all treatments were observed to have wilting symptoms or mortality.
Pollinator activity
In 2020, across all treatments, bumble bees made up 75.6% of observations, followed by squash bees (10.4%), honey bees (9.6%), and small native bees (5.2%). Across all treatments in 2021, bumble bees made up 90.2% of observations, followed by honey bees (3.7%), small native bees (3.7%), and squash bees (1.8%). In 2020, pollination treatment did not significantly affect total pollinator observations (Table 2). Conversely, in 2021, pollination treatments did affect the total pollinator observations (Table 2). A Tukey’s post hoc analysis revealed that the full season-stocked bumble bees treatment had significantly fewer bee observations relative to on–off (1.5 times less) and on–off–on (1.7 times less) treatments, but was no different from the open ends treatment (Fig. 6A and Supplementary Table 7).

Figure 6. 2021 significant mesotunnel pollination treatment effects on total bees (A), total honeybees (B), total bumble bees (C), and seeds per weight (D). Different letters indicate significant differences (p < 0.05) between treatments according to Tukey’s post hoc test.
In 2020, there were no statistical differences in squash bee, honey bee, and small native bee observations between treatments (Supplementary Table 8). In 2021, honey bee and bumble bee presence significantly differed between treatments (Supplementary Table 8 and Fig. 5B,C). The full season treatment had significantly fewer honey bees than the on–off and on–off–on treatments, but not the open ends treatment (Fig. 6B and Supplementary Table 7). The full season treatment had significantly fewer bumble bees than the on–off treatment (3.2 times) but was not statistically different from the on–off–on and open ends treatments (Fig. 6C and Supplementary Table 7).
In 2021, the number of seeds per fruit, an indicator of pollination success, did not statistically differ across treatments (F 3,9 = 3.6, p = 0.059), however the number of seeds per kilogram of fruit was significantly different across treatments (F 3,9 = 5.6, p = 0.019; seeds were not counted in 2020). The full season treatment had 1.2 times fewer seeds per weight compared to the on–off–on and open ends treatments (Fig. 6D and Supplementary Table 9). Seeds per weight for the on–off treatment was not statistically different from any other treatments (Fig. 6D and Supplementary Table 9).
Yield
Acorn squash marketable yield (kg) had statistically significant variation across pollination treatments in 2020 (Table 2). The open ends treatment had 1.6 and 1.1 times greater marketable yield compared to the full season and the on–off–on treatments, respectively, though it was not significantly different from the on–off treatment (Fig. 7 and Supplementary Table 10). In 2021, there was no statistically significant difference in marketable yield (kg) across pollination treatments (Fig. 7 and Supplementary Table 10). Total unmarketable yield of acorn squash did not statistically differ between treatments in 2020 or 2021, nor did culls due to pollination defects, or disease damage (Table 2 and Supplementary Table 10). In 2020, there was no statistical difference between treatments for culls due to insect damage (Table 2). However, in 2021, there was a statistically significant difference in culls due to insect damage (Table 2). The on–off–on treatment had significantly greater insect damage culls compared to the open ends treatment (Supplementary Table 10).

Figure 7. Marketable yield of acorn squash across 2020 and 2021 for the mesotunnel pollination treatments. (A) Marketable weight (kg) of acorn squash across 2020. There is an effect of treatment on yield. Different letters indicate significant differences (p < 0.05) between treatments according to Tukey’s post hoc test. (B) Marketable weight (kg) of acorn squash in 2021. There was no effect of treatment on yield in 2021.
Variation of treatment impact along mesotunnel distances to the end
To help explain patterns of pest abundance, pollinator activity, and marketable yield across treatments, we assessed the relationship of these variables to the distance from the ends of mesotunnels. For the open ends treatment, there was a statistically significant negative relationship between the abundance of cucumber beetles (Fig. 8A) and the distance from the opening of the mesotunnel ends (Table 3). There was no statistical relationship between distance from the opening and the bees observed within the open ends treatment (Fig. 8C and Table 3) nor was there a statistical relationship between distance from the opening and squash bug adults, nymphs and eggs (Fig. 8B and Table 3). Marketable yield had a statistically significant positive relationship with distance from the opening of the mesotunnel in the open ends treatment (Fig. 8D and Table 3).

Figure 8. Linear mixed effects regression model to show the relationship between distance from the ends and agronomic variables in the open ends treatment compared to the on–off–on treatment across 2020 and 2021. We sampled two locations at each of the 2, 9, and 17 m distances (Fig. 2). Means represent all samples during the flowering and post-flowering net stages. Solid lines indicate statistically significant relationships (p < 0.05); dashed lines indicate nonsignificant relationships. Mean (A) cucumber beetle observations, (B) squash bug adults, nymphs, and eggs, (C) pollinator visitations, and (D) marketable yield in kg in open ends. Mean (E) cucumber beetle observations, (F) squash bug adults, nymphs, and eggs, (G) pollinator visitations, and (H) marketable yield in kg in on–off–on.
Table 3. Linear mixed effects regression model to show the relationship of pest, pollinator, and yield variables to distance from mesotunnel ends across 2020 and 2021
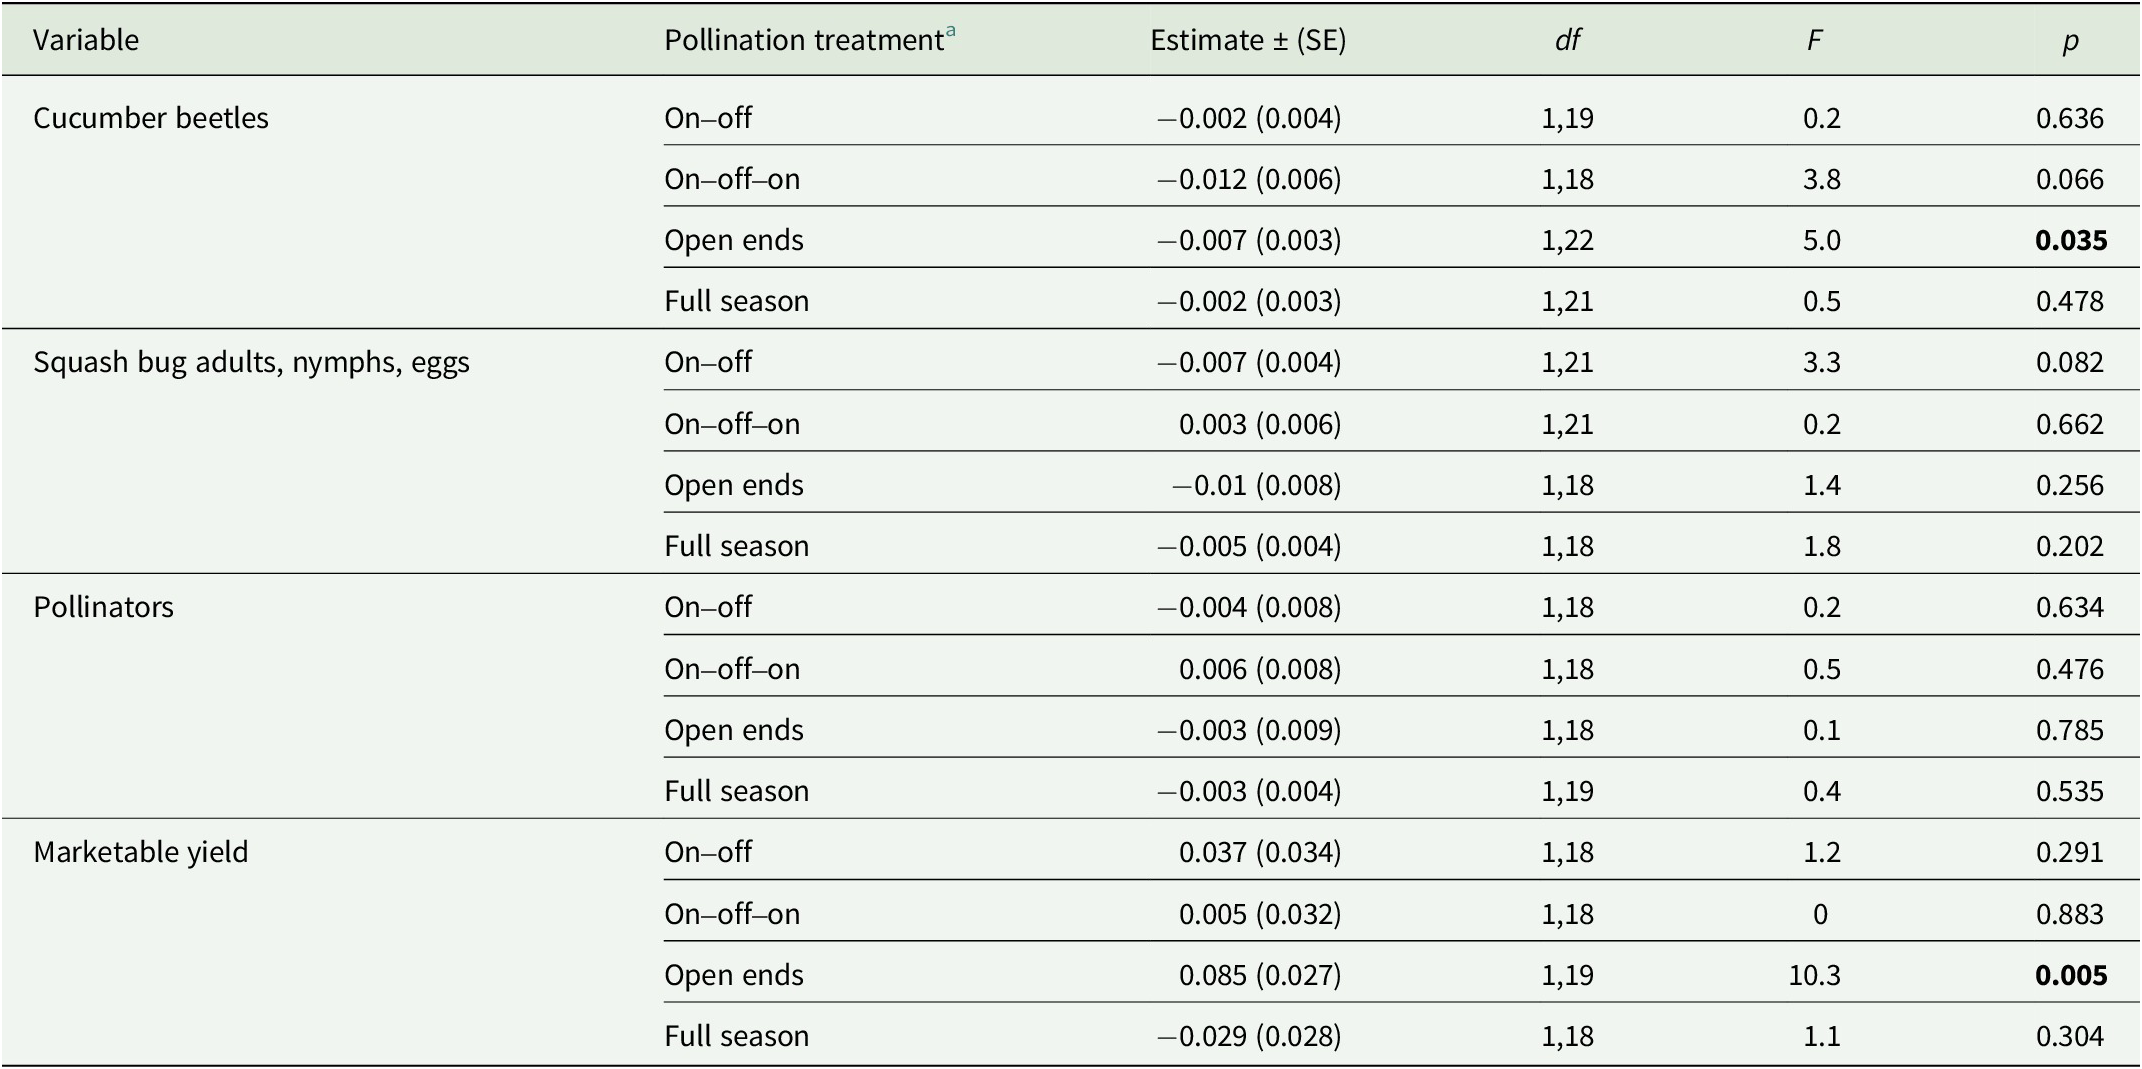
Note: Significant values are indicated in bold with a threshold of p < 0.05. df indicates the degrees of freedom with the first number corresponding to the numerator degrees of freedom and the second number indicating the denominator degrees of freedom. SE indicates the standard error.
a Each pollination treatment was assessed independently. Data were combined across year and includes the flowering and post-flowering net stages only for pests, the flowering net stage for pollinators, and the post-flowering net stage for yield.
The full season treatment, stocked with commercial bumble bee colonies placed at the center of each mesotunnel, was expected to have higher bee activity and greater yield at the center of the tunnel relative to the ends. However, we observed no relationship between the distance from tunnel ends and pest abundance, bee presence, or marketable yield (Table 3). Furthermore, in the on–off–on and on–off treatments, we observed no relationship between distance from mesotunnel end and any response variables (Fig. 8E–H and Table 3).
Discussion
This study reveals that there are trade-offs between protecting acorn squash from insect pests and meeting pollination requirements. Although opening the mesotunnel ends potentially risks exposure of the acorn squash to insect pests, we found that it significantly reduced cucumber beetles without compromising pollinator activity. This reduction in pests while still allowing pollinator access contributes to why the open ends treatment, though only significantly higher in 2020, had consistent yields across years. While the full season treatment effectively reduced insect pests, despite stocking with commercial bumble bees, we found significantly lower pollinator abundance and seed counts per fruit weight in 2021, which may have contributed to inconsistent marketable yields between years. Recommendations for pollination management while balancing pest control may vary depending on wild pollinator abundance, pest populations, and disease severity. The results from this research can better inform different pollination management strategies based on the growing conditions or a producer’s farm operation. We recommend the open ends strategy for producers that have low-to-moderate pest and vectored disease abundance and the full season-stocked bumble bee strategy for producers with high pest and vectored disease abundance.
Open ends treatment reduces pests without compromising pollination
We found that the open ends treatment had the highest crop yields in 2020 and statistically equivalent yields in 2021, suggesting that it provides the most consistent yields of all the treatments. While all treatments provided protection against pests in the early growth stage of the growing season, the open ends and the full season treatments were superior to on–off–on in the post-flower net stage (in 2021; Figs. 4 and 5). Previous literature suggests that feeding damage on cotyledons during the early growth stage can cause yield reductions and reduced plant vigor (Brewer, Story and Wright, Reference Brewer, Story and Wright1987). Row covers can also increase the growth and size of cucurbit plants (Acharya, Welbaum and Arancibia, Reference Acharya, Welbaum and Arancibia2019; Acharya et al., Reference Acharya, Reiter, Welbaum and Arancibia2020a), likely rendering the plants more attractive to cucumber beetles. However, plants that are larger and more mature may be more resilient to cucumber beetle damage because they have a greater leaf surface area per beetle and larger root systems that can regenerate damaged plant tissues (Brewer, Story and Wright, Reference Brewer, Story and Wright1987). In the on–off–on treatment, higher levels of cucumber beetles were observed in the post-flower net stage. This may indicate that pests were trapped within the mesotunnels after row covers were replaced, maintaining a higher density per plant through the post-flowering net stage. Furthermore, it is possible that cucumber beetles could complete a lifecycle by the flowering or post-flowering net stages, thus, increasing in abundance beneath the mesotunnels (Legault, Reference Legault2007). Despite the potential to trap pests in the mesotunnels after closing the ends of the tunnels in the open ends treatment, we still found that the open ends had 3.4 times fewer cucumber beetles than the on–off–on treatment. Furthermore, as the distance from the ends analysis revealed, we found statistically fewer cucumber beetles in the interior of the open ends mesotunnels compared to the ends. This suggests that either cucumber beetles do not travel as far into the tunnels, or there is resource saturation on the ends of the tunnels, keeping the beetles closer to the opened ends. Thus, this may help explain the yield reduction near plot ends, but increased yields in the interior of the open ends tunnels.
While the open ends treatment reduced the number of cucumber beetles that reached the interior of the mesotunnel, we found no evidence that pollinator activity was compromised. Pollinators were able to access the entire length of the tunnel, and this may be reflected in the spatial uniformity of yield. We found no significant differences in the open ends treatment for mean seeds per kg of acorn squash (Supplementary Table 11) or number of bee observations (Fig. 8C) across distances from the tunnel opening, suggesting that pollinators were ubiquitous throughout the tunnel.
Full season-stocked bumble bees treatment has inconsistent yields
Despite having full protection from pests during the entire growing season, the full season-stocked bumble bee treatment had variable yields across this two-year study. It is possible that a lack of pollination contributed to the inconsistent yields of the full season treatment, as evidenced by the lower seed count in 2021. However, it may be possible that one commercial bumble bee colony per 36.6 m mesotunnel may not be sufficient to provide effective pollination services for acorn squash. The full season treatment had 2.6 to almost 3 times lower pollinator counts compared to all other treatments in 2021 (Fig. 6). This suggests that the pollination services provided by the commercial bumble bees were less effective relative to the ambient wild pollinators in the other treatments. In contrast to our results, a similar recent study in muskmelon found that full season mesotunnels (5.5 m × 45.7 m) stocked with bumble bees resulted in the highest marketable yields compared to open ends and on–off–on and was statistically higher in two of the three-year study (Mphande et al., Reference Mphande, Badilla-Arias, Cheng, González-Acuña, Nair, Zhang and Gleason2024). Similarly, in smaller tunnels (1 m × 4.8 m) stocked with honey bees, Gaye, Maurer and Seywerd (Reference Gaye, Maurer and Seywerd1991) found increased marketable yield for muskmelon in one year compared to uncovered controls. Using slightly larger tunnels (1 m × 9 m), Rojas et al. (Reference Rojas, Gleason, Batzer and Duffy2011) found greater yield in plots with stocked bumble bees compared to the on–off pollination strategy in muskmelons. However, using 5.4 m × 9 m tunnels, Nelson et al. (Reference Nelson, González-Acuña, Nair, Cheng, Mphande, Badilla-Arias, Zhang and Gleason2023) found that in most years full season-stocked bumble bee mesotunnels had greater muskmelon yields than on–off pollination strategies, but were usually equivalent to on–off–on pollination strategies. Thus, while the results of Nelson et al. (Reference Nelson, González-Acuña, Nair, Cheng, Mphande, Badilla-Arias, Zhang and Gleason2023) and Mphande et al. (Reference Mphande, Badilla-Arias, Cheng, González-Acuña, Nair, Zhang and Gleason2024) suggest that the stocked bumble bees are effective for either small or large mesotunnels for muskmelon, our study suggests they may be inadequate to pollinate larger commercial-scale mesotunnels over acorn squash.
It also may be that the mesotunnel environment may not be conducive to bumble bee health. Indeed, it has been found that protective agricultural systems, including greenhouses, high tunnels, low tunnels, and mesotunnels, impact pollinator health negatively by decreasing reproduction, increasing adult mortality, reducing forager activity, and increasing disease prevalence (Kendall et al., Reference Kendall, Evans, Gee, Smith, Gagic, Lobaton, Hall, Jones, Kirkland and Saunders2021). Temperature, humidity, light penetration, orientation cues, nutritional resources, and chemical exposure within protective agricultural environments impact bee colony health and pollination services (Kendall et al., Reference Kendall, Evans, Gee, Smith, Gagic, Lobaton, Hall, Jones, Kirkland and Saunders2021). Previous studies have not observed that mesotunnels using fine-mesh netting substantially modify temperature, humidity, or light penetration (Nelson et al., Reference Nelson, González-Acuña, Nair, Cheng, Mphande, Badilla-Arias, Zhang and Gleason2023; Pethybridge et al., Reference Pethybridge, Damann, Murphy, Diggins and Gleason2024a), therefore it is unlikely that abiotic factors have negatively contributed to colony health. Additionally, bumble bees were not exposed to insecticides in these studies (Rojas et al., Reference Rojas, Gleason, Batzer and Duffy2011; Nelson et al., Reference Nelson, González-Acuña, Nair, Cheng, Mphande, Badilla-Arias, Zhang and Gleason2023) and in our study, we made efforts to apply insecticides in the late evening when pollinators were not active. Therefore, it may be plausible that the impact of floral resources (nectar and pollen) may be the largest driver of pollinator health underneath mesotunnels. In fact, some studies have shown that cucurbit pollen is toxic and nutritionally deficient for bumble bees, which may contribute to reduced colony health and foraging activity within the mesotunnels (Brochu et al., Reference Brochu, van Dyke, Milano, Petersen, Mcart, Nault, Kessler and Danforth2020). Of the studies cited in Kendall et al. (Reference Kendall, Evans, Gee, Smith, Gagic, Lobaton, Hall, Jones, Kirkland and Saunders2021), few have investigated techniques to modify protective covers to enhance pollinator health. One such technique for future research directions could be to investigate whether supplementing floral resources within the mesotunnels provides better quality nutrition to the bumble bee colonies.
An alternative explanation may be that there may be extreme variation in the quality or size (number of workers) of commercial bumble bee colonies, which could introduce variation in pollination success and marketable yield. One study compared ten Koppert B. impatiens commercial colonies and found significant variation in worker body size, even though all were fed the same diet (Couvillon et al., Reference Couvillon, Jandt, Duong and Dornhaus2010). Furthermore, commercial bumble bee colonies often have smaller body sizes due to selection for larger colony sizes (Pugesek, Burtt and Crone, Reference Pugesek, Burtt and Crone2021) and colonies with larger workers will acquire more resources and produce more workers compared to smaller colonies (Herrmann, Haddad and Levey, Reference Herrmann, Haddad and Levey2018). Unfortunately, in our study, we did not assess the quality or health of the bumble bee colonies. More research is needed to understand how to improve the management of commercial bumble bees for pollination in controlled environment agricultural systems such as mesotunnels.
When the yield benefits are inconsistent from year to year, it may be too expensive for producers to purchase commercial bumble bee colonies. Each colony may cost between $100 and $150 USD. While our study did not conduct any economic analyses, similar studies have done so. Mphande et al. (Reference Mphande, Badilla-Arias, Cheng, González-Acuña, Nair, Zhang and Gleason2024) found that the full season treatment had higher costs due to the cost of the bumble bee hives compared to the open ends and on–off–on treatments. Despite the higher costs, the full season treatment did have higher muskmelon yields and was the most cost-efficient treatment (Mphande et al., Reference Mphande, Badilla-Arias, Cheng, González-Acuña, Nair, Zhang and Gleason2024). Similarly, Nelson et al. (Reference Nelson, González-Acuña, Nair, Cheng, Mphande, Badilla-Arias, Zhang and Gleason2023) found that the full season treatment had greater cost-efficiencies only in years where the muskmelon yield was significantly greater than the on–off–on and on–off treatments. Further, Rojas et al. (Reference Rojas, Gleason, Batzer and Duffy2011) found that stocking bumble bees and delaying row cover removal (a treatment approaching the full season treatment) was economically viable only in years of high bacterial wilt incidence. This indicates that purchasing commercial bumble bees may only be worthwhile when the crop is of a higher value (muskmelon vs. acorn squash), it is known that the yields will be greater, and there is low bacterial wilt incidence. For acorn squash in Kentucky, the full season treatment is too inconsistent in terms of yield benefits from year to year to be reliable for producers.
Conclusions
This research helps guide management recommendations for producers using mesotunnels as a pest protective strategy. For producers with low-to-moderate pest and associated vectored disease severity, such as in this study, our results suggest that the open ends strategy is best. As has been demonstrated, the open ends treatment still provides pest protection without compromising pollinator abundance, while it increases marketable yield relative to the on–off–on treatment. This strategy does not require the extra cost of purchasing a bumble bee colony and it takes minimal time to open and close the ends of the mesotunnel. However, for producers that have a history of high pest abundance and associated vectored diseases, the full season-stocked bumble bee strategy may be optimal. While our study did not have significant confirmed disease incidence in either year, past work by Rojas et al. (Reference Rojas, Gleason, Batzer and Duffy2011) and Nelson et al. (Reference Nelson, González-Acuña, Nair, Cheng, Mphande, Badilla-Arias, Zhang and Gleason2023) suggest maintaining row covers as full season or near full season with commercial bumble bees is advantageous during years of high bacterial wilt incidence in muskmelon. In our study under low-to-moderate pest abundance, we found evidence that the full season-stocked bumble bee strategy does provide the best pest suppression, however, without consistent yields in acorn squash.
Supplementary material
The supplementary material for this article can be found at http://doi.org/10.1017/S1742170525100203.
Data availability statement
The data that support the findings of this study are available from the corresponding author, K.F.P., upon reasonable request.
Acknowledgments
We would like to thank Briana Bazile, Megan Crabtree, Isaac D’Souza, Karina Garcia, Viktor Halmos, Sarah Jones, Ryan Kuesel, Delia Scott, Brittany Sortor, and Kantima Thongjued for their help in reviewing, scouting, sampling, or harvesting. We also thank Steve Diver, Aaron German, Jay Tucker, and Neil Wilson at the University of Kentucky Horticulture Research Farm for their assistance and guidance in field set up and irrigation maintenance.
Author contribution
K.F.P., R.B., D.G., R.B., and M.W. designed the experiment. K.F.P., R.B., C.A., A.G., and D.G. were involved with field work. K.F.P. and R.B. collected data. K.F.P. and D.G. contributed to data analysis. K.F.P. and C.A. wrote the manuscript. K.F.P., C.A., R.B., A.G., D.G., R.B., and M.W. edited the manuscript.
Funding statement
This experiment was partially supported by the USDA OREI grant titled ‘Resilient Systems for Sustainable Management of Cucurbit Crops’ Grant #2019-51300-30248 and USDA Hatch grant (KY008079).
Competing interests
The authors declare none.


 Open access