


Introduction
Childhood adversity
Childhood adversity is defined as exposure to environmental circumstances during childhood that require psychological, behavioral, or neurobiological adaptation (McLaughlin, Reference McLaughlin2016). Such experiences include, but are not limited to, physical, emotional, or sexual abuse, physical neglect, witnessing community violence or domestic violence, and household dysfunction (e.g., caregiver substance use or mental illness). Childhood adversity is common, with recent national data showing that approximately 76% of U.S. adolescents have experienced one or more adversity (Swedo et al., Reference Swedo, Pampati, Anderson, Thorne, McKinnon, Brener, Stinson, Mpofu and Niolon2024). Critically, the public health consequences of childhood adversity are profound. Childhood adversity is a potent driver of preventable leading causes of death, disability, chronic disease, and poor health outcomes throughout the lifespan (Merrick et al., Reference Merrick, Ford and Ports2019). A robust body of literature has linked childhood adversity to myriad downstream consequences, including poor physical health (e.g., chronic disease, early mortality; Brown et al., Reference Brown, Anda, Tiemeier, Felitti, Edwards, Croft and Giles2009; Gilbert et al., Reference Gilbert, Breiding, Merrick, Thompson, Ford, Dhingra and Parks2015), mental health (e.g., depression, substance use; Merrick et al., Reference Merrick, Ports, Ford, Afifi, Gershoff and Grogan-Kaylor2017), and worse psychosocial functioning (e.g., economic, conduct, and social problems; McGinnis et al., Reference McGinnis, Sheridan and Copeland2022). A systematic review and meta-analysis found that childhood adversity accounted for 15% of total U.S. mortalities, 33% of sexually transmitted infection cases, and 38% of suicide attempts (Grummitt et al., Reference Grummitt, Kreski, Kim, Platt, Keyes and McLaughlin2021). Although the link between childhood adversity and poor health outcomes is well-established, the mechanisms that explain this relationship is less well understood. Identifying these mechanisms is critical to inform effective prevention and intervention targets. Scholars have argued that the associations between childhood adversity and poor health and wellbeing outcomes in adulthood may be partially explained by increased engagement in health risk behaviors (HRBs) during adolescence (Duffy et al., Reference Duffy, McLaughlin and Green2018). Thus, a better understanding of the relationships between childhood adversity and adolescent HRBs could elucidate a key pathway that links adversity to longitudinal health consequences.
Adolescent health risk behaviors
HRBs (HRBs) contribute to the leading causes of mortality, morbidity, and social problems among adolescents (Centers for Disease Control and Prevention (CDC), National Center for Health Statistics, 2024; CDC, 2024; Kann et al., Reference Kann, Kinchen, Shanklin, Flint, Kawkins, Harris, Lowry, Olsen, McManus, Chyen, Whittle, Taylor, Demissie, Brener, Thornton, Moore and Zaza2014). The CDC’s Youth Risk Behavior Survey (YRBS) monitors categories of high priority HRBs in the U.S., including substance use, dietary habits, physical activity, sexual behaviors, and behaviors that contribute to unintentional injuries and violence (e.g., drinking and driving). Engagement in HRBs is common among U.S. adolescents. National data from the 2021 YRBS found that 29% of high school students reported current use of alcohol, marijuana, or misuse of opioids (Hoots et al., Reference Hoots, Li, Hertz, Esser, Rico, Zavala and Jones2023) and that 18% reported current use of electronic vapor products (Oliver et al., Reference Oliver, Jones, Hops, Ashley, Miech and Mpofu2023). HRBs commonly cluster together and importantly, are concentrated among minoritized communities which underscores the need for inclusion of diverse samples in adversity research. For instance, in a subsample of YRBS data from Philadelphia, 80% of adolescents endorsed between 1 and 3 HRBs (Coleman et al., Reference Coleman, Wileyto, Lenhart and Patterson2014). Adolescent engagement in HRBs yields proximal negative health and wellbeing outcomes (e.g., mental health problems, sexually transmitted diseases, delinquency, violence, poor academic achievement; Bailey, Reference Bailey2009; Topolski et al., Reference Topolski, Patrick, Edwards, Huebner, Connell and Mount2001) and contributes to leading causes of death in adulthood, including cancer, diabetes, cardiovascular disease, stroke, and obesity (Campbell et al., Reference Campbell, Walker and Egede2016). Given the disproportionate concentration of HRBs among minoritized communities, HRBs therefore contribute to longitudinal health inequities. Understanding how adversity increases risk for HRBs can inform opportunities to prevent leading causes of death and disability throughout the lifespan and improve health equity.
Childhood adversity and adolescent health risk behaviors
Childhood adversity has been linked to a range of adolescent HRBs, including delinquency (Ford et al., Reference Ford, Elhai, Connor and Frueh2010), substance abuse (Afifi et al., Reference Afifi, Taillieu, Salmon, Davila, Stewart-Tufescu, Fortier, Struck, Asmundson, Sareen and MacMillan2020), poor physical health indicators (e.g., dietary behaviors, sleep, low physical activity, obesity) (Duke & Borowsky, Reference Duke and Borowsky2018), alcohol use (Dube et al., Reference Dube, Miller, Brown, Giles, Felitti, Dong and Anda2006), and risky sexual behaviors (Fergusson et al., Reference Fergusson, Horwood and Lynskey1997). However, the focus on single adversities or risk behavior outcomes in extant research fails to account for common co-occurrence of both adversities and HRBs. Most (60%) individuals who experience any adversity experience multiple (Kessler et al., Reference Kessler, McLaughlin, Green, Gruber, Sampson, Zaslavsky, Aguilar-Gaxiola, Alhamzawi, Alonso, Angermeyer, Benjet, Bromet, Chatterji, de Girolamo, Demyttenaere, Fayyad, Florescu, Gal, Gureje and Williams2010), and youth who engage in one HRB are likely to engage in multiple such behaviors (Coleman et al., Reference Coleman, Wileyto, Lenhart and Patterson2014; Guilamo-Ramos et al., Reference Guilamo-Ramos, Litardo and Jaccard2005). For instance, alcohol consumption is linked with unintentional injuries (Rew et al., Reference Rew, Horner and Brown2011), and risky sexual behaviors are linked with substance use (Wu et al., Reference Wu, Witkiewitz, McMahon and Dodge2010), suicidality, current smoking, and behaviors that contribute to unintentional injuries (Coleman et al., Reference Coleman, Wileyto, Lenhart and Patterson2014). Given these links between and within adversities and HRBs, research must move beyond examining individual associations towards approaches that more accurately reflect youths lived experiences and account for their common co-occurrence.
The cumulative risk approach is one strategy to account for co-occurring adversities by summing the number of adverse experiences into a total risk score to examine their additive impact on health outcomes. The cumulative risk approach has offered empirical support for a dose – response relationship between childhood adversity and adolescent HRBs, in that youth who experience multiple forms of adversity are at greater risk for engaging in multiple HRBs (Anda et al., Reference Anda, Felitti, Bremner, Walker, Whitfield, Perry, Dube and Giles2006). For instance, in a sample of 500 youth in foster care, Garrido and colleagues (2018) found a direct association between number of adversities and engagement in HRBs. Each additional adversity was associated with a 24%, 48%, and 50% increase in engaging in violence, delinquency, and substance use, respectively (Garrido et al., Reference Garrido, Weiler and Taussig2018). Using a national dataset of 3,785 adolescents, Layne and colleagues (2014) conducted a hierarchical logistical regression and found that for each trauma type endorsed, the odds ratios across nine types of adolescent HRBs significantly increased (Layne et al., Reference Layne, Greeson, Ostrowski, Kim, Reading, Vivrette, Briggs, Fairbank and Pynoos2014). The cumulative risk theory has provided one explanation – chronic adversity exposure – as to why certain youth may be more likely to engage in HRBs. However, this approach operates under the assumption that all forms of adversity exert the same level of influence on child development and masks the potential idiographic impacts of specific sets of adversities. To better understand how childhood adversity confers risk for engaging in HRBs, there is a need to move beyond a cumulative risk approach to examine if and how types of adversity are linked with one another and differ in their associations with HRBs.
There is evidence that types of adversities differentially influence engagement in adolescent HRBs, highlighting a critical limitation of the cumulative risk approach. For instance, a cross-sectional study using data from the 2019 YRBS found that in addition to a graded relationship between total adversities and HRBs demonstrating cumulative risk effects, the mean count of risk behaviors varied by adversity type (Diedrick et al., Reference Diedrick, Clements-Nolle, Anderson and Yang2023). The weighted means were highest for forced sex (2.7), followed by physical abuse (2.1), verbal abuse and mental illness (1.9 each), and household substance abuse (1.8) (Diedrick et al., Reference Diedrick, Clements-Nolle, Anderson and Yang2023). This finding that youth exposed to sexual abuse engaged in more HRBs compared to youth with exposure to other adversities suggests that adversities may not be uniformly linked to later engagement in risk behaviors, such that certain adversities (in this case, sexual violence) may exert stronger influences on HRBs. Another study found that distinct patterns in HRB engagement persist even across more similar adversities (forms of violence exposure). James and colleagues (2018) examined the associations between violence exposure (family or community) and HRBs in a population-based birth cohort study (N = 2,684 adolescents) and found that community and family violence were associated with risky sexual behavior and substance use, respectively, and that neither was linked with obesity (James et al., Reference James, Donnelly, Brooks-Gunn and McLanahan2018). Although violence exposure was the only adversity included in this study, the observed differences in HRBs by context of violence offers further evidence that specific features of adversities may be related to how they impact risk behavior trajectories, even among similar forms of adversity. Taken together, these findings suggest that childhood adversities do not uniformly impact adolescent engagement in HRBs. To improve our ability to predict individual health trajectories following adversity exposure, there is a need for research that aims to identify features of adversities that may explain these observed differences in later HRB engagement. No studies have applied a dimensional framework to examine if the core features of adversity may explain these observed differences, which would greatly advance our ability to predict individual trajectories.
The dimensional model of adversity and psychopathology
Dimensional models aim to classify adversities by their shared underlying features. The dimensional model of adversity and psychopathology (DMAP; McLaughlin et al., Reference McLaughlin, Sheridan and Lambert2014; McLaughlin & Sheridan, Reference McLaughlin and Sheridan2016) characterizes childhood adversity across two core dimensions of threat and deprivation. Threat reflects adversities that pose direct or threat of harm to the child, such as physical, sexual, emotional abuse and violence exposure, whereas deprivation includes experiences characterized by the absence of an expectable input during development, such as neglect. Traditional measurement approaches subsume both threat and deprivation experiences under the same broader umbrella of adversity. By further classifying adversities by into these dimensions, DMAP improves our ability to predict their developmental mechanisms. DMAP asserts that while threat and deprivation commonly co-occur, these dimensions confer risk for downstream outcomes via partially distinct developmental mechanisms. Specifically, threat is posited to affect socioemotional development and has been linked to alterations in fear learning (Machlin et al., Reference Machlin, Miller, Snyder, McLaughlin and Sheridan2019), emotion regulation difficulties (Lambert et al., Reference Lambert, King, Monahan and McLaughlin2017), and heightened emotional reactivity (McLaughlin et al., Reference McLaughlin, Sheridan and Lambert2014), whereas deprivation primarily impacts cognitive development and has been linked to difficulties with cognitive control (Lambert et al., Reference Lambert, King, Monahan and McLaughlin2017; Machlin et al., Reference Machlin, Miller, Snyder, McLaughlin and Sheridan2019), executive functions (Sheridan et al., Reference Sheridan, Peverill, Finn and McLaughlin2017), and blunted reward responsivity (Hanson et al., Reference Hanson, Hariri and Williamson2015). By examining adversities simultaneously to identify their distinct contributions to developmental outcomes, DMAP accounts for co-occurring adversities while also addressing limitations of the cumulative risk approach.
Recently, researchers have extended DMAP to examine if threat and deprivation are differentially associated with health-related outcomes. In their confirmatory factor analysis using longitudinal data (N = 3,253), Usacheva and colleagues (2022) found physical health and cognitive ability were linked to deprivation, whereas aggression was linked to threat (Usacheva et al., Reference Usacheva, Choe, Liu, Timmer and Belsky2022) In a meta-analysis applying DMAP to examine differences in youth psychopathology, Lee and colleagues (2024) found that the associations between adversity and psychopathology were significantly moderated by adversity dimension, such that threat was more strongly associated with youth psychopathology than deprivation (Lee et al., Reference Lee, Kitagawa, Mirhashem, Rodriguez, Hilerio and Bernard2024). These findings suggest that because threat and deprivation function via at least partially distinct developmental pathways, they may differentially affect health and wellbeing outcomes.
No studies have applied DMAP to examine differences in adolescent HRBs. In their review paper, Duffy et al (Reference Duffy, McLaughlin and Green2018) outline core mechanisms that may explain the associations between adversity and HRBs based on neural and psychological alterations to threat detection processes (e.g., increased emotional reactivity), reward-related processes (e.g., blunted reward responsivity that induces increased reward-seeking), and cognitive control (e.g., impairments in executive control may lead to prioritization of immediate gratification). Based on DMAP, these proposed mechanisms may differ by dimension. Specifically, threat may confer risk for HRBs primarily through emotional reactivity and emotion regulation difficulties, whereas deprivation may act via blunted reward responsivity and increased delay discounting. Although Duffy and colleagues (2018) provided a theoretical foundation for pathways through which threat and deprivation both may increase adolescent HRBs, it remains unclear if these proposed pathways yield the same downstream health outcomes, or if there are unique trajectories based on adversity dimensions and their associated mechanisms. Applying DMAP to examine adolescent HRBs could therefore elucidate which mechanisms may best predict engagement in each type of HRB, and if the differences in neural and psychological alterations by dimension confer general versus unique risk for HRBs.
Network analytic approaches
Our understanding of the developmental sequelae and health outcomes of childhood adversity are limited by common methodological approaches, such as sum-scores, latent variable modeling, and single-adversity (de Vries et al., Reference de Vries, Arends, Hulvej Rod, Oldehinkel and Bültmann2022). The complexities described above (e.g., clustering of adversities and risk behaviors within individuals), pose challenges for discerning the individual impacts of adversities in these methods. Novel analytic approaches that can account for the co-occurring nature of adversities and HRBs are needed. To address this gap, scholars have called for the use of network analyses in studying childhood adversity (de Vries et al., Reference de Vries, Arends, Hulvej Rod, Oldehinkel and Bültmann2022). Networks provide a visual representation of the statistical relationships between variables and are an increasingly popular analytic approach in psychology because of their ability to model complex interactions (Epskamp et al., Reference Epskamp, Borsboom and Fried2018). In network structures, nodes reflect observed variables (e.g., adversities and HRBs). Nodes are connected by edges, which represent the statistical relationships between two variables. In psychological networks, edges are direct associations that cannot be explained by other variables in the network and typically reflect partial correlations. Given the common clustering of adversities and risk behaviors, network analyses can illuminate the distinct impacts of individual adversities on HRB engagement and unique adversity-HRB associations by accounting for all other variables and their associations within the network. The network structure is further interpreted to identify patterns in relationships. For instance, edge thickness corresponds with association strength, and node location generally reflects a variables relative influence on the overall network, with more influential nodes placed more centrally. Networks can also generate clusters to elucidate groupings of variables that are closely related in terms of their relative associations with the other variables in the network. This feature is useful for examining if distinct constructs emerge in the data that map onto theoretical models (e.g., threat and deprivation in DMAP).
Though limited in number, a few studies using network analytic approaches provide support for DMAP, finding that threat and deprivation indeed form distinct clusters based on their associations with developmental outcomes (Carozza et al., Reference Carozza, Holmes and Astle2022; Sheridan et al., Reference Sheridan, Shi, Miller, Salhi and McLaughlin2020). No studies have applied network analyses to investigate patterns in adversity-HRB associations by threat and deprivation. In sum, a network analysis is an optimal approach to address shortcomings in the extant literature and examine if and how dimensions of adversity (threat and deprivation) differ in their associations with a range of adolescent HRBs.
The present study
Childhood adversity is associated with engagement in a range of adolescent HRBs that contribute to leading causes of death and disability throughout adulthood. Most evidence for this association has applied the cumulative risk approach, which demonstrates a dose–response relationship between adversity and HRBs (e.g., Garrido et al., Reference Garrido, Weiler and Taussig2018). A growing body of research indicates that dimensions of adversity (threat and deprivation) function via distinct developmental pathways (McLaughlin & Sheridan, Reference McLaughlin and Sheridan2016) and may be differentially linked to health and wellbeing outcomes (Lee et al., Reference Lee, Kitagawa, Mirhashem, Rodriguez, Hilerio and Bernard2024; Usacheva et al., Reference Usacheva, Choe, Liu, Timmer and Belsky2022) However, no studies have examined the associations between childhood adversity and HRBs using a dimensional approach. It remains unclear whether such patterns extend to health behaviors, and if adversity dimensions exert differential influences on HRBs (Duffy et al., Reference Duffy, McLaughlin and Green2018). Better understanding the relationships between childhood adversity and HRBs can inform intervention efforts to disrupt this key pathway that contributes to morbidity and mortality throughout the lifespan following childhood adversity. To address these gaps in the literature, this pre-registered network analysis (https://osf.io/krejc/) sought to examine the independent associations between dimensions of childhood adversity (threat and deprivation) and adolescent HRBs. This study used data from the 2023 YRBS, a publicly available dataset that assesses HRBs in a nationally representative sample of U.S. adolescents (CDC, 2024). We hypothesized that both dimensions of adversity (threat and deprivation) would be linked to adolescent HRBs and based on prior research, that these associations would be stronger for threat-related adversity rather than deprivation. Pre-registration and hypotheses were published on September 2nd, 2024, before the 2023 YRBS data were made publicly available on September 29th, 2024.
Method
Participants and procedures: youth risk behavior survey
The YRBS is a publicly available youth-report questionnaire administered by the CDC every other year since 1991 to monitor health-related behaviors among U.S. adolescents. U.S. schools were recruited using a three-cluster design to ensure selection of a nationally representative sample (see Brener et al., Reference Brener, Mpofu, Krause, Everett Jones, Thornton, Myles, Harris, Chyen, Lim, Arrey, Mbaka, Trujillo, Shanklin, Smith-Grant, Whittle, McKinnon, Washington, Queen and Roberts2024 for a detailed description of methodology). The survey was administered online and comprised 107 single-item measures, with response options ranging from dichotomous yes/no to an 8-point Likert scale, except for those assessing height, weight, and race. The 2023 YRBS sample size was determined by the CDC based on their planned analyses of health behaviors. Questionnaires that failed quality control were excluded from the final YRBS sample (N = 20,103).
Because network analytic approaches require complete data, participants who had missing data on any of the items of interest in the present study were removed. Our final sample included N = 7,691 high school students from grades 9–12 (52% male, 48% female). 46% were white, 26% reported multiple races, 12% Black, 7% American Indian/Alaska Native, 4% Asian, .43% Native Hawaiian/Other Pacific Islander, and 20% were Hispanic. Most students identified as straight (74%), 11% as bisexual, 3% as gay or lesbian, 4% other, and 5% not sure of their sexual orientation. Most were cisgender (93%), 3% of students identified as trans, and 2% were not sure of their gender identity. Adversity exposure was common, with most youth experiencing at least one form of threat (71%) and deprivation (56%). Additional detail on the prevalence of adversity exposure in the full sample is published elsewhere (Swedo et al., Reference Swedo, Pampati, Anderson, Thorne, McKinnon, Brener, Stinson, Mpofu and Niolon2024).
Measures
We included items from the 2023 YRBS that assessed threat, deprivation, and HRBs (see Supplemental Table 1 for a list of the items included in the present study). The full YRBS is publicly available (https://www.cdc.gov/yrbs/data/index.html). Although the psychometric properties of the 2023 questionnaire have not yet been tested, prior iterations of the YRBS have demonstrated high test–retest reliability (Jones et al., Reference Jones, Brener, Queen, Hershey-Arista, Harris, Mpofu and Underwood2024).
Childhood adversity
The 2023 YRBS included eight items to assess childhood adversity that have not been administered in previous years (Swedo et al., Reference Swedo, Pampati, Anderson, Thorne, McKinnon, Brener, Stinson, Mpofu and Niolon2024). These items were adapted from the adverse childhood experiences (ACEs) measure (Felitti et al., Reference Felitti, Anda, Nordenberg, Williamson, Spitz, Edwards, Koss and Marks1998), which demonstrates acceptable internal consistency (θ = 0.86, α = 0.64) and internal validity (r = 0.28–0.70, p < 0.001) among adolescents (Kovács-Tóth et al., Reference Kovács-Tóth, Oláh, Szabó and Fekete2023). Items also underwent testing with high school students to ensure fidelity and suitability with this sample (Massey & Virkar, Reference Massey and Virkar2022).
Threat
Threat items reflect actual or threatened exposure to violence or harm. This included binary (yes/no) items that assessed physically forced intercourse, other experiences of sexual abuse, and witnessing community violence. Physical, emotional abuse, and witnessing domestic violence in the home were assessed on a 5-point scale from 1 (never) to 5 (always).
Deprivation
Deprivation items reflect an absence of expectable environmental input. This included physical neglect and low parent monitoring (i.e., how often parents/adults know where or with whom you are), both measured on a scale from 1 (never) to 5 (always). Unstable housing was assessed by a 7-point nominal scale indicating where youth usually slept in the past month (e.g., parent/guardian’s home, shelter or emergency housing, hotel/motel). Based on prior studies (e.g., Henry et al., Reference Henry, Gracey, Shaffer, Ebert, Kuhn, Watson, Gruhn, Vreeland, Siciliano, Dickey, Lawson, Broll, Cole and Compas2021), parent mental illness, substance use, and incarceration were also included as indicators of deprivation, though it is important to note that the appropriate classification of such adversities in dimensional models is unclear (McLaughlin, Reference McLaughlin2016). These items were assessed via binary (yes/no) response options.
Health risk behaviors
Risky driving
Three items captured past-month frequency of risky driving behaviors. This included (1) texting while driving, assessed on an 8-point scale ranging from 0 times to all 30 days, (2) riding in a car with someone who had been drinking alcohol, and (3) drinking and driving. Drinking and driving items were scored on a 5-point Likert scale from 0 times to 6 or more times.
Violent behavior
Past-year violent behavior was assessed by two items: the number of physical fights engaged in, and the number of fights on school property. Each is assessed on an 8-point scale from 1 (0 times) to 8 (12 or more times) in the past 12 months.
Weapon-carrying
Weapon-carrying was assessed by two items: how many days a gun was carried in the past 12 months and how many days any weapon (e.g., gun, knife) was carried on school property in the past month. Each item is scored on a 5-point scale from 0 days to 6 or more days.
Substance use
Lifetime and current smoking (tobacco, cigarettes, electronic vapor products), alcohol, marijuana, and other illicit drug use items captured substance use. Items for smoking, alcohol, and marijuana assessed age of first use (7-point scale including never, 8 years or younger to 17 years or older), and frequency of use in the past month (7-point scale from 0 days to all 30 days). Smoking and alcohol items also assessed the amount of substance consumed during use in the past 30 days. Illicit drug use items assessed lifetime use of cocaine, inhalants, heroin, methamphetamines, ecstasy, and abuse of prescription pain medications on a 6-point scale from 1 (0 times) to 6 (40 or more times).
Sexual risk
Sexual risk behavior items included age of first intercourse (8-point scale from 11 years or younger to 17 years or older) with younger age reflecting higher risk, lifetime number of sexual partners (7-point scale from 0 people to 6 or more people) with more partners reflecting higher risk, and binary (yes/no) items that assessed the presence of risky sexual behaviors (i.e., behaviors that may contribute to sexually transmitted disease or unintended pregnancy) during the most recent sexual activity. This included alcohol/drug use and methods of protection used (if any).
Physical health
Physical HRBs included: low physical activity (0 days of engagement in 60 minutes of physical activity in the past week), dietary behavior assessed as past-week soda consumption (from 1 (none) to 7 (4 or more times per day)), average hours of sleep per night (7-point scale from 1 (4 or less hours) to 7 (10 or more hours)), and obesity given its linkage to other health consequences. The YRBS dataset calculates obesity as BMI based on self-report weight, gender, and age, and includes a binary obesity variable (yes/no) that defines BMI at the 95th percentile or higher.
Suicidal behaviors
Items capturing engagement in suicidal behaviors included: number of suicide attempts in the past year on a 5-point scale from 1 (0 times) to 5 (6 or more times), and a binary (yes/no) item on whether past-year attempts led to injury that required medical treatment.
Data analysis
Network analyses investigated the hypotheses in the present study. Our network included ten HRB variables (risky driving, violent behavior, weapon carrying, smoking, alcohol, marijuana, and illicit drug use, sexual risk behaviors, suicidal behaviors, and physical health), six threat variables (physical abuse, emotional abuse, physically forced intercourse, sexual abuse, community violence, witnessing domestic violence), and six deprivation variables (physical neglect, lack of housing, low parental monitoring, parental mental illness, substance use, and incarceration). Our process of estimating the networks and analyzing the network structures is described below and follows reporting standards for psychological network analyses (Burger et al., Reference Burger, Isvoranu, Lunansky, Haslbeck, Epskamp, Hoekstra, Fried, Borsboom and Blanken2023). Analyses were consistent with those outlined in our pre-registration.
Variable preparation
First, original scores for some items were transformed prior to analyses to improve network interpretability. Adversities and HRBs were recoded so that higher scores consistently reflected higher severity across all items. For instance, age of first sexual intercourse was assessed from 1 (never), 2 (11 or younger) through 8 (17 years or older). Because earlier age of first intercourse reflects higher risk, the original scores of 2 through 8 were reverse coded. Nominal scales were also dichotomized to indicate the presence or absence of an adversity or HRB. For instance, housing was originally assessed on a 7-point scale. Because six response options reflected unstable housing, this item was dichotomized as stable (parent/guardian’s home) or unstable (other responses). Aside from these transformations, original scales were preserved and mixed data types were accounted for in analyses. The original scales and transformations (when applicable) of all items are shown in Supplemental Table 1.
Given the large number of HRB variables included, composite scores were necessary to maximize the interpretability of networks. HRB composites were based on the categories outlined in the YRBS and reflect the severity of the following categories of behaviors: risky driving behaviors, violent behavior, weapon carrying, sexual behaviors, suicidal behaviors, physical health, alcohol, marijuana, smoking, and illicit drug use. When items within a category were assessed on the same scale, the composite was calculated as the sum of original scores. When items within a category were assessed on different scales, original scores were first standardized into z-scores, and these standardized scores were summed to create the total composite score. This method is consistent with recommended approaches to total risk calculation in the childhood adversity literature (Ettekal et al., Reference Ettekal, Eiden, Nickerson, Schuetze and Tran2019) and allowed us to more accurately model the nuanced adversity-HRB associations by retaining critical information about ranges in severity and frequency of risk behaviors that are captured in Likert-scales.
Individual adversity scores were used to estimate adversity-HRB associations in our main analyses. Threat and deprivation composite scores, reflecting total dimension severity, were used only for the purpose of providing a clearer visual comparison of network structures by controlling for each dimension. Rather than transforming frequencies into binary indicators of exposure (i.e., cumulative risk), adversity composites were calculated using the same approach described above to account for severity and frequency of exposures.
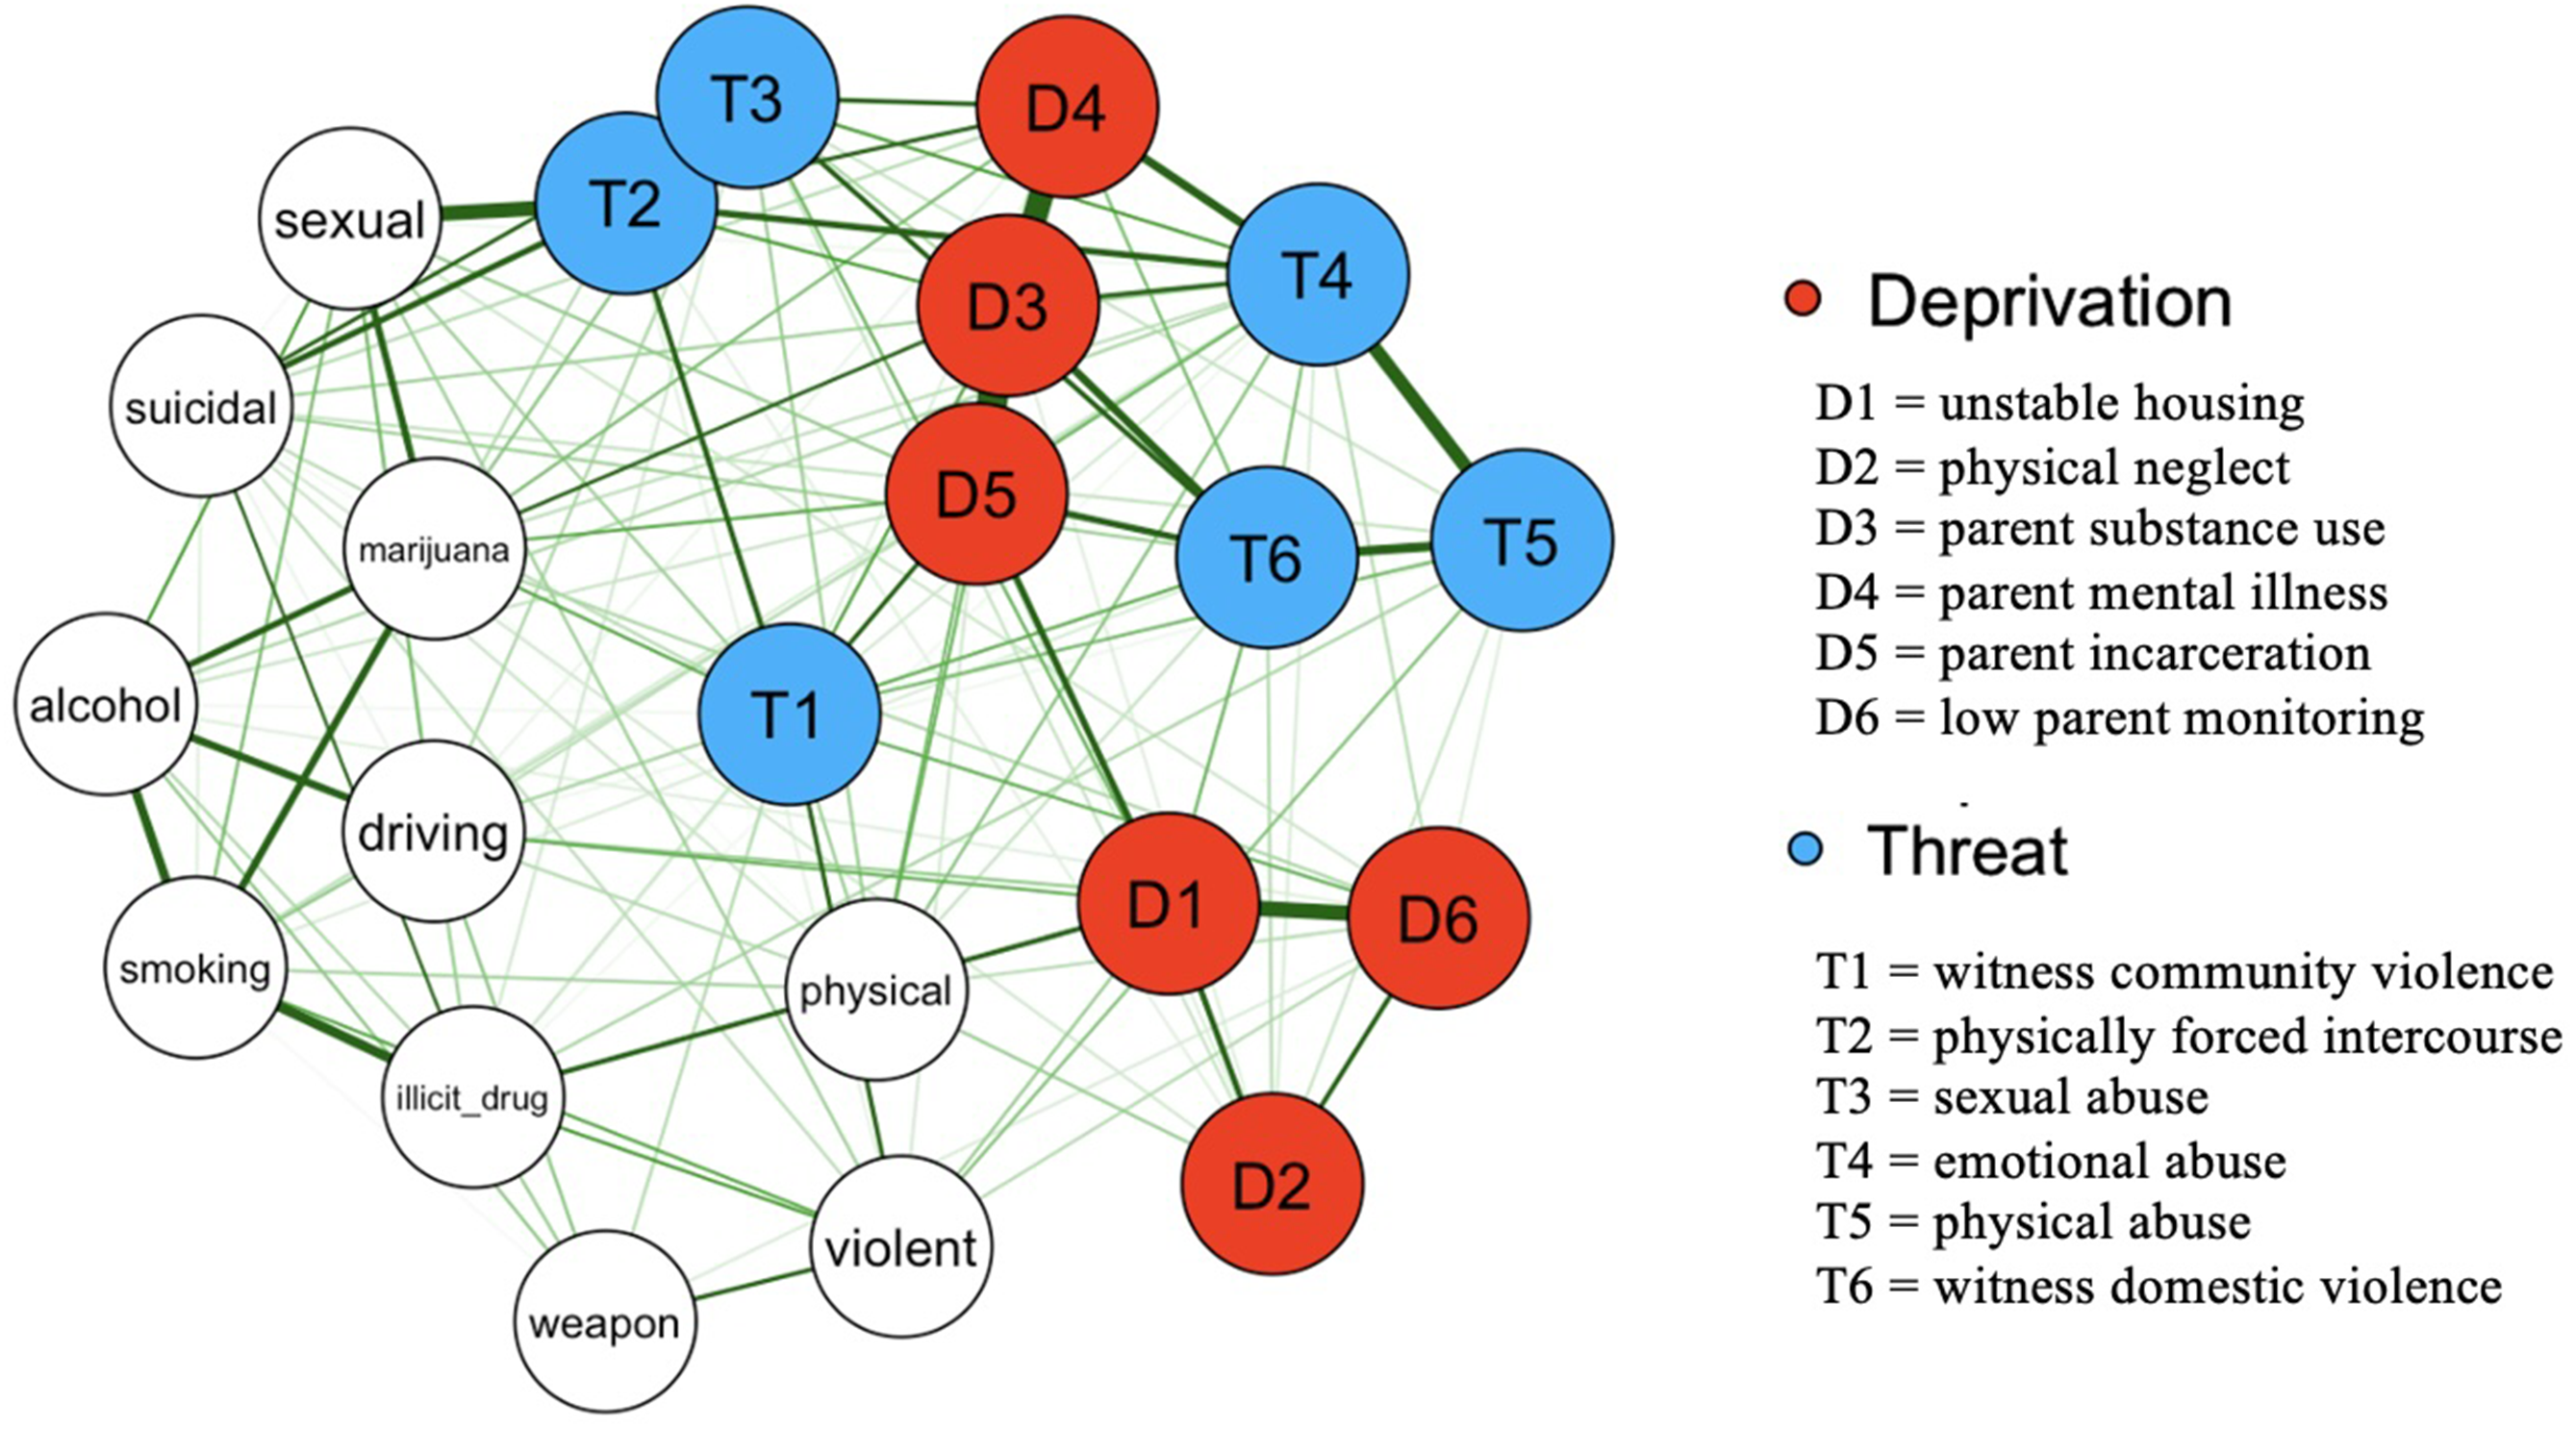
Figure 1. Network of the associations between individual threat and deprivation adversities and health-risk behaviors. Nodes reflecting deprivation adversities are labeled in red, threat adversities are labeled in blue, and HRBs are in white (n = 10; marijuana use, sexual risk behaviors, alcohol use, risky driving, smoking use, suicidal behaviors, illicit drug use, physical health, violent behavior, weapon carrying). Edges reflect partial associations between variables, with thicker edges indicating stronger associations.
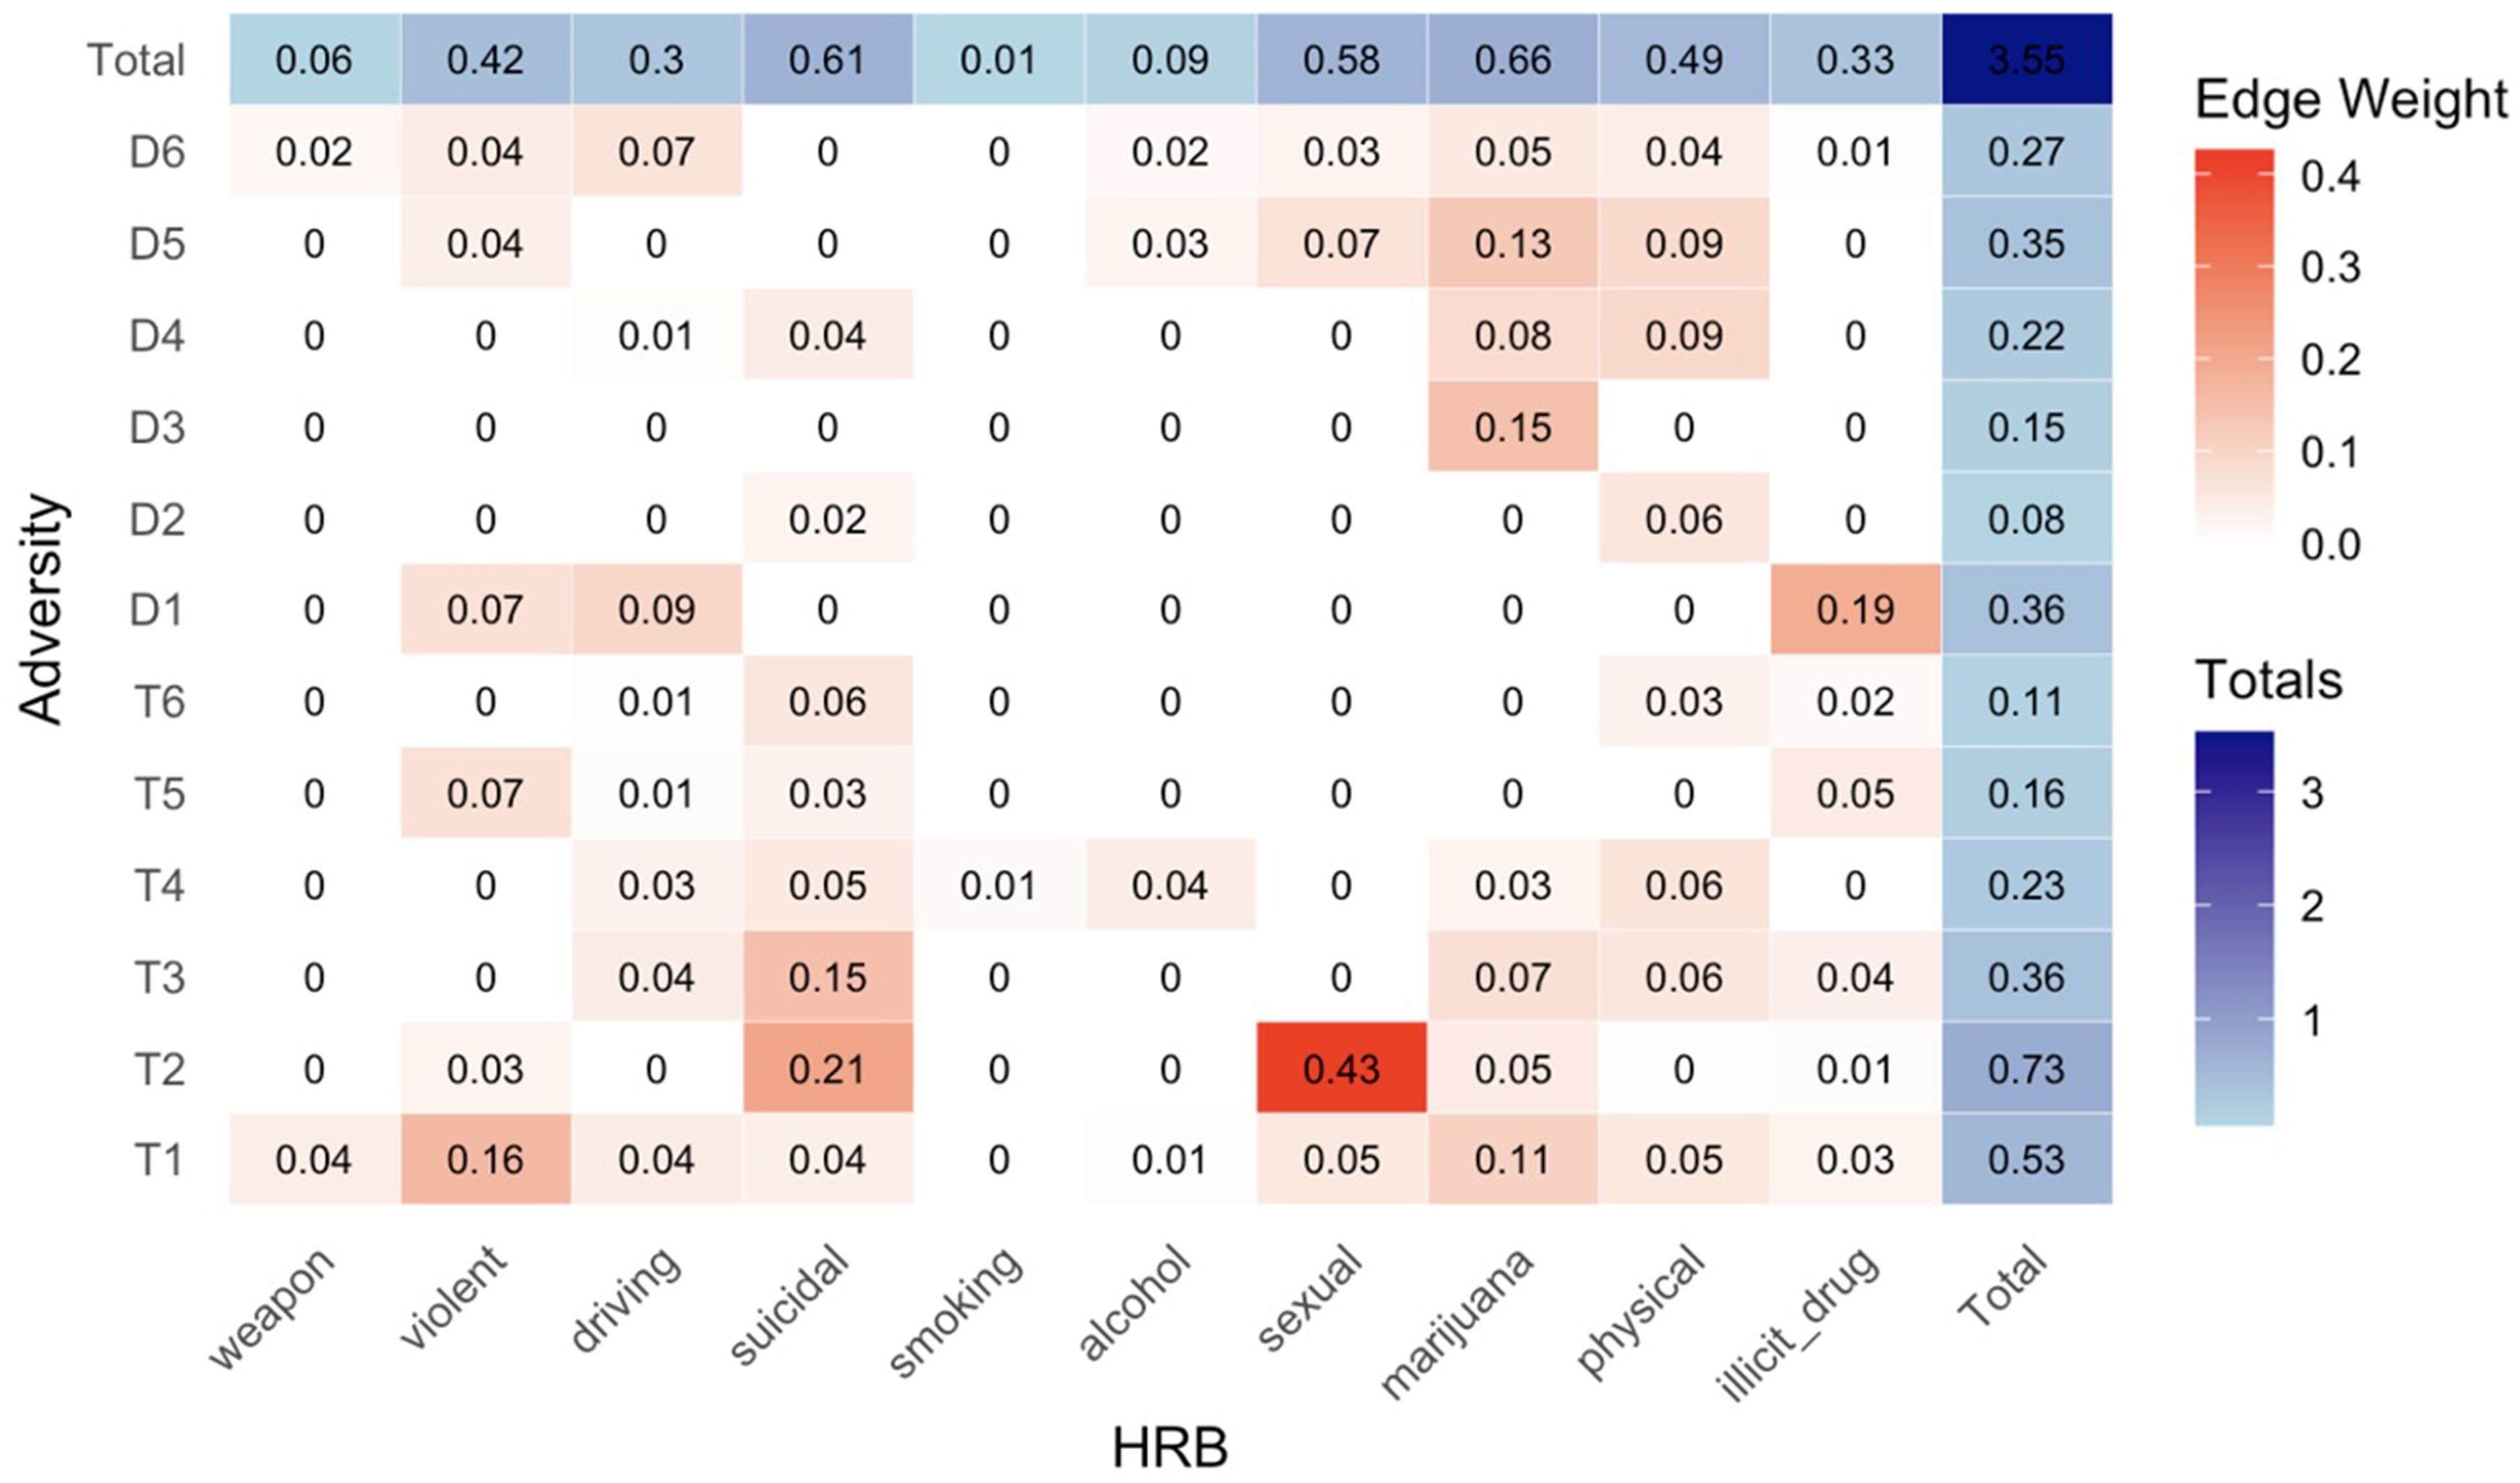
Figure 2. Heatmap of the strength of associations between adversities and health risk behaviors based on network edge weights. Edge weights, which indicate the strength of associations, were extracted from the network in Figure 1 for all adversity-HRB associations. Only edges that were deemed significant based on network regularization parameters are included, therefore even small edge weights reflect meaningful associations. Larger edge weight values reflect stronger associations and are shown by darker colors. Edge weights are also summed to reflect the total strength of each adversity. D1 = unstable housing; D2 = physical neglect; D3 = parent substance use; D4 = parent mental illness; D5 = parent incarceration; D6 = low parent monitoring; T1 = witness community violence; T2 = physically forced intercourse; T3 = sexual abuse; T4 = emotional abuse; T5 = physical abuse; T6 = witness domestic violence.
Network estimation
Networks were conducted in R studio (Version 4.4) using the Pairwise Markov Random Field (PMRF) model. PMRF is the standard approach for estimating undirected psychological network structures (Epskamp et al., Reference Epskamp, Borsboom and Fried2018). In this model, nodes represent variables, which are connected by undirected edges that represent conditional dependence between two variables (i.e., connections that cannot be explained by another variable in the network). We used the mixed graphical model (mgm) package for network modeling, which allows for inclusion of mixed data types, because the YRBS included a range of dichotomous, ordinal, and continuous data. The least absolute shrinkage and selection operator (LASSO) with Extended Bayesian Information Criterion (Chen & Chen, Reference Chen and Chen2008) was set at the default parameter of .25 to regularize the model. This limits false positive findings and produces a parsimonious model by omitting near-zero, spurious edge weights, so that all connections produced in the model represent meaningful associations. Networks were visualized using the qgraph package (Epskamp et al., Reference Epskamp, Cramer, Waldorp, Schmittmann and Borsboom2012). A series of networks were estimated to test the research questions in the present study. Interpretation of all networks followed the procedures outlined below.
Network visualization
The overall network structures were interpreted based on inference methods from graph theory (Newman, Reference Newman2010). Specifically, the presence of edges, which reflect conditional dependence between two variables (similar in interpretation as partial correlations), were examined to identify which adversity dimensions were associated with which HRBs. The strength of associations was determined by examining the edge thickness, with thicker edges indicate stronger associations, and quantitatively by extracting edge weights. Lastly, the closeness of nodes provides another indicator of association strength, with closer proximity in the network reflecting more highly related nodes. The accuracy and stability of edge weights was assessed through non-parametric bootstrapping using the bootnet package, which repeatedly estimates the model and edge weight statistics, and the correlation stability coefficient, which indicates the percent of our sample that can be dropped to maintain correlations of r = 0.7 between the edge weights of our sample and bootstrapped sample. We estimated 95% confidence intervals of all edge weights based on 1000 bootstrap samples (Epskamp et al., Reference Epskamp, Borsboom and Fried2018).
Centrality measures
Centrality measures are metrics that indicate the relative influence of individual nodes in networks. To test the hypothesis that associations between adversity and HRBs will be stronger for threat compared to deprivation, centrality measures were calculated for each adversity type and overall dimension. Specifically, strength centrality was calculated for threat and deprivation to compare the overall strength of the associations between each dimension and HRBs. Strength centrality is calculated as the sum of all edge weights of a node and identifies influential nodes in a network based on the total strength of its associations. To more directly answer our research question and isolate the impacts of adversities on HRBs, we adapted the strength centrality calculation to only include edge weights from adversity-HRB associations and did not include the edge weights within adversities (e.g., edge connecting physical abuse to emotional abuse) in our calculation. To identify which individual adversities exerted the strongest overall influence on HRBs in the network, strength centrality was calculated for each adversity. To compare the overall impact of each dimension on each type of HRBs in the network, we then calculated the total strength of threat and deprivation by summing the strength centrality of each adversity within that dimension. For instance, the total influence of threat on sexual behaviors was the sum of all edge weights that link each threat adversity node to the sexual risk behaviors. We also examined degree centrality, which identifies influential nodes based on their total number of connections with other nodes. This allowed us to identify how many types of HRBs, and which HRBs, were linked with each adversity dimension. As with strength centrality for individual adversities, we only included edges that reflected adversity-HRB associations in this calculation.
Community detection
A community detection algorithm, which identifies nodes that are highly interconnected (i.e., clusters) based on their relative association with other variables in the network, examined if adversities and HRBs aggregate into distinct clusters. Specifically, this allowed us to test if threat and deprivation emerged as separate clusters, which has been found in prior studies (Sheridan et al., Reference Sheridan, Shi, Miller, Salhi and McLaughlin2020). We used the walktrap function in the igraph package to conduct this analysis. Walktrap is a popular community detection algorithm for psychological networks (Hevey, Reference Hevey2018) that identifies clusters by simulating random walks throughout the network, with communities identified by shorter random walks (Pons & Latapy, Reference Pons and Latapy2006).
Sensitivity analysis
Given the lack of consensus regarding the appropriate classification of parental mental illness, substance use, and incarceration in dimensional models of adversity, we ran sensitivity analyses to examine the impact of each adversity dimension on HRBs with these items classified as threat (vs. deprivation in our main analyses). Centrality measures for each dimension were calculated following the same procedures described above.
Results
Frequencies of adversity exposure and HRB engagement in the sample are shown in Supplemental Table 2. The network of associations between individual adversities (labeled as threat or deprivation) and HRB composite scores is shown in Figure 1, with nodes reflecting variables and edges reflecting associations between pairs of nodes. Our network comprised ten HRB nodes, six threat nodes, and six deprivation nodes. All individual adversities were associated with at least one HRB, evidenced by the presence of edges connecting the two nodes. The strongest individual adversity-HRB associations (determined by edge weights) were between physically forced intercourse (threat) and sexual risk behaviors (.43), physically forced intercourse (threat) and suicidal behaviors (.21), lack of housing (deprivation) and illicit drug use (.19), community violence (threat) and violent behaviors (.16), and sexual abuse (threat) and suicidal behaviors (.15). The full list of edge weights is shown as a heatmap in Figure 2. Our network edge weights demonstrated adequate stability, evidenced by overall narrow confidence intervals from nonparametric bootstrapping (Supplemental Figure 1) and a correlation stability coefficient of 0.75 from case-dropping bootstrap results, exceeding the recommended threshold of .05 (Epskamp et al., Reference Epskamp, Borsboom and Fried2018). This suggests that our network edge weights are robust and interpretable.
Strength centrality identified which adversities exerted the strongest overall influence on HRBs in the network. Adversities with the strongest influence on HRBs based on their summed edge weights were physically forced intercourse (.73), community violence (.53), and sexual abuse (.36), all of which are threat items. Physical neglect (.08) and witnessing domestic violence (.15) had the weakest total edge strength. In terms of degree centrality, adversities that were associated with the greatest number of HRB categories (out of ten HRB categories) were community violence (n = 9 types of HRBs), low parent monitoring (n = 8), physically forced intercourse (n = 6) and emotional abuse (n = 6). These adversities were also located more centrally in the network compared to those with weaker degree centrality (e.g., parent substance abuse; n = 1 edge linked to HRB), highlighting the reach of their influence on network composition. See Figure 1 for total strength and the number of HRB associations for each adversity.
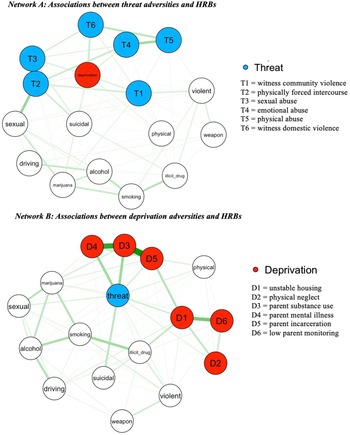
Distinct patterns in adversity-HRB associations by adversity dimension are more clearly observed in Figure 3, which isolates the associations in Figure 2 by each dimension. Network A modeled the associations between individual threat items and HRBs while controlling for overall deprivation, and Network B modeled deprivation-HRB associations while controlling for threat. The overall pattern of associations within HRBs did not differ substantially based on adversity dimension, such that HRB nodes retained similar connections and proximity to other HRBs in each network. However, there were observable differences in edge thickness (i.e., strength), number of edges connected to HRBs, and locations of adversity nodes in each network, indicating that adversity types were differentially linked to HRBs. For instance, the strength of associations with each type of HRB differed by network. Marijuana and illicit drug use were more strongly associated with deprivation adversities as indicated by thicker edges and closer proximity (Network B) compared to threat (Network A), whereas the opposite pattern was observed for sexual and violent behaviors. These networks also showed differences in the salience of each dimension. In Network A, some threat adversities were central to the network (physically forced intercourse, community violence), whereas deprivation adversities in Network B were consistently located at the perimeter (i.e., more distal from HRBs). This suggested that overall, threat adversities more strongly influenced HRBs and overall network composition than deprivation. Within each network, there were also differences in the influence of specific adversities. Witnessing domestic violence and physical abuse (Network A) and parental substance use and physical neglect (Network B), were the most peripheral nodes each network, indicating that these were less influential. These visual patterns were consistent with differences in edge weights noted above and in Figure 1.

Figure 3. Networks of the associations between individual adversities and health risk behaviors by adversity dimensions. Network A shows the links between threat adversities and HRBs while controlling for deprivation. Network B shows the links between deprivation adversities and HRBs while controlling for threat. In each network, threat nodes are blue, and deprivation nodes are red. Edges reflect partial associations between variables, with thicker edges indicating stronger associations.
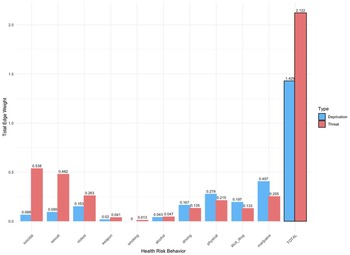
To further examine differences in HRBs by adversity dimension, we compared the overall influence of threat and deprivation on each HRB category. The total strength of each dimension (determined by the sum of edge weights of its adversities) on each HRB is shown in Figure 4. Threat was associated with all ten HRB composites and most strongly associated with sexual, suicidal, and violent behaviors. Deprivation was associated with nine HRB composites (all except smoking), and illicit drug use, physical health behaviors, and marijuana use were the three strongest associations. Overall, threat exerted a stronger total influence on HRBs in the network (2.1) compared to deprivation (1.4). When looking at specific HRBs, threat was more strongly associated with most (6 out of 10) HRBs than deprivation, including weapon carrying, violence, suicidal behaviors, smoking, alcohol use, and sexual risk behaviors. Conversely, deprivation was more strongly associated with risky driving, physical health behaviors, and marijuana and illicit drug use, compared to threat. Differences in degree centrality also revealed distinct patterns of adversity-HRB associations based on dimension. On average, threat-related adversities were associated with more HRBs (average of 5 edges per node) compared to deprivation (average of 4 edges).

Figure 4. Box plot comparing the strength of associations for threat and deprivation across each type of health risk behavior. Differences in the strength of associations are based on edge weights extracted from the network modeled in Figure 1. The strength of associations for each dimension with HRBs is plotted on the Y axis as total edge weight. Total edge weights were calculated as the sum of edge weights from all individual adversities within each dimension for each HRB category.
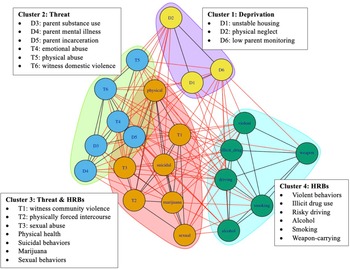
Lastly, a community detection algorithm examined if highly related variables aggregated into distinct clusters in the network (Figure 5). Four separate clusters emerged. Consistent with DMAP, we found that some indicators of threat and deprivation formed separate clusters. Cluster 1 (“deprivation cluster”) included three forms of deprivation: physical neglect, unstable housing, and low parent monitoring. Cluster 2 (“threat cluster”) included three threat items: parental physical abuse, emotional abuse, and witnessing domestic violence. Unexpectedly, the three other items we classified as deprivation – parent mental illness, substance use, and incarceration – were placed in the threat cluster. This suggested that these variables exhibited patterns in their associations with other variables in our networks that were more similar to these threat items than the other deprivation items. Cluster 3 included some HRBs (marijuana, physical health, suicidal behaviors, and sexual behaviors) and the remaining threat adversities (sexual abuse and community violence). Although these threat adversities were not grouped with the threat cluster, Cluster 3 (“threat & HRBs”) overlapped with Cluster 2 (“threat cluster”), indicating that these clusters were closely related. Moreover, their inclusion in a primarily HRB cluster pointed to the strength of their associations with HRBs, consistent with the findings described above. Cluster 4 (“HRBs”) was more distal and comprised the remaining HRBs: violence, risky driving, illicit drug use, weapon carrying, smoking, and alcohol use.

Figure 5. Community detection network of the associations between adversities and health risk behaviors. Clusters of highly related nodes in the network were identified using the walktrap algorithm. Distinct clusters that emerged based on their relative associations with other variables are shown by different colors. Edges reflect associations between variables, with black edges connecting two nodes in the same cluster, and red edges connecting nodes in different clusters. Cluster 1 includes three deprivation items, Cluster 2 includes three deprivation and three threat items, Cluster 3 includes three threat and four health risk behavior (HRB) items, and cluster 4 includes six HRB items.
Sensitivity analysis
Because of the possibility that parental mental illness, substance use, and incarceration variables reflected threat rather than deprivation adversities, the total strength of HRB associations by adversity dimension was tested with these adversity variables included as threat items rather than deprivation (Supplemental Figure 2). When these variables were classified as threat, the number of HRBs associated with each dimension remained the same (threat = 10, deprivation = 9), but the strength of associations changed. Specifically, the strength of threat-HRB associations in the network increased overall (2.8) and across each HRB. The number of HRBs that were more strongly linked to threat also increased to eight items out of ten, now including marijuana and physical health, which were previously more strongly linked to deprivation. These results were consistent with the particularly strong individual associations between these HRBs and the parental instability items as shown in Figure 1. Conversely, the influence of deprivation on the total network and individual HRB categories decreased, although driving behaviors and illicit drug use remained more strongly linked to deprivation. Overall, the results of the sensitivity analyses substantiated our main findings that threat exerted a stronger influence on HRBs and was linked to more HRBs than deprivation, and suggested that these effects were magnified when parental mental illness, substance use, and incarceration were classified as threat.
Discussion
This study applied DMAP to examine the associations between dimensions of adversity (threat and deprivation) and HRBs in a nationally representative sample of U.S. adolescents using a network analytic approach. As expected, we found that both threat and deprivation were associated with adolescent HRBs, and that these associations were somewhat stronger for threat compared to deprivation. Although each adversity dimension was associated with HRBs, threat was associated with more HRBs than deprivation and exerted an overall larger influence on HRBs in the network. We also found evidence that threat and deprivation are differentially associated with HRBs. Namely, physical health behaviors, risky driving, and marijuana and illicit drug use were more strongly associated with deprivation, whereas risky sexual behaviors, violence, suicidal behaviors, weapon-carrying, alcohol use, and smoking, were more strongly associated with threat. Our findings that both dimensions were associated with HRBs, and that the patterns of associations vary by dimension, are consistent with the theoretical foundation of DMAP. This study provides the first empirical evidence that the hypothesized distinct developmental pathways associated with threat and deprivation also extend to differences in adolescent HRB profiles.
Our network analyses elucidated differences in the strength and patterns of adversity-HRB associations, revealing which adversities are most linked to HRB engagement. For instance, forced physical intercourse exerted the strongest overall influence on HRBs, and its associations with sexual risk and suicidal behaviors were the strongest individual adversity-HRB edges in the network. Sexual abuse is a high severity threat (McLaughlin & Sheridan, Reference McLaughlin and Sheridan2016) with consistently worse health outcomes than other adversities (Noll, Reference Noll2021). The potency of forced intercourse in our network is consistent with findings that sexual abuse exerts a greater impact on HRBs than other adversities (Diedrick et al., Reference Diedrick, Clements-Nolle, Anderson and Yang2023), particularly for suicidal (Molnar et al., Reference Molnar, Berkman and Buka2001) and sexual behaviors (Fergusson et al., Reference Fergusson, Horwood and Lynskey1997), and aligns with findings that the negative sequelae of sexual abuse are worse when such abuse involves penetration (Molnar et al., Reference Molnar, Berkman and Buka2001). Scholars have argued that the uniquely strong effects of sexual abuse may be due to its compounding mechanisms, including those shared with other adversities (e.g., neurobiological alterations due to repeated, prolonged stress) and those specific to sexual abuse (e.g., traumatic sexualization, betrayal, powerlessness, and stigmatization) (Finkelhor & Browne, Reference Finkelhor and Browne1985; Noll, Reference Noll2021).
Witnessing community violence emerged as another influential adversity and was associated with the most HRBs (9 out of 10) compared to any other adversity in the network. This elucidates the particularly far-reaching impacts of community violence and is consistent with research that demonstrates its ripple effects on physical, mental health, and general functioning outcomes (Overstreet, Reference Overstreet2000). This is an important finding that may partially explain the pathways toward health inequities among youth in low-income, minoritized communities, who face alarmingly high rates of community violence (up to 97%; McDonald et al., Reference McDonald, Deatrick, Kassam-Adams and Richmond2011) yet have disproportionately low access to mental health services (Pumariega et al., Reference Pumariega, Jo, Beck and Rahmani2022). Taken together, the particularly strong impacts of forced physical intercourse and community violence on HRB engagement underscore the public health urgency of strategies that promote recovery for affected youth. Early detection, strengthening protective factors that buffer the effects of adversity, and increasing access to evidence-based trauma-focused treatments can mitigate the lifelong health consequences of adolescent HRBs and promote health equity.
This study is among the first to extend DMAP to investigate HRBs by adversity dimension. First, we found that both dimensions were associated with a range of HRBs. We also found that threat exerted a somewhat stronger influence on HRB associations than deprivation. Threat-related adversities generally had more connections to HRBs, stronger associations, and the total influence of threat on HRBs in the network was greater than deprivation. This aligns with a recent meta-analysis by Lee and colleagues (2024), which found that the links between adversity and psychopathology were also stronger for threat compared to deprivation. These findings converge to suggest that the disruption of socio-emotional development associated with threat may exert more potent impacts on health-related outcomes, including adolescent HRBs, when compared with deprivation. Second, we found that threat and deprivation were differentially associated with specific HRBs. Although we did not test the developmental mechanisms that underlie these differences, the patterns of HRB associations observed based on adversity dimension align with expected outcomes based on the developmental pathways outlined by DMAP, and provide some evidence that the proposed mechanisms linking adversity to HRBs (i.e., emotion regulation, emotional reactivity, reward responsivity, delay discounting; Duffy et al., Reference Duffy, McLaughlin and Green2018) may differ by dimension. Specifically, our network found that threat exerted stronger influence than deprivation on HRBs that be driven by alterations in socio-emotional processing (e.g., heightened threat detection, higher emotional reactivity), including violence, sexual risk behaviors, and weapon-carrying. Conversely, deprivation exerted stronger influence than threat on HRBs that result from alterations in cognitive control and reward processes (e.g., blunted reward responsivity and enhanced reward seeking), including illicit drug use, physical health behaviors (e.g., low physical activity, high soda consumption), and injurious driving behaviors (e.g., drinking and driving). This aligns with recent work testing health-related outcomes by adversity dimension, which found deprivation was linked with health problems and threat linked to aggression (Usacheva et al., Reference Usacheva, Choe, Liu, Timmer and Belsky2022). Overall, our findings provide some of the first empirical evidence that DMAP may extend to explain adolescent HRBs, though future research that directly tests underlying mechanisms is needed. The distinct patterns in HRBs hold implications for improving our understanding of mechanisms linking adversity to adolescent HRBs and subsequently, our ability to predict health trajectories for adversity-exposed youth. Understanding which youth may be most likely to engage in which HRBs can inform person-centered preventative interventions that directly target these pathways.
Although some threat and deprivation items clustered by dimension, offering partial support for distinct HRB profiles, not all adversities aggregated with their expected dimension. For instance, sexual abuse and community violence clustered with HRBs rather than other threat items, and parental instability items (parent mental illness, substance use, and incarceration) clustered with threat rather than deprivation. There are several possible explanations for these findings. First, threat and deprivation were associated with mostly the same HRBs in the network. The presence of HRBs did not dramatically differ across dimension (e.g., threat was associated with 10 HRBs, deprivation was associated with 9), but rather, we identified nuanced differences in the magnitude of associations. Given the overlap of HRBs across adversities, these differences may not have been large enough to warrant separate clusters in the data. Although Sheridan and colleagues (Reference Sheridan, Shi, Miller, Salhi and McLaughlin2020) found two threat and deprivation clusters emerged as expected, their network plotted adversities with developmental outcomes. Both findings are consistent with DMAP, which argues that while disparate developmental pathways emerge for threat and deprivation, both pathways may ultimately lead to shared health outcomes. Thus, it is reasonable that our network of downstream HRBs did not demonstrate entirely separate groups. Second, the clustering of sexual abuse and community violence with other HRBs rather than threat items offers further evidence of the potency of these specific adversities. The sizable overlap between these two clusters shown in Figure 5 highlights that these adversities were still closely related to the other threat adversities. As described above, sexual abuse and community violence exerted the strongest impacts on HRBs. Thus, the magnitude of their associations with HRBs may have been substantially greater than with the other threat adversities, warranting grouping with HRBs instead.
The clustering of parent instability items (mental illness, substance use, and incarceration) with family violence (physical and emotional abuse and witnessing domestic violence) items in the threat cluster is noteworthy. Although we considered parental instability items as proxies of deprivation based on precedents in prior studies (e.g., Henry et al., Reference Henry, Gracey, Shaffer, Ebert, Kuhn, Watson, Gruhn, Vreeland, Siciliano, Dickey, Lawson, Broll, Cole and Compas2021), there is a lack of consensus surrounding the most accurate categorization of such adversities in dimensional models and our findings suggest that deprivation may not be an accurate conceptualization. This is understandable given that parental mental illness, substance use, and incarceration do not directly reflect an absence of environmental input – the core feature of deprivation, whereas physical neglect, lack of housing, and low parental monitoring are prototypical deprivation experiences and formed a deprivation cluster as expected. The clustering of parent mental illness, substance use, and incarceration with physical and emotional abuse and witnessing domestic violence may also reflect the strong links between parental instability and family violence that are established in the literature (Stith et al., Reference Stith, Liu, Davies, Boykin, Alder, Harris, Som, McPherson and Dees2009). Ultimately, adversities that reflect parental instability may be better understood as risk factors for other forms of adversity (in our network, primarily threat), whose mechanisms are better established.
It is also plausible that parental instability items may reflect a third adversity dimension not tested in this study. Ellis and colleagues (2022) recently extended DMAP to propose a three-dimension model of adversity that comprises threat, deprivation, and unpredictability, defined as fluctuations in environmental cues related to morbidity-morality risk (Ellis et al., Reference Ellis, Figueredo, Brumbach and Schlomer2009). Although the role of unpredictability in a dimensional framework of adversity has not yet been clearly established (Ellis et al., Reference Ellis, Sheridan, Belsky and McLaughlin2022), there is some evidence that unpredictability may comprise a third dimension with its own direct impacts on developmental and health outcomes. For instance, Usacheva and colleagues (2022) found that unpredictability (including changes in household composition and irregular parenting) was linked to substance use and sexual risk-taking. Similarly, parent mental illness, substance use, and incarceration were most closely located with marijuana and sexual risk behaviors in our network (Figure 1, Network B). Unpredictability is also posited to overlap with threat-related outcomes, including emotion regulation difficulties and sexual risk-taking (Ellis et al., Reference Ellis, Sheridan, Belsky and McLaughlin2022), which could explain the grouping of these adversities with threat rather than deprivation in our network. Ellis and colleagues (2022) also proposed that unpredictability may function as a modulator of other adversities, such that the impacts of threat and deprivation may vary based on their predictability. Our network offers some support for this idea as well. Parent mental illness, substance use, and incarceration were located peripherally in the network, which suggests their overall influence on network composition was weak. Their strongest associations were with other threat and deprivation adversities, which were more central and directly linked to HRBs. Overall, our results indicate that the developmental sequelae of parental instability items warrant further examination to accurately categorize these experiences in dimensional models of adversity.
Strengths and limitations
This study fills several important gaps in the literature. Although there is robust empirical support for the associations between childhood adversity and adolescent HRBs, findings regarding the co-occurring nature of adversity and HRBs have been less consistent. Our novel network analytic approach, selection of a nationally representative dataset, and inclusion of comprehensive adversity and HRB indicators, allowed us to parse apart the idiographic impacts of adversities on health behaviors and more accurately examine youth’s real-world experiences by accounting for their co-occurrence. The HRBs in our network also allowed us to examine the impacts of adversity beyond developmentally adaptive adolescent risk-taking to identify behaviors that signal serious risk for negative health outcomes. Lastly, our network extends the cumulative risk/sum-score approaches by retaining Likert-scale items that capture important information related to chronicity and severity of adversities and HRBs.
There are several limitations of note in our study. The associations described between adversities and HRBs do not reflect causality because of our use of cross-sectional data. Prospective longitudinal studies are needed to determine causal effects. We also excluded many YRBS participants from our final sample due to the need for complete data in network modeling. Although our sample was large, removal of cases may have impacted network results, and replication is needed to further support the associations we identified. Although we found differences in HRBs across threat and deprivation, we did not test the developmental mechanisms that may explain these differences. To strengthen support for the utility of DMAP in predicting HRBs, future studies should examine if the mechanisms underlying HRB engagement differ by adversity dimension. There are also limitations in our measurement of adversity. We did not have information on important features of adversities (e.g., developmental timing), the binary measures masked chronicity and severity of some experiences, and some variables were imperfect indicators of dimensions. For instance, we included low parental monitoring as deprivation because this experience removes opportunities for caregivers to provide expectable input and therefore is consistent with how indicators of deprivation are defined (Ellis et al., Reference Ellis, Sheridan, Belsky and McLaughlin2022), but we acknowledge that low parental monitoring may also be a function of other factors such as the child’s behavior. The clustering of low parental monitoring with other deprivation indicators suggested that its inclusion was appropriate, but future studies should include a more comprehensive assessment of adversities, particularly those closely aligned with conceptualizations of threat and deprivation, to accurately predict outcomes. Lastly, although our network demonstrated adequate stability, bootstrapping results showed that some edge weights had overlapping confidence intervals (Supplemental Figure 1), suggesting that they may not be statistically different from each other. Replication studies are needed to confirm the relative strength of our observed associations.
Conclusion
Childhood adversity is associated with engagement in HRBs during adolescence, which contribute to leading causes of death and disability throughout the lifespan. This network analysis advances the field of childhood adversity as one of the first studies to empirically test the associations between adversities and HRBs using a dimensional approach. Both threat and deprivation were each associated with a range of HRBs, and differences in HRB associations by dimension emerged consistent with the distinct developmental mechanisms proposed by DMAP. By elucidating which youth may be at greatest risk for specific HRB, these findings could lay the foundation for the development of tailored early interventions designed to interrupt the pathways through which adversity dimensions are linked with poor health outcomes. This work holds the potential to improve lifelong trajectories for youth exposed to adversity and transform public health.
Supplementary material
The supplementary material for this article can be found at https://doi.org/10.1017/S0954579425101053.
Data availability
The authors have adhered to all TOP guidelines. The data and materials used in this study are publicly available at the Center for Disease Control and Prevention Youth Risk Behavior Survey website (https://www.cdc.gov/yrbs/data/index.html). The code necessary to reproduce the analyses presented here is available on OSF.
Funding statement
This research received no specific grant from any funding agency, commercial or not-for-profit sectors.
Competing interests
The author(s) declare none.
Pre-registration
This study and planned analyses were preregistered on September 2nd, 2024, before the data were made publicly available on September 29th, 2024. Preregistration for this research is available on OSF at the following URL: https://osf.io/krejc/
AI
No artificial intelligence (AI) tools were used.


 Open access