


Highlights
-
Abnormalities of functional connectivity in the sensory olfactory network are present in both Parkinson’s disease patients and in REM sleep behavior disorder patients.
-
Alterations in functional connectivity are similar between Parkinson’s disease and REM sleep behavior disorder patients.
-
Alterations in functional connectivity are correlated with changes in olfactory identification ability.
Introduction
Parkinson’s disease (PD) has become a leading cause of disability worldwide, Reference Feigin, Nichols and Alam1 and with demographic changes, including increased longevity, the prevalence of PD is increasing, Reference Dorsey, Sherer, Okun and Bloem2 so too is the incidence. Reference Willis, Roberts and Beck3 At present, a diagnosis of PD is reliant upon the presence of motor symptoms of bradykinesia with tremor or rigidity. Reference Postuma, Berg and Stern4 Although there are no definitive methods for identifying those at risk for developing PD, numerous preclinical markers are showing promise. Reference Berg, Postuma and Adler5
In their seminal report, Braak and colleagues Reference Braak, Ghebremedhin, Rüb, Bratzke and Del Tredici6 demonstrated that changes occurred in the substantia nigra only later in the disease course, long after inclusion bodies were found in the olfactory bulbs and the dorsal motor nucleus of the vagus nerve. These findings suggested that the diagnosis of PD occurs at a later stage of disease progression. However, newer models of PD pathogenesis (alpha-Synuclein Origin and Connectome [SOC] model) suggest two separate pathways of disease onset: one in which the pathology originates from the enteric nervous system (“body-first”) and the other in which initial pathology originates from the central nervous system (“brain-first”). According to this latter model, pathology propagates asymmetrically (brain-first) or symmetrically (body-first) depending on the site of disease onset. Reference Borghammer and Van Den Berge7
Olfactory dysfunction (hyposmia) is present in over 90% of patients with PD Reference Haehner, Boesveldt and Berendse8 and occurs years prior to the onset of motor symptoms. Reference Ross, Petrovich and Abbott9 Recently, hyposmia has been included as a defining feature in the Movement Disorder Society Clinical Diagnostic Criteria for Parkinson’s disease and provides information regarding differential diagnosis. Reference Postuma, Berg and Stern4
A further promising avenue to explore preclinical PD has been idiopathic REM sleep behavior disorder (iRBD), Reference Iranzo, Fernández-Arcos and Tolosa10,Reference Postuma, Gagnon, Vendette, Fantini, Massicotte-Marquez and Montplaisir11 a parasomnia involving dream enactment and failure to maintain muscle atonia during REM sleep. Currently, iRBD is one of the best prodromal markers of alpha synucleinopathies, with approximately 95% of iRBD patients eventually developing a synucleinopathy, Reference Galbiati, Verga, Giora, Zucconi and Ferini-Strambi12 and is included as a significant risk factor in the Movement Disorder Society (MDS) criteria. Reference Berg, Postuma and Adler5 Of those transitioning, PD is noted in 45%. Reference Iranzo, Santamaria and Tolosa13 According to the SOC model, Reference Borghammer14 iRBD is more common in the body-first subtype of PD, given the prion-like propagation from the gut through the brainstem. Interestingly, olfactory dysfunction has also been noted in iRBD patients. Reference Iranzo, Serradell and Vilaseca15 Moreover, in patients with iRBD, the severity of olfactory dysfunction has been shown to be predictive of conversion to PD. Reference Mahlknecht, Iranzo and Högl16 Nevertheless, at present, much remains unknown regarding the underlying mechanisms of olfactory dysfunction involved in iRBD.
In recent years, there has been increased focus on examining the MRI blood-oxygen-level–dependent (BOLD) signal while the brain is not engaged in an explicit task. Reference Lv, Wang and Tong17 Functional connectivity (FC), or the correlated activity between spatially separate brain regions, Reference Smitha, Akhil Raja and Arun18 has been examined in PD patients. Abnormalities in specific functional networks, including those that incorporate important olfactory brain regions, have been demonstrated. Reference Fan, Li and Li19,Reference Georgiopoulos, Witt and Haller20 In contrast, FC studies in iRBD are limited, particularly with respect to olfactory regions.
Using the extensive resting-state functional MRI (rs-fMRI) data sets from the Human Connectome Project (HCP) and graph theory modularity analysis, Arnold and colleagues Reference Arnold, You, Ding, Zuo, de Araujo and Li21 identified 22 regions known to be associated with olfactory processing and demonstrated the existence of 3 highly specialized olfactory networks: sensory, limbic and frontal. Of particular interest was the sensory olfactory subnetwork (SOS), due to its perceived involvement in processing basic sensory olfactory information. Reference Arnold, You, Ding, Zuo, de Araujo and Li21 Meta-analytic evidence of primary olfactory processing abnormalities has been demonstrated in PD, Reference Rahayel, Frasnelli and Joubert22 and this subnetwork appeared to be a promising area to explore the functional underpinnings of hyposmia in early PD and in iRBD.
The current study aimed to evaluate the integrity of this SOS in PD and iRBD. We aimed to accomplish this through collecting rs-fMRI data and examining FC between regions of interest (ROI) in PD, iRBD and healthy participants. Our first aim was to replicate the FC findings in the SOS from the Arnold et al. Reference Arnold, You, Ding, Zuo, de Araujo and Li21 data (see below for the ROIs used) in a sample of healthy participants (HC). Thereafter, we wished to compare our sample of healthy participants with our PD and iRBD patients. Our third aim was to determine whether there were differences in FC between PD and iRBD groups using planned contrasts. We hypothesized that resting-state FC in both PD and iRBD groups would differ from that of HCs. An exploratory analysis examined whether connectivity in the PD and iRBD differed at any of the significant olfactory functional connections. Should both PD and iRBD have similar connectivity abnormalities compared to control subjects, this may provide a further biomarker to identify those at risk of developing PD.
Our hope is that the present study can address the current knowledge gaps in iRBD and contribute to the search for preclinical biomarkers of PD. Preclinical identification of those at risk for PD is valuable for eventual neuroprotective intervention.
Methods
Participants
iRBD
Patients with iRBD were recruited from Sleep Disorders Clinics in Halifax, Nova Scotia, Canada. Diagnosis of iRBD was established based on International Classification of Sleep Disorders, 3rd edition diagnostic criteria, with polysomnographic confirmation of loss of REM atonia (sleep neurologist GP). iRBD participants could not meet the criteria for PD.
PD
Patients with early-stage PD were recruited through the Movement Disorders Clinic also located in Halifax, Nova Scotia, Canada. PD participants required the following: prior diagnosis by a movement disorder specialist (KS), Hoehn and Yahr Reference Hoehn and Yahr23 score less than 2.5 and assessment using the Unified Parkinson Disease Rating Scale Part III Motor Score (UPDRS-III Reference Goetz, Fahn and Martinez-Martin24 ). All patients had to be L-Dopa responsive for inclusion in the study.
Healthy controls
Lastly, participants in the healthy control group (HC) were recruited through advertisements in local hospitals, universities and online (via social media). Inclusion in the HC group was dependent on the absence of an iRBD or PD diagnosis and the presence of normal olfactory perception, defined as a minimum score greater than 30/40 on the University of Pennsylvania Smell Identification Test (UPSIT Reference Doty, Shaman and Dann25 ; see below).
Participants in all three groups were subjected to general exclusion criteria, which included alternative causes for olfactory deficits and contraindications to MRI such as metallic foreign bodies and claustrophobia. As the average age at diagnosis for iRBD is younger than PD, we were unable to directly age-match participants. Nevertheless, we attempted to ensure that age and sex distribution were similar across groups. Research participants were excluded if they were diagnosed with dementia or any psychiatric disorder (e.g., bipolar disorder, schizophrenia).
Measures
The UPSIT is a validated assessment of olfactory identification ability commonly employed in studies of olfaction. Reference Doty, Shaman and Dann25 It is a 40-item “scratch and sniff” test, where participants must determine which multiple-choice option best matches the odor. Ample standardization data is available for evaluation of the degree of deficit across the lifespan. Reference Doty, Shaman and Dann25
Regions of interest (ROIs)
The ROIs included in our study were based on regions purported to be within the SOS. In the paper by Arnold et al., 2020, the investigators observed a significant signal dropout in the left hemisphere near air-tissue interfaces. Moreover, since the olfactory system is predominantly ipsilateral, and olfactory processing tends to be strongly right hemisphere dominant, they opted to only examine olfactory regions within the right hemisphere. Reference Arnold, You, Ding, Zuo, de Araujo and Li21 Consequently, we followed their methodology and only reported on regions within the right hemisphere. Our ROIs (Figure 1) included the right anterior piriform cortex (APC), right dorsal insular cortex (INSd), right ventral insular cortex (INSv), right posterior insular cortex (INSp) and right ventral posterior thalamus (THLvp). Due to our larger voxel size, we were forced to exclude the posterior piriform cortex as it overlapped significantly with our APC seed region.

Figure 1. Sensory olfactory subnetwork regions of interest (ROI) coordinates. Note: Coordinates used were from Reference Arnold, You, Ding, Zuo, de Araujo and Li21 . All coordinates are based on the MNI 152 atlas. *APC = anterior piriform cortex; INSd = dorsal insular cortex; INSv = ventral insular cortex; INSp = posterior insular cortex; THLvp= ventral posterior thalamus.
Rs-fMRI
Image acquisition
All scans were obtained using a 1.5 T GE Signa HDx with an eight-channel head–neck–spine coil. Anatomical data was acquired using an axial 3D T1-weighted FSPGR BRAVO sequence with the following parameters: TR = 11.8 ms, TE = 4.7 ms, acquisition matrix = 224 × 224, reconstruction matrix = 512 × 512, FOV = 224 mm, voxel size = 0.4375 × 0.4375 × 1 mm, slice thickness = 1.0, slice gap = 0 mm, slices = 190, volumes = 1, NEX = 1, flip angle = 12° and total acquisition time = 5:05 min. Rs-fMRI BOLD data was acquired using a 2D axial gradient echo planar imaging sequence with the following parameters: TR = 2.0 s, TE = 25 ms, matrix = 64 × 64, FOV = 240, voxel size = 3.75 × 3.75 × 3.7 mm, slice thickness = 3.7 mm, slice gap = 0 mm, slices = 34, volumes = 6120, NEX = 1, flip angle = 90° and total acquisition time = 6:10 min. Participants were instructed to keep their eyes open and fixed, attempt to relax and not think of anything specific during the scan.
Preprocessing
Anatomic and functional data was converted from DICOM to NIFTI using DCM2NIIX (Li et al., 2016) and organized into BIDS version 1.4.0 format. Preprocessing was completed using fMRIPrep version 20.2.3.
Anatomical T1-weighted images were corrected for intensity nonuniformity, used to generate a T1w-reference and subsequently skull-stripped. Brain tissue segmentation and masking of CSF, white matter and gray matter were performed on the brain-extracted reference. Brain surfaces were reconstructed, and the reference was spatially normalized to MNI152 through nonlinear registration.
Preprocessing of functional data relied upon a custom methodology of fMRIPrep to generate both a BOLD reference volume and a skull-stripped version. The BOLD skull-stripped reference was then co-registered to the T1w reference using bbregister (FreeSurfer), which implements boundary-based registration. Reference Greve and Fischl26 Head-motion correction was conducted using mcflirt (FSL 5.0.9 Reference Jenkinson, Bannister, Brady and Smith27 ), and BOLD runs were slice-time corrected using 3dTshift from AFNI 20160207. Reference Cox and Hyde28 The BOLD time series were resampled onto their original, native space by applying a composite transform to correct for head-motion and susceptibility distortions (referred to as preprocessed BOLD). In addition, the BOLD time series were resampled into standard space, generating a preprocessed BOLD run in MNI152 space. Several confounding time series were calculated based on the preprocessed BOLD: framewise displacement (FD), DVARS and three region-wise global signals (white matter (WM) signal, CSF signal and global signal). FD was computed using two formulations following Power (absolute sum of relative motions Reference Power, Mitra, Laumann, Snyder, Schlaggar and Petersen29 ) and Jenkinson (relative root mean square displacement between affines Reference Jenkinson, Bannister, Brady and Smith27 ). The head-motion estimates calculated in the correction step were also placed within the corresponding confounds file. Frames that exceeded a threshold of 0.5 mm FD or 1.5 standardized DVARS were annotated as motion outliers.
Functional connectivity analysis
FC analysis was conducted with a custom program written in Python using the Nilearn Library. Each functional image used simple confound regression signals (WM, CSF, GS, rot_x, rot_y, rot_z, trans_x, trans_y, trans_z, FD). In addition, a basic scrubbing method was used to censor volumes where FD >0.3 or standardized_DVARS>1.2.
To ensure the inclusion of only high-quality runs, we planned to exclude runs where total censoring was greater than 20% (i.e., 36 volumes), but ultimately, no runs were excluded. Correlations were calculated on cleaned fMRI runs, and all ROI-to-ROI values were reported to a .csv file for group-level statistical analysis. Run-average matrix and glass-brain plots were generated on the non-excluded data, collapsed across runs for the seed ROIs and are only for visualization.
Procedure
Telephone interviews were conducted with those who expressed interest in participating. During their first visit, informed consent was obtained. Moreover, relevant medical history information (including ensuring no MRI contraindications) was obtained. During this visit, they also performed the UPSIT administered by our researchers. If all inclusion criteria for their respective group were met, they were scheduled for an MRI the following week. During the scan, both structural and functional images of the brain were captured, while patients lay supine and awake with eyes closed.
Statistical analysis
FC correlations were subjected to planned a priori orthogonal contrasts based on our questions of interest, with the first contrast being HC vs the combined group of iRBD and PD and the second contrast being iRBD vs PD. Given that this is an exploratory study, we kept our significance level at 0.05 (uncorrected). For UPSIT scores, an ANCOVA was performed with age as a covariate; Tukey’s HSD test was used to examine the group differences. Chi-squared tests were completed to examine nonparametric data (e.g., sex). For all comparisons, statistical significance was set at p < 0.05.
Results
Demographic data
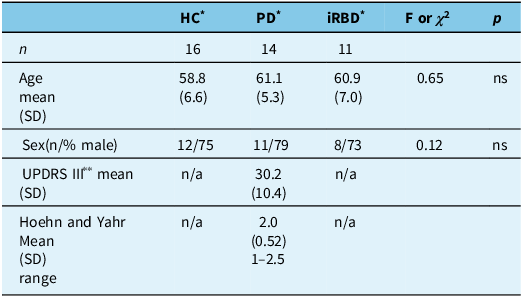
Forty-one participants were included in this study. Healthy controls (n = 16) had a mean age of 58.8 (SD = 6.6) years, and 75% were male. iRBD participants (n = 11) had a mean age of 60.9 (SD = 7.0) years, and 73% were male. PD participants (n = 14) had a mean age of 61.1 (SD = 5.4) years and a mean UPDRS III motor score of 30.2 (SD = 10.4), and 79% were male. No significant differences were noted in age (F(2,38) = 0.65, p = 0.53) or sex (X2 (2) = 0.12, p = ns) among the three groups. Please see Table 1.
Table 1. Demographic and disease-related data for all three participant groups

* HC = healthy control subjects; PD = Parkinson’s disease patients; iRBD = idiopathic REM sleep behavior disorder patients.
** UPDRS III = Unified Parkinson’s Disease Rating Scale – motor subscale.
Olfactory performance
Across the three groups, UPSIT scores differed significantly (F (2,37) = 30.4, p < 0.001); age, as a covariate, was also significant (F(1,37) = 5.0, p < 0.031). Tukey’s post hoc test revealed significantly lower scores in both the iRBD group and the PD group relative to the HCs. No significant difference in UPSIT scores was identified between the iRBD and PD groups (Figure 2).

Figure 2. Mean UPSIT score by participant group. *p < 0.001. **HC = healthy controls; PD = Parkinson’s disease patients; iRBD = idiopathic REM sleep behavior disorder; UPSIT = University of Pennsylvania Smell Identification Test.
Behavior disorder patients
Our first aim was to replicate the Arnold et al.Reference Arnold, You, Ding, Zuo, de Araujo and Li21 SOS connections in our healthy participant data. We examined the FC matrices of our data. Our highest correlation was between the INSv and INSd (0.38). Our next highest correlation included the connection between the INSv and INSp (0.29) followed by INSv and APC (0.28), INSp and INSd (0.25) and INSp and APC (0.23). The correlations of any of the SOS brain regions and the thalamus (THLvp) were negligible (range −0.14 to −0.03) (see Figure 3a). The pattern of strength of association was similar to what has been published. Reference Arnold, You, Ding, Zuo, de Araujo and Li21

Figure 3. Significant Pearson correlations between UPSIT score and the regions of interest connections*. *INSv = ventral insular cortex; INSp = posterior insular cortex; THLvp = ventral posterior thalamus; UPSIT = University of Pennsylvania Smell Identification Test.
Resting-state functional connectivity analysis
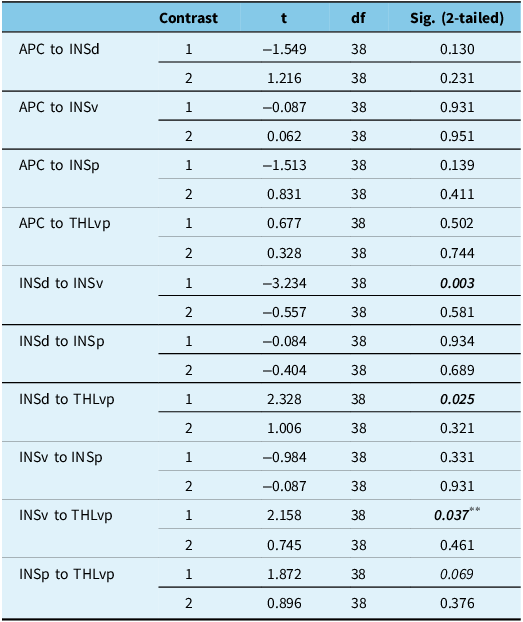
As demonstrated in Table 2, in the combined group (iRBD+PD), FC was significantly lower than that of the HC group between the INSd and INSv (t (38) = 3.2, p = 0.003). Moreover, combined group connectivity was found to be significantly higher between INSd and THLvp (t (38) = 2.3, p = 0.025) and INSv and THLvp (t (38) = 2.2, p = 0.037) when compared to HCs. When compared to each other, the iRBD and PD groups did not differ significantly in FC between any of the seed regions. Across all three groups, UPSIT scores were significantly and negatively correlated with FC in INSv to THLvp (r = −0.33, p < 0.04) and INSp to THLvp (r = −0.34, p < 0.03) (Figure 3). No other correlations between UPSIT and functional connections reached statistical significance. See Figure 4 for correlation matrices for the three subject groups.

Figure 4. Correlation matrix across all brain regions within the sensory olfactory subnetwork* for (a) healthy participants, (b) Parkinson’s disease patients and (c) iRBD patients. *APC = anterior piriform cortex; INSd = dorsal insular cortex; INSv = ventral insular cortex; INSp = posterior insular cortex; THLvp = ventral posterior thalamus.
Table 2. Paired contrasts for each connection *

Note: Significant values are bolded and italicized.
First contrast: HC vs PD and iRBD; second contrast: PD vs iRBD.
** Nonsignificant when motion outliers were removed from the dataset.
* APC = anterior piriform cortex; INSd = dorsal insular cortex; INSv = ventral insular cortex; INSp = posterior insular cortex; and THLvp = ventral posterior thalamus.
As motion has a significant impact on FC, we removed all participants who had the greatest amount of movement (two iRBD patients). We performed all analyses anew. The same pattern of findings was observed, with the exception that the INSv to THLvp was no longer significant (contrast 1 PD + iRBD vs HC; p < 0.06).
Discussion
In the present study, we were able to replicate similar patterns of the degree of correlations between the connections in the SOS of our healthy participants as derived from the Arnold et al. Reference Arnold, You, Ding, Zuo, de Araujo and Li21 study. We demonstrated olfactory processing deficits in iRBD and early PD and also found that PD and iRBD patients had reduced connectivity in some of the SOS connections and greater connectivity in others when compared to controls. PD and iRBD patients appeared similar in both olfactory processing and in the FC of the SOS. Our findings represented new insights into the similarities of early PD and iRBD patients. This data suggests that most of our idiopathic iRBD will convert to iRBD with PD over time and the combination of iRBD and olfactory deficits may be more potent preclinical indicators of PD than either finding alone.
Replication of the SOS connections
When compared to the original article, Reference Arnold, You, Ding, Zuo, de Araujo and Li21 we found FC patterns that were similar in our healthy participant group. In that paper, the strongest correlations were found between the subregions of the insula (dorsal, ventral and posterior). This finding was replicated in our data. The strongest numeric correlation found in our data was between the INSd and INSv, a finding that is identical to that noted in the original article. Reference Arnold, You, Ding, Zuo, de Araujo and Li21 Correlations between the APC and subregions of the insula also mirrored what was previously published. We found negligible correlations in our healthy control subjects between the ventral thalamus and other regions, while these correlations appeared to be stronger in the HCP data and in their replication data. Reference Arnold, You, Ding, Zuo, de Araujo and Li21
iRBD+PD vs HC
In alignment with our a priori hypothesis, we found that iRBD and PD patients, when compared to HC, exhibited poorer olfactory performance and altered FC in the SOS. These findings were consistent with the existing literature demonstrating olfactory deficits in both conditions and FC changes in olfactory regions in PD. Reference Mahlknecht, Iranzo and Högl16,Reference Tessitore, Cirillo and De Micco30 Given the SOS’s proposed function in basic olfaction, the disruption in connectivity may suggest a disruption of basic olfactory processing as a component of impaired olfaction in iRBD and in early PD. Reference Arnold, You, Ding, Zuo, de Araujo and Li21 Consistent with the meta-analysis results from Rahayel and colleagues, Reference Rahayel, Frasnelli and Joubert22 our data suggested abnormalities in low-level processing regions (early processing).
Surprisingly, the APC, a region receiving direct input from the olfactory bulb, did not display changes in FC in our sample. In a recent study, Reference Lee, Bak and hyun31 a different approach was taken to examine FC in olfactory brain regions in patients with PD. While the intent of the Lee et al. study was to compare FC between patients with dementia of the Alzheimer’s type to PD, they also included a healthy control group. When comparing the PD patients to the controls, no differences were found in FC between the olfactory bulb and any other brain region, and consistent with our data, no significant difference in FC was found between the piriform cortices and any other region. While Lee and colleagues Reference Lee, Bak and hyun31 did find FC changes in their PD patients (both increased and decreased), this group examined PD patients who also met criteria for dementia. This latter point differs from our sample in that their patients were at a later stage of illness than the patients examined in our study.
To our knowledge, no previous FC studies specifically exist examining olfactory brain regions in patients with iRBD. This gap in the literature makes our study unique.
iRBD vs PD
In our study, a similar degree of impaired olfaction and the same-region connectivity abnormalities were observed when comparing iRBD and PD. The similarity in olfactory performance was unsurprising given the relationship between the two conditions, particularly the high risk of converting to PD, in hyposmic iRBD patients. Reference Mahlknecht, Iranzo and Högl16 More notable was the reduced connectivity within the insula and the increased connectivity between the insula and thalamus seen in both iRBD and PD. The weakened connectivity between insular ROIs was expected in PD, as the insula has been noted as a region of Lewy body deposition in PD patients. Reference Christopher, Koshimori, Lang, Criaud and Strafella32 The reason for the weakened connectivity is unclear in iRBD; however, studies have shown reduced connectivity in the insula with nonolfactory regions in patients with RBD. Reference Byun, Cha and Kim33 Interestingly, the strengthened connectivity between the insula and thalamus was associated with worsening olfactory performance in both groups. Previous PD fMRI studies have suggested that increases in FC may be indicative of compensatory mechanisms. Reference Tessitore, Cirillo and De Micco30 Perhaps we have identified a compensatory reorganization of the SOS associated with olfactory deficits in iRBD and PD. Normally, the thalamus plays a minor role in olfaction; however, the increased connectivity we observed may indicate that the thalamus can be recruited when there is disruption to normal olfactory functioning. A similar phenomenon was observed in traumatic anosmic patients, where FC in the insular cortex was reduced, but whole-brain FC to the thalamus was increased. Reference Park, Chung, Kim, Jeong and Moon34
While the SOC model predicts that olfactory deficits are significantly associated with both the brain-first and the body-first subtypes, those in the brain-first subtype would be more likely to have unilateral (unirhinal) olfactory deficits due to the asymmetric of alpha synuclein propagation. The PD patients studied in this project had their olfactory function assessed birhinally, and as such, asymmetric deficits could not be identified. Moreover, iRBD is more strongly associated with the body-first subtype. Despite the two proposed mechanisms, our data suggests that both the iRBD and PD patients (irrespective of subtype) demonstrate similar degrees of changes to the sensory subnetwork. Future research will attempt to examine olfaction unirhinally in all participants (PD, iRBD and controls), along with both left and right hemisphere FC in order to further delineate olfactory changes in established PD patients.
Limitations
In the present pilot study, there were several factors that may have limited the generalizability of our findings. The small sample size may have limited the power of our results. The inclusion of only early PD patients in the PD group also may have influenced our results. Perhaps in PD, the olfactory system continues to degenerate as the disease progresses, and olfactory perception and FC in severe PD may be differentiated from iRBD. We chose to include uncorrected values in our statistical analysis due to the exploratory nature of the study. Larger sample sizes will further elucidate the nature of the changes that are specific or common to PD and iRBD. In addition, due to our use of only right hemisphere seed regions, it is possible that we missed FC changes that may be unique to the left hemisphere. Furthermore, the accuracy of our seed regions was limited by the capabilities of our MRI scanner. Perhaps a smaller voxel size would have allowed us to generate a more accurate representation of the SOS and its connectivity. Cognitive impairment, however minor, may have also confounded our data. Finally, the data presented does not answer the question of whether it is premotor PD or simply olfactory dysfunction that is at the root of the FC changes. Further research on patients with idiopathic olfactory loss may be able to better reconcile this potential confound.
Conclusions
The present study is the first to explore olfactory processing in iRBD and PD by examining olfactory identification ability and FC of the SOS. We found that in addition to differing from similarly aged neurologically normal control subjects at a perceptual and functional level, iRBD and early PD participants exhibited similar degrees of olfactory changes, some of which may be compensatory. Our findings help to add to the scarce literature surrounding FC in iRBD. Ultimately, our findings suggest that there are similarities underlying olfactory impairments in both conditions. Given our findings of hyposmia in both our iRBD and PD subjects, we postulate that the majority of idiopathic iRBD in our study will convert to PD. The pattern of FC alterations in the SOS could have utility as an additional marker for stratifying risk of converting from idiopathic iRBD to PD. Future studies should incorporate the entire olfactory network to develop a more comprehensive view of the olfactory changes seen in these conditions.
Acknowledgments
We wish to acknowledge the research assistants who were involved in collecting this data: Denise Lewis, Ceire Storey and Mackenzie Armstrong. We would also like to thank Carl Helmick for his work designing the functional analysis script. We appreciate the editorial assistance of Dr John Fisk. Lastly, we would like to acknowledge all those individuals who made this project possible.
Author contributions
MG: analyzed data and wrote the first draft of the manuscript, as partial fulfillment of his Research in Medicine requirement for MD. GP: consulted on initial study design, referred iRBD patients, commented on drafts of the manuscript. KS: consulted on initial study design, referred PD patients, commented on drafts of manuscript. HR: co-principal investigator on grant applications, designed original study, commented on drafts of the manuscript. KG: co-principal investigator on grant applications, designed original study, oversaw data collection, analyzed data, supervised MG’s Research in Medicine project, commented on all drafts of the manuscript.
Funding statement
Funding for this project was provided by the Canadian Institutes of Health Research, Parkinson’s Canada and the Dalhousie University Department of Psychiatry Research Fund.
Competing interests
The authors confirm that there are no competing conflicts of interest, financial or otherwise with this manuscript.
Ethical standards
Our study has received Research Ethics Board approval from the Nova Scotia Health Authority (#2007-224).


 Open access