


1. Introduction
Spider millisecond pulsars (MSPs) are a class of pulsars once considered rare, found in compact binary systems with orbital periods of less than a day and low-mass companion stars (Fruchter, Stinebring, & Taylor Reference Fruchter, Stinebring and Taylor1988; Roberts Reference Roberts and van Leeuwen2013; Wang et al. Reference Wang2021). They are further divided into two subclasses depending on the mass of their companions: redbacks (RBs) with semi-degenerate companions (0.3–0.7 M
 $_{\odot}$
) and black widows (BWs) with non-degenerate companions (
$_{\odot}$
) and black widows (BWs) with non-degenerate companions (
 $\lt\mathrm{0.1}$
M
$\lt\mathrm{0.1}$
M
 $_{\odot}$
) (Roberts Reference Roberts and van Leeuwen2013). As of August 2025, 32 confirmed RB pulsars and 49 BW pulsars have been identified in the Galactic field (see SpiderCat; Koljonen & Linares Reference Koljonen and Linares2025).Footnote
a
$_{\odot}$
) (Roberts Reference Roberts and van Leeuwen2013). As of August 2025, 32 confirmed RB pulsars and 49 BW pulsars have been identified in the Galactic field (see SpiderCat; Koljonen & Linares Reference Koljonen and Linares2025).Footnote
a
Due to the close proximity of the pulsar and its companion, the relativistic pulsar wind can ablate material from its companion star, gradually evaporating it over time (Fruchter et al. (Reference Fruchter, Stinebring and Taylor1988) Fruchter, Stinebring, Taylor]. The ablated material forms an ionised medium, which can then be seen at radio wavelengths as long-duration frequency-dependent eclipses (e.g. Shang et al. Reference Shang2024; Abbate et al. Reference Abbate2024; Kumari et al. Reference Kumari2024; Polzin et al. Reference Polzin2018). The exact physical mechanism causing these eclipses remains uncertain, though Thompson et al. (Reference Thompson, Blandford, Evans and Phinney1994) has proposed a number. These mechanisms can be investigated by measuring changes in the dispersion measure,
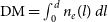 $\text{DM} = \int_0^d n_e(l) \, dl$
, near the eclipse boundaries of spider systems, using radio time–domain observations. Here,
$\text{DM} = \int_0^d n_e(l) \, dl$
, near the eclipse boundaries of spider systems, using radio time–domain observations. Here,
 $n_e(l)$
represents the number density of free electrons (in
$n_e(l)$
represents the number density of free electrons (in
 $\mathrm{cm}^{-3}$
) at a given point l along the line of sight from the pulsar (at distance d) to the observer (at
$\mathrm{cm}^{-3}$
) at a given point l along the line of sight from the pulsar (at distance d) to the observer (at
 $l=0$
). An increase in DM at eclipse ingress or egress indicates the presence of additional ionised material between the pulsar and the observer, providing insight into the plasma environment surrounding the companion. This approach has been employed in several studies aimed at identifying the underlying eclipse mechanism. For example, observations of PSR J1908+2105 (Ghosh et al. 2025) and and PSR J1431
$l=0$
). An increase in DM at eclipse ingress or egress indicates the presence of additional ionised material between the pulsar and the observer, providing insight into the plasma environment surrounding the companion. This approach has been employed in several studies aimed at identifying the underlying eclipse mechanism. For example, observations of PSR J1908+2105 (Ghosh et al. 2025) and and PSR J1431
 $-$
4715 (Kumari et al. Reference Kumari2024) suggest synchrotron absorption as the favoured eclipse mechanism, while PSR J1227
$-$
4715 (Kumari et al. Reference Kumari2024) suggest synchrotron absorption as the favoured eclipse mechanism, while PSR J1227
 $-$
4853 (Kudale et al. Reference Kudale, Roy, Bhattacharyya, Stappers and Chengalur2020) shows evidence consistent with cyclotron absorption.
$-$
4853 (Kudale et al. Reference Kudale, Roy, Bhattacharyya, Stappers and Chengalur2020) shows evidence consistent with cyclotron absorption.
The long-duration eclipses of spider pulsars, as well as their changing accelerations due to their short orbital periods, cause their apparent spin frequencies to vary significantly throughout observations, making the identification of spider systems in the time domain challenging. With the development of increasingly sensitive and wider-bandwidth low-frequency radio instruments such as the SKAO telescopes and their precursors (Dewdney et al. Reference Dewdney, Hall, Schilizzi and Lazio2009), image domain searches are becoming increasingly viable for detecting such systems (e.g. Zic et al. Reference Zic2024; Petrou et al. Reference Petrou2025). These systems can then be followed up with targeted beamforming observations.
Pulsar timing is a powerful tool in many areas of astrophysics, with applications ranging from testing general relativity to the detection of gravitational waves (e.g. Miles et al. Reference Miles2023; Kramer et al. Reference Kramer2006). The intrinsic and orbital properties of spider pulsars can be determined through timing studies, such as the pulsar’s spin period, its period derivatives, and the orbital period. The timing of spider pulsars involves measuring the time of arrival (ToA) of the pulses detected at a telescope and comparing them to a timing model. This can provide insight into the nature of the system’s eclipsing material by analysing the delayed ToAs just before and after the pulsar enters and exits eclipse. In addition, many spider pulsars exhibit orbital period variations, which can be tracked through long-term timing campaigns (Rosenthal et al. Reference Rosenthal2025). These variations are thought to be driven by processes such as changes in the gravitational quadrupole moment of the companion star, which extracts orbital energy from the system (Voisin et al. Reference Voisin2020).
Spider MSPs are also seen to emit
 $\gamma$
-ray emission (e.g. Lu et al. Reference Lu2025; Thongmeearkom et al. Reference Thongmeearkom2024; Deneva et al. Reference Deneva2021). The Third Pulsar Catalogue (3PC) (Smith et al. Reference Smith2023), compiled from observations with the Large Area Telescope (LAT) onboard the Fermi-gamma ray telescope (Atwood et al. Reference Atwood2009; Abdo et al. Reference Abdo2013), currently contains 294 detected
$\gamma$
-ray emission (e.g. Lu et al. Reference Lu2025; Thongmeearkom et al. Reference Thongmeearkom2024; Deneva et al. Reference Deneva2021). The Third Pulsar Catalogue (3PC) (Smith et al. Reference Smith2023), compiled from observations with the Large Area Telescope (LAT) onboard the Fermi-gamma ray telescope (Atwood et al. Reference Atwood2009; Abdo et al. Reference Abdo2013), currently contains 294 detected
 $\gamma$
-ray pulsars, including 32 BWs and 13 RBs (Smith et al. Reference Smith2023). Pulsars represent the largest Galactic class of
$\gamma$
-ray pulsars, including 32 BWs and 13 RBs (Smith et al. Reference Smith2023). Pulsars represent the largest Galactic class of
 $\gamma$
-ray sources. They are characterised by their low
$\gamma$
-ray sources. They are characterised by their low
 $\gamma$
-ray variability and high spectral curvature, which sets them apart from blazars (the most numerous extragalactic class). The discovery of additional
$\gamma$
-ray variability and high spectral curvature, which sets them apart from blazars (the most numerous extragalactic class). The discovery of additional
 $\gamma$
-ray sources contributes to the identification and classification of previously unassociated Fermi sources.
$\gamma$
-ray sources contributes to the identification and classification of previously unassociated Fermi sources.
The detection and characterisation of spider pulsars provides valuable insight into pulsar evolution, the equation of state of dense matter, and the study of plasma physics. This paper reports the discovery and follow-up of a new RB spider pulsar discovered in the image domain. The details of the discovery and follow-up observations are outlined in Section 2, along with potential Fermi and optical counterparts. The timing methodology is described in Section 3, and the results are presented in Section 4. Section 5 discusses the system parameters and eclipse mechanism. Finally, we conclude our findings in Section 6.
2. Observations
In this section, we outline the discovery and follow-up radio observations of PSR J1728
 $-$
4608. Observations were carried out using multiple radio telescopes across a range of frequencies, using both beamforming and interferometric imaging modes.
$-$
4608. Observations were carried out using multiple radio telescopes across a range of frequencies, using both beamforming and interferometric imaging modes.
2.1. Discovery with ASKAP
Two surveys carried out using Australian Square Kilometre Array Pathfinder (Hotan et al. Reference Hotan2021, ASKAP) are the Evolutionary Map of the Universe (EMU) (Norris et al. Reference Norris2011, Reference Norris2021)and the Variables and Slow Transients Survey (VAST) (Murphy et al. Reference Murphy2013, Reference Murphy2021).
VAST J172812.1
 $-$
460801 was discovered in the ASKAP archival dataset SB32526 as part of the EMU survey, observed for 10 h at a central frequency of 943.5 MHz on 2021 September 26. An untargeted 15-min timescale search for variable and transient sources using the VASTER pipeline (Wang et al. Reference Wang2023) revealed an eclipse-like light curve with a
$-$
460801 was discovered in the ASKAP archival dataset SB32526 as part of the EMU survey, observed for 10 h at a central frequency of 943.5 MHz on 2021 September 26. An untargeted 15-min timescale search for variable and transient sources using the VASTER pipeline (Wang et al. Reference Wang2023) revealed an eclipse-like light curve with a
 $\sim$
5 h period (Figure 1). A second 10-h EMU observation (SB53300), processed in the same way, showed a similar light curve shape and period, confirming the variability.
$\sim$
5 h period (Figure 1). A second 10-h EMU observation (SB53300), processed in the same way, showed a similar light curve shape and period, confirming the variability.

Figure 1. Radio light curve of VAST J172812.1
 $-$
460801 in the ASKAP observation SB32526 at 15-min time resolution.
$-$
460801 in the ASKAP observation SB32526 at 15-min time resolution.
VAST J172812.1
 $-$
460801 has also been detected as a highly variable source in VAST (see Figure 2), a radio survey designed to detect transient sources in the image domain. VAST is a multi-epoch, short (15-min) survey, with the Galactic component conducted on a bi-weekly cadence. Observations of VAST J172812.1
$-$
460801 has also been detected as a highly variable source in VAST (see Figure 2), a radio survey designed to detect transient sources in the image domain. VAST is a multi-epoch, short (15-min) survey, with the Galactic component conducted on a bi-weekly cadence. Observations of VAST J172812.1
 $-$
460801 span from 19 November 2022 to 3 October 2024, at a central frequency of 888 MHz, with a typical rms sensitivity of 0.24 mJy beam
$-$
460801 span from 19 November 2022 to 3 October 2024, at a central frequency of 888 MHz, with a typical rms sensitivity of 0.24 mJy beam
 $^{-1}$
.
$^{-1}$
.

Figure 2. VAST J172812.1
 $-$
460801 images from VAST. Left: Image from 2023-05-21T16:15:06.6 showing PSR J1728
$-$
460801 images from VAST. Left: Image from 2023-05-21T16:15:06.6 showing PSR J1728
 $-$
4608 is ‘on’. Right: Image from 2023-09-25T10:23:47.4 showing PSR J1728
$-$
4608 is ‘on’. Right: Image from 2023-09-25T10:23:47.4 showing PSR J1728
 $-$
4608 is ‘off’.
$-$
4608 is ‘off’.
2.2. Radio follow-up
2.2.1. ATCA
We observed VAST J172812.1
 $-$
460801 at 2 100 MHz using the Australia Telescope Compact Array (ATCA) on 2023 November 18 from 02:30:00 to 07:30:00 UT (project code: C3363). The array observed in a compact configuration, H214, and therefore, we removed all short baselines (i.e. the baselines without antenna CA06) during imaging. We measured a flux density of
$-$
460801 at 2 100 MHz using the Australia Telescope Compact Array (ATCA) on 2023 November 18 from 02:30:00 to 07:30:00 UT (project code: C3363). The array observed in a compact configuration, H214, and therefore, we removed all short baselines (i.e. the baselines without antenna CA06) during imaging. We measured a flux density of
 $0.29\pm0.05$
mJy at 2 100 MHz with a bandwidth of 2 000 MHz.
$0.29\pm0.05$
mJy at 2 100 MHz with a bandwidth of 2 000 MHz.
2.2.2. Parkes/Murriyang
We observed VAST J172812.1
 $-$
460801 with the Parkes telescope on 2023 November 17 from 06:00:00 to 08:30:00 UT (project code: PX118). The observation covered a frequency range of 704–4 032 MHz (Hobbs et al. Reference Hobbs2020), divided into 3 328 channels with 1 MHz bandwidth each. Coherent de-dispersion was applied at a DM of 90 pc cm
$-$
460801 with the Parkes telescope on 2023 November 17 from 06:00:00 to 08:30:00 UT (project code: PX118). The observation covered a frequency range of 704–4 032 MHz (Hobbs et al. Reference Hobbs2020), divided into 3 328 channels with 1 MHz bandwidth each. Coherent de-dispersion was applied at a DM of 90 pc cm
 $^{-3}$
, based on the estimated DM from the YMW16 Galactic electron density model (Yao, Manchester, & Wang Reference Yao, Manchester and Wang2017), using the source position and a initially estimated distance inferred from the parallax of its Gaia companion (see Section 2.3.2). To search for pulsations, we used the presto software suite (Ransom, Eikenberry, & Middleditch Reference Ransom, Eikenberry and Middleditch2002), applying a Fourier drift-rate search over a z-range of
$^{-3}$
, based on the estimated DM from the YMW16 Galactic electron density model (Yao, Manchester, & Wang Reference Yao, Manchester and Wang2017), using the source position and a initially estimated distance inferred from the parallax of its Gaia companion (see Section 2.3.2). To search for pulsations, we used the presto software suite (Ransom, Eikenberry, & Middleditch Reference Ransom, Eikenberry and Middleditch2002), applying a Fourier drift-rate search over a z-range of
 $\pm 150$
(Andersen & Ransom Reference Andersen and Ransom2018) to ensure sensitivity to short-period binary pulsars (Ng et al. Reference Ng2015). The search was conducted over a DM range of 40–140 pc cm
$\pm 150$
(Andersen & Ransom Reference Andersen and Ransom2018) to ensure sensitivity to short-period binary pulsars (Ng et al. Reference Ng2015). The search was conducted over a DM range of 40–140 pc cm
 $^{-3}$
using the 960–3 008 MHz sub-band, which was cleaned of radio frequency interference (RFI). We detected a 2.86 ms pulsar-like signal at DM of 65.6 pc cm
$^{-3}$
using the 960–3 008 MHz sub-band, which was cleaned of radio frequency interference (RFI). We detected a 2.86 ms pulsar-like signal at DM of 65.6 pc cm
 $^{-3}$
, accompanied by a measurable acceleration – indicative of binary motion, likely within an eclipsing binary system (See Figure 3). Hereafter, we refer to VAST J172812.1
$^{-3}$
, accompanied by a measurable acceleration – indicative of binary motion, likely within an eclipsing binary system (See Figure 3). Hereafter, we refer to VAST J172812.1
 $-$
460801 as PSR J1728
$-$
460801 as PSR J1728
 $-$
4608.
$-$
4608.

Figure 3. Pulsation detection of PSR J1728
 $-$
4608 with Parkes radio telescope on 17 November 2023 (see Section 2.2.2 for observation details). The main panel shows the evolution of pulsations over time, folded on the spin period of 2.86 ms. The top sub-panel displays the integrated pulse profile (frequency-scrunched to enhance signal-to-noise), while the side panel shows the reduced χ2 as a function of time, indicating the significance of the detection. Left: The pulsar is detected out of eclipse; the curvature of the signal indicates orbital acceleration due to the presence of a companion star. Right: The pulsar signal disappears as it enters eclipse.
$-$
4608 with Parkes radio telescope on 17 November 2023 (see Section 2.2.2 for observation details). The main panel shows the evolution of pulsations over time, folded on the spin period of 2.86 ms. The top sub-panel displays the integrated pulse profile (frequency-scrunched to enhance signal-to-noise), while the side panel shows the reduced χ2 as a function of time, indicating the significance of the detection. Left: The pulsar is detected out of eclipse; the curvature of the signal indicates orbital acceleration due to the presence of a companion star. Right: The pulsar signal disappears as it enters eclipse.
Subsequent observations of PSR J1728
 $-$
4608 were taken under project code P1342, again using the UWL band (704–4 032 MHz). A total of five observations were taken between January to May 2025, with durations of approximately 4–5 h.
$-$
4608 were taken under project code P1342, again using the UWL band (704–4 032 MHz). A total of five observations were taken between January to May 2025, with durations of approximately 4–5 h.
2.2.3. uGMRT
PSR J1728
 $-$
4608 was observed with the upgraded Giant Meterwave Radio Telescope (uGMRT; Swarup et al. Reference Swarup1991; Gupta et al. Reference Gupta2017), using band-4 (550–750 MHz) with a 200-MHz bandwidth. Simultaneous observations were carried out in both interferometric and coherent phased array modes, using 81-
$-$
4608 was observed with the upgraded Giant Meterwave Radio Telescope (uGMRT; Swarup et al. Reference Swarup1991; Gupta et al. Reference Gupta2017), using band-4 (550–750 MHz) with a 200-MHz bandwidth. Simultaneous observations were carried out in both interferometric and coherent phased array modes, using 81-
 $\mu$
s sampling. The observation was taken on the 12th July 2024 under project code 46_056 and spanned the whole orbital period (
$\mu$
s sampling. The observation was taken on the 12th July 2024 under project code 46_056 and spanned the whole orbital period (
 $\sim5$
hr).
$\sim5$
hr).
The observation began with a scan of the bright calibrator 3C286 for setup, flux, and bandpass calibration. Phasing and phase calibration scans were then performed using 1830-360. PSR J1728
 $-$
4608 was observed in 35-min intervals, interleaved with regular phasing and phase calibration scans to maintain coherence for the phased array mode and to calibrate the gains of the interferometric visibilities.
$-$
4608 was observed in 35-min intervals, interleaved with regular phasing and phase calibration scans to maintain coherence for the phased array mode and to calibrate the gains of the interferometric visibilities.
Calibration and flagging on the interferometric data were carried out using Common Astronomy Software Applications (CASA; CASA Team et al. Reference Team2022). Imaging was done using WSClean (Offringa et al. Reference Offringa2014), using multi-frequency synthesis imaging, Briggs weighting with a robust parameter of
 $-$
0.5 (Briggs Reference Briggs1995), and joint-channel deconvolution. The bandwidth was split into four channels, and the data were divided into ten time intervals during imaging. Aegean (Hancock et al. Reference Hancock, Murphy, Gaensler, Hopkins and Curran2012; Hancock, Trott, & Hurley-Walker Reference Hancock, Trott and Hurley-Walker2018) was used to extract the flux densities and associated errors. When the source is eclipsed, the flux density is reported as an upper limit by measuring the pixel value at the source’s location.
$-$
0.5 (Briggs Reference Briggs1995), and joint-channel deconvolution. The bandwidth was split into four channels, and the data were divided into ten time intervals during imaging. Aegean (Hancock et al. Reference Hancock, Murphy, Gaensler, Hopkins and Curran2012; Hancock, Trott, & Hurley-Walker Reference Hancock, Trott and Hurley-Walker2018) was used to extract the flux densities and associated errors. When the source is eclipsed, the flux density is reported as an upper limit by measuring the pixel value at the source’s location.
The beamformed data were cleaned and converted into SIGPROC filterbank format using RFIClean (Maan, van Leeuwen, & Vohl Reference Maan, van Leeuwen and Vohl2021), producing a data format suitable for the timing analysis described in Section 3.
2.2.4. MeerKAT
MeerKAT S-band observations were conducted under proposal code SCI-20241101-NH-01, using the S4 window at 2 625–3 500 MHz. PSR J1728
 $-$
4608 was observed in two 30-min integrations on 15-Dec-2024 at 05:36:39.0 and 09:47:03.6. These observations were scheduled to coincide with the pulsar’s inferior conjunctions (i.e. least likely to be in eclipse).
$-$
4608 was observed in two 30-min integrations on 15-Dec-2024 at 05:36:39.0 and 09:47:03.6. These observations were scheduled to coincide with the pulsar’s inferior conjunctions (i.e. least likely to be in eclipse).
The observing setup included standard calibrations: bandpass, polarisation, and phase calibrators, as well as phase-up and test pulsar observations. In addition to correlator observations undertaken at 8-s/854.492-kHz resolution, we also employed the Pulsar Timing User Supplied Equipment (PTUSE; Bailes et al. Reference Bailes2020) in search mode, using 37.45-
 ${\unicode{x03BC}}$
s sampling.
${\unicode{x03BC}}$
s sampling.
Correlator data were calibrated using the standard SARAO SDP calibration pipeline and imaged using WSClean. Each 30-min scan was imaged separately to optimise signal-to-noise for accurate source position measurements and to provide some temporal resolution for studying source variability at S-band.
PSR J1728
 $-$
4608’s position was obtained using the MeerKAT imaging data, which provides the highest resolution among the available observations. It was measured using Aegean and found to be 17:28:12.27,
$-$
4608’s position was obtained using the MeerKAT imaging data, which provides the highest resolution among the available observations. It was measured using Aegean and found to be 17:28:12.27,
 $-46$
:08:01.26 (J2000) with uncertainties of 42 mas in RA and 28 mas in Dec (1
$-46$
:08:01.26 (J2000) with uncertainties of 42 mas in RA and 28 mas in Dec (1
 $\sigma$
).
$\sigma$
).
2.3. Multiwavelength archival data and follow-up
This section details the optical and
 $\gamma$
-ray archival searches for counterparts of PSR J1728
$\gamma$
-ray archival searches for counterparts of PSR J1728
 $-$
4608.
$-$
4608.
2.3.1. Fermi
We searched for possible
 $\gamma$
-ray associations of PSR J1728
$\gamma$
-ray associations of PSR J1728
 $-$
4608 in Fermi’s Fourth Full Catalogue of LAT Sources (4FGL-DR4; Abdollahi et al. Reference Abdollahi2020). The nearest source is 4FGL J1728.0
$-$
4608 in Fermi’s Fourth Full Catalogue of LAT Sources (4FGL-DR4; Abdollahi et al. Reference Abdollahi2020). The nearest source is 4FGL J1728.0
 $-$
4606, which lies 2’ away from PSR J1728
$-$
4606, which lies 2’ away from PSR J1728
 $-$
4608, as shown in Figure 4. Our source appears to lie outside the 95% confidence ellipse. While this may indicate a low probability of association, Abdollahi et al. (Reference Abdollahi2020) notes that
$-$
4608, as shown in Figure 4. Our source appears to lie outside the 95% confidence ellipse. While this may indicate a low probability of association, Abdollahi et al. (Reference Abdollahi2020) notes that
 $\gamma$
-ray source localisation in the Galactic Plane is challenging due to high background emission. Therefore, we still consider this a potential association.
$\gamma$
-ray source localisation in the Galactic Plane is challenging due to high background emission. Therefore, we still consider this a potential association.
2.3.2. Gaia
We searched archival data for a possible companion star to PSR J1728
 $-$
4608. A nearby star, Gaia DR3 5951944861092533248, was identified in Gaia Data Release 3 (Gaia Collaboration et al. Reference Collaboration2023), classified as an eclipsing binary with a similar orbital period to that observed in the radio lightcurve of PSR J1728
$-$
4608. A nearby star, Gaia DR3 5951944861092533248, was identified in Gaia Data Release 3 (Gaia Collaboration et al. Reference Collaboration2023), classified as an eclipsing binary with a similar orbital period to that observed in the radio lightcurve of PSR J1728
 $-$
4608. Hereafter, we refer to Gaia DR3 5951944861092533248 as Gaia1.
$-$
4608. Hereafter, we refer to Gaia DR3 5951944861092533248 as Gaia1.
The position of Gaia1 is 17:28:12.1689,
 $-$
46:08:00.8634 (J2016), with positional uncertainties of 0.2077 mas in RA and 0.1394 mas in DEC.
$-$
46:08:00.8634 (J2016), with positional uncertainties of 0.2077 mas in RA and 0.1394 mas in DEC.
The positional offset between PSR J1728
 $-$
4608 and Gaia1 is less than
$-$
4608 and Gaia1 is less than
 $0.5''$
(see Figure 5). Gaia1 has a mean G-band magnitude of 18.8 mag and parallax of 0.63
$0.5''$
(see Figure 5). Gaia1 has a mean G-band magnitude of 18.8 mag and parallax of 0.63
 $\pm$
0.23 mas. We present the light curve in Section 4.2.2, confirming the association.
$\pm$
0.23 mas. We present the light curve in Section 4.2.2, confirming the association.
2.3.3. Las cumbres observatory
We conducted 17.8 h of optical imaging of Gaia1 with the Sinistro cameras mounted on 1m telescopes as part of the Las Cumbres Observatory Global Telescope Network (LCOGT; Brown et al. Reference Brown2013) between May and July 2024. This consisted of g, r, i, and z-band observations across the orbital period with exposure times of 140, 100, 80, and 160 s, respectively, which were automatically reduced with the BANZAI pipeline (McCully et al. Reference McCully, Guzman and Ibsen2018). For each filter, the resultant images are stacked with SWarp (Bertin Reference Bertin2010) in groups of three consecutive images to minimise the impact of cosmic rays and maximise sensitivity while maintaining an acceptable cadence. Aperture photometry is extracted using Source-Extractor (Bertin & Arnouts Reference Bertin and Arnouts1996), and zeropoints are measured using the SkyMapper Sky Survey DR4 (Onken et al. Reference Onken2024). It is also important to note that Gaia1 is blended with another Gaia source (Gaia DR3 5951944861144454656, located 1.36” from Gaia1) in the LCO images. Source-Extractor was used to force the de-blending of the two sources.
3. Pulsar timing methodology
Pulsar timing involves a repetitive process of fitting a model for the intrinsic properties of the pulsar (including its astrometric, rotational, and binary parameters) to the pulse arrival times, eventually yielding a coherent timing solution that accounts for every rotation of the pulsar over the observation span. This section describes the methodology used to obtain a coherent timing solution for PSR J1728
 $-$
4608. To do this, we use the beamforming data from uGMRT (550–750 MHz), Parkes (704–4 032 MHz), and MeerKAT (2 625–3 500 MHz), which are detailed in Section 2.
$-$
4608. To do this, we use the beamforming data from uGMRT (550–750 MHz), Parkes (704–4 032 MHz), and MeerKAT (2 625–3 500 MHz), which are detailed in Section 2.
3.1. Initial orbital solution
To carry out the timing analysis of PSR J1728
 $-$
4608, we need an initial estimate of the system’s intrinsic parameters. Two of the observations obtained with Parkes (under project code P1342) were taken within a week of each other and covered the full orbital phase (
$-$
4608, we need an initial estimate of the system’s intrinsic parameters. Two of the observations obtained with Parkes (under project code P1342) were taken within a week of each other and covered the full orbital phase (
 $\sim$
5 h), allowing us to constrain the orbit. We used fitorbit.py
Footnote
b
to fit an orbital model and obtain initial estimates of the pulsar’s spin period, orbital period, projected semi-major axis, epoch of periastron, eccentricity, and argument of periastron.
$\sim$
5 h), allowing us to constrain the orbit. We used fitorbit.py
Footnote
b
to fit an orbital model and obtain initial estimates of the pulsar’s spin period, orbital period, projected semi-major axis, epoch of periastron, eccentricity, and argument of periastron.

Figure 4. MeerKAT S-band image marking the location of the PSR J1728
 $-$
4608 (green circle) and the closest Fermi source 4FGL J1728.0-4606 (yellow cross). The position offset and Fermi 95
$-$
4608 (green circle) and the closest Fermi source 4FGL J1728.0-4606 (yellow cross). The position offset and Fermi 95
 $\%$
error ellipses (shown in yellow) are indicated. See Section 2.3.1 for more details.
$\%$
error ellipses (shown in yellow) are indicated. See Section 2.3.1 for more details.
3.2. Pulse times-of-arrival
We folded the data using the initial ephemeris, selecting the ELL1 binary model (Lange et al. Reference Lange2001), which is suitable for systems with very small eccentricities. The data were folded using dspsr, part of the PSRCHIVE package (van Straten, Demorest, & Oslowski Reference van Straten, Demorest and Oslowski2012), using 8 CPU threads and with the data integrated into 10-s intervals. The data were subsequently binned in frequency and time using pam. For MeerKAT, the data were binned into 8 frequency channels and
 $\sim$
1 min sub-integrations; for Parkes, four frequency channels and
$\sim$
1 min sub-integrations; for Parkes, four frequency channels and
 $\sim$
5 min sub-integrations were used; and for uGMRT, 8 frequency channels and
$\sim$
5 min sub-integrations were used; and for uGMRT, 8 frequency channels and
 $\sim$
3 min sub-integrations.
$\sim$
3 min sub-integrations.
We then used pat to extract ToAs by determining the phase shift between the high S/N pulsar template and the observed profiles, using a Fourier-domain Markov Chain Monte Carlo algorithm. We constructed a high S/N template for each telescope (uGMRT, Parkes, and MeerKAT) using paas, by phase summing the highest S/N profiles from the respective observations. For each telescope, we use a single pulse template across the entire observing band, assuming the intrinsic pulse shape evolves negligibly across frequency. As shown in Section 4.1.1, the primary frequency-dependent change in the profile is a slight widening of the pulse, which we attribute to scattering broadening. According to McSweeney et al. (Reference McSweeney2025), a scattering timescale of
 $91 \pm 34\,{\mu}\textrm{s}$
at 704 MHz (the lowest frequency of the Parkes observations) implies an additional ToA error of approximately
$91 \pm 34\,{\mu}\textrm{s}$
at 704 MHz (the lowest frequency of the Parkes observations) implies an additional ToA error of approximately
 $45\,{\mu}\textrm{s}$
. This is much smaller than the residual errors (
$45\,{\mu}\textrm{s}$
. This is much smaller than the residual errors (
 ${\sim}300\,{\mu}\textrm{s}$
) we observe, and thus, using a single template across the band should not introduce significant bias. The specific number of ToAs from each observation is determined by observation length and the brightness of the detection. Table 1 gives details of the number of ToAs, where we have excluded ToAs with uncertainties
${\sim}300\,{\mu}\textrm{s}$
) we observe, and thus, using a single template across the band should not introduce significant bias. The specific number of ToAs from each observation is determined by observation length and the brightness of the detection. Table 1 gives details of the number of ToAs, where we have excluded ToAs with uncertainties
 ${\gt}150\,{\unicode{x03BC}}\text{s}$
and ToAs in the eclipse region.
${\gt}150\,{\unicode{x03BC}}\text{s}$
and ToAs in the eclipse region.
3.3. Phase connected timing solution
The ToA residuals were plotted using Tempo2 (Hobbs, Edwards, & Manchester Reference Hobbs, Edwards and Manchester2006), where residuals refer to the difference between the observed ToAs and those predicted by the timing model. To achieve a phase-connected solution across all observations, we employed an iterative approach in which observations were added incrementally, and model parameters were refined accordingly. We began by fitting only for the spin frequency and binary parameters. As additional observations were incorporated, the model was extended to include the spin frequency and orbital period derivatives, as well as the DM. To account for arbitrary time offsets between telescopes, we fitted JUMPs to the uGMRT and MeerKAT data using Tempo2, with the Parkes data serving as the reference. The JUMPs account for differences such as instrumental delays, the use of distinct pulse templates, and the choice of the fiducial point on each template. After incorporating all datasets, the fit converged on a coherent timing solution.

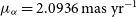
Figure 5. The image shows the position of PSR J1728
 $-$
4608 relative to its potential optical companion Gaia1. The background image was obtained with the DECam instrument on the CTIO 4-m Blanco telescope in the VR-band filter (central wavelength 630 nm, bandwidth 260 nm) as part of the 2016 observations (Flaugher et al. Reference Flaugher2015). The source is a blend of two objects, the second being Gaia DR3 5951944861144454656. The cyan arrow indicates the proper motion vector of the Gaia1 source, with components
$-$
4608 relative to its potential optical companion Gaia1. The background image was obtained with the DECam instrument on the CTIO 4-m Blanco telescope in the VR-band filter (central wavelength 630 nm, bandwidth 260 nm) as part of the 2016 observations (Flaugher et al. Reference Flaugher2015). The source is a blend of two objects, the second being Gaia DR3 5951944861144454656. The cyan arrow indicates the proper motion vector of the Gaia1 source, with components
 $(\mu_{\alpha} \cos\delta, \mu_{\delta}) = (+2.094, -8.844)$
mas yr
$(\mu_{\alpha} \cos\delta, \mu_{\delta}) = (+2.094, -8.844)$
mas yr
 $^{-1}$
. The positional uncertainties of the Gaia sources and the pulsar are on the order of milliarcseconds and are not shown in the figure.
$^{-1}$
. The positional uncertainties of the Gaia sources and the pulsar are on the order of milliarcseconds and are not shown in the figure.
Table 1. Summary of timing observations from each Telescope.

4. Results
4.1. Timing solution
PSR J1728
 $-$
4608 is found to be an MSP with a spin period (P) of 2.86 ms, in a 5.05 h binary orbit with a companion with a derived minimum mass of 0.13 M
$-$
4608 is found to be an MSP with a spin period (P) of 2.86 ms, in a 5.05 h binary orbit with a companion with a derived minimum mass of 0.13 M
 $_{\odot}$
, assuming an inclination of 90
$_{\odot}$
, assuming an inclination of 90
 $^\circ$
(for an edge-on orbit) and pulsar mass of
$^\circ$
(for an edge-on orbit) and pulsar mass of
 $1.4$
M
$1.4$
M
 $_{\odot}$
(Zhang et al. Reference Zhang2011). We present the timing solution in Figure 6 and in Table 2. The reduced
$_{\odot}$
(Zhang et al. Reference Zhang2011). We present the timing solution in Figure 6 and in Table 2. The reduced
 $\chi^2\approx1.9$
is greater than unity and may add additional uncertainty to the timing solution that has not been accounted for. Using our timing parameters in Table 2, we derive the spin-down luminosity as
$\chi^2\approx1.9$
is greater than unity and may add additional uncertainty to the timing solution that has not been accounted for. Using our timing parameters in Table 2, we derive the spin-down luminosity as
 $\dot E =1.11\times 10^{34}\text{erg s}^{-1}$
using the formula
$\dot E =1.11\times 10^{34}\text{erg s}^{-1}$
using the formula
 $\dot E\equiv4\pi^2I\dot PP^{-3}$
, where the neutron star moment of inertia is assumed to be
$\dot E\equiv4\pi^2I\dot PP^{-3}$
, where the neutron star moment of inertia is assumed to be
 $I=10^{45}\ \mathrm{g\ cm^2}$
and
$I=10^{45}\ \mathrm{g\ cm^2}$
and
 $\dot P$
has been corrected for the Shklovskii effect (see Section 5.1 for details). The characteristic age and surface magnetic field are calculated as
$\dot P$
has been corrected for the Shklovskii effect (see Section 5.1 for details). The characteristic age and surface magnetic field are calculated as
 $\tau _c\equiv\frac{P}{2\dot P}=5.8$
Gyr, and
$\tau _c\equiv\frac{P}{2\dot P}=5.8$
Gyr, and
 $B_0\equiv3.2\times10^{19}(P\dot P)^{\frac{1}{2}}=1.6\times 10^8$
G, respectively. These values are also given in Table 2 and are all consistent with the known MSP population. We also measure a significant detection for the orbital period derivative
$B_0\equiv3.2\times10^{19}(P\dot P)^{\frac{1}{2}}=1.6\times 10^8$
G, respectively. These values are also given in Table 2 and are all consistent with the known MSP population. We also measure a significant detection for the orbital period derivative
 $\dot P_b$
and explain the implications of this in Section 5.1.
$\dot P_b$
and explain the implications of this in Section 5.1.


Table 2. Timing parameters for PSR J1728
 $-$
4608.
$-$
4608.

a
 $\omega$
is the argument of periastron.
$\omega$
is the argument of periastron.
4.1.1. Pulse profile evolution
The frequency-dependent evolution of pulse profiles offers key insights into the emission mechanisms of pulsars, shedding light on both emission geometries and radius-to-frequency mapping (Cordes Reference Cordes1978). PSR J1728
 $-$
4608 is seen to exhibit frequency-dependent pulse profile evolution, with a second component seen at 3 062 MHz as seen in Figure 7. We fit Gaussian profiles to the dominant and secondary pulse components using paas, deriving pulse widths as a function of frequency. The main component has a width at 50% of the peak intensity
$-$
4608 is seen to exhibit frequency-dependent pulse profile evolution, with a second component seen at 3 062 MHz as seen in Figure 7. We fit Gaussian profiles to the dominant and secondary pulse components using paas, deriving pulse widths as a function of frequency. The main component has a width at 50% of the peak intensity
 $W_{50}$
of 0.080 ms at 650 MHz, 0.14 ms at 2 368 MHz, and 0.22 ms at 3 062 MHz. The second component has
$W_{50}$
of 0.080 ms at 650 MHz, 0.14 ms at 2 368 MHz, and 0.22 ms at 3 062 MHz. The second component has
 $W_{50} = 0.44$
ms at 3 062 MHz.
$W_{50} = 0.44$
ms at 3 062 MHz.

Figure 7. Normalised, averaged pulse profiles outside the eclipse phase at different observing frequencies. A second component is visible in the MeerKAT profile; see Section 4.1.1 for details.
Radio waves emitted by pulsars propagate through the turbulent, ionised interstellar medium (ISM), which introduces frequency-dependent delays and phase variations. One important propagation effect is scattering, which causes multipath propagation and temporal broadening of the pulse. This effect is evident in Figure 7, where increased scattering is observed at lower frequencies. To model this pulse broadening, we assume the thin screen approximation, in which the scattering timescale is determined by fitting the observed pulse profile with a convolution of a Gaussian and an exponential function (Scheuer Reference Scheuer1968). We obtain scattering timescales of
 $130 \pm 50\,\mu \textrm{s}$
,
$130 \pm 50\,\mu \textrm{s}$
,
 $0.5 \pm 0.2\,\mu \textrm{s}$
, and
$0.5 \pm 0.2\,\mu \textrm{s}$
, and
 $0.14 \pm 0.05\,\mu \textrm{s}$
at 650, 2 348, and 3 062 MHz, respectively, where the uncertainty estimates are derived from the covariance matrix of the fit. Using the DM-based model from Bhat et al. (Reference Bhat, Cordes, Camilo, Nice and Lorimer2004), we estimate scattering timescales
$0.14 \pm 0.05\,\mu \textrm{s}$
at 650, 2 348, and 3 062 MHz, respectively, where the uncertainty estimates are derived from the covariance matrix of the fit. Using the DM-based model from Bhat et al. (Reference Bhat, Cordes, Camilo, Nice and Lorimer2004), we estimate scattering timescales
 $11.7791 \pm 0.0004\,\mu \textrm{s}$
,
$11.7791 \pm 0.0004\,\mu \textrm{s}$
,
 $0.080139 \pm 0.000003\,\mu \textrm{s}$
, and
$0.080139 \pm 0.000003\,\mu \textrm{s}$
, and
 $0.029715 \pm 0.000001\,\mu \textrm{s}$
at the same frequencies, where the uncertainties are derived from error propagation of the DM measurement. The significantly larger scattering timescales derived from the thin screen model indicate the presence of additional scattering beyond what is predicted by the DM-based model. This discrepancy likely arises from local plasma within the binary system, such as material from the companion star, which is not accounted for in the average ISM scattering relations.
$0.029715 \pm 0.000001\,\mu \textrm{s}$
at the same frequencies, where the uncertainties are derived from error propagation of the DM measurement. The significantly larger scattering timescales derived from the thin screen model indicate the presence of additional scattering beyond what is predicted by the DM-based model. This discrepancy likely arises from local plasma within the binary system, such as material from the companion star, which is not accounted for in the average ISM scattering relations.
4.1.2. Excess DM
PSR J1728
 $-$
4608 is eclipsed for approximately 45% of its orbit at 2 368 MHz. As the pulsar is eclipsed, there is an excess in the observed DM due to the presence of the eclipsing material from the ablated companion.
$-$
4608 is eclipsed for approximately 45% of its orbit at 2 368 MHz. As the pulsar is eclipsed, there is an excess in the observed DM due to the presence of the eclipsing material from the ablated companion.
The excess DM (DM
 $_{\text{excess}}$
) is given by the equation (Lorimer & Kramer Reference Lorimer and Kramer2004)
$_{\text{excess}}$
) is given by the equation (Lorimer & Kramer Reference Lorimer and Kramer2004)
 \begin{equation} \mathrm{DM_{\rm excess}\ (pc\ cm^{-3})} = 2.4\times10^{-10}\ t({\unicode{x03BC}} {\rm s}) \ \nu(\text{MHz})^{2} \ ,\end{equation}
where t is the ToA time delay and
 $\nu$
is the frequency. The corresponding electron column density (
$\nu$
is the frequency. The corresponding electron column density (
 $N_{e}$
) can be obtained using
$N_{e}$
) can be obtained using
 \begin{equation} N_{e}\ (\text{cm}^{-2}) = 3\times10^{18} \times \mathrm{DM_{\rm excess}\ (pc\ cm^{-3})}\end{equation}
Figure 8 shows DMexcess against orbital phase, where the points in the eclipsed phase have been removed. The orbital phase has been defined with respect to the time of ascending node (
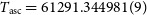 $T_{\rm asc}=61291.344981(9)$
), which is provided in Table 1. The figure includes data from the observing epoch that covers the ingress/egress phase and has sufficient S/N. The figure shows an increase in DM in each epoch, with a larger DM excess seen in ingress. Lower frequencies (uGMRT at 650 MHz) move into eclipse earlier, as there is an increase in DM earlier. The largest
$T_{\rm asc}=61291.344981(9)$
), which is provided in Table 1. The figure includes data from the observing epoch that covers the ingress/egress phase and has sufficient S/N. The figure shows an increase in DM in each epoch, with a larger DM excess seen in ingress. Lower frequencies (uGMRT at 650 MHz) move into eclipse earlier, as there is an increase in DM earlier. The largest
 $\mathrm{DM_{\rm excess}} =2.0 \pm 1.2 \mathrm{pc cm}^{-3}$
, which corresponds to
$\mathrm{DM_{\rm excess}} =2.0 \pm 1.2 \mathrm{pc cm}^{-3}$
, which corresponds to
 $N_e =5.9 \pm 3.6 \times10^{18} \ \mathrm{cm^{-2}}$
.
$N_e =5.9 \pm 3.6 \times10^{18} \ \mathrm{cm^{-2}}$
.

Figure 8. DMexcess (left y-axis) and the corresponding
 $N_e$
(right y-axis) are shown against orbital phase. uGMRT data at 650 MHz are shown as red squares, and Parkes data at 2 368 MHz as circles. The orbital phase is defined with respect to
$N_e$
(right y-axis) are shown against orbital phase. uGMRT data at 650 MHz are shown as red squares, and Parkes data at 2 368 MHz as circles. The orbital phase is defined with respect to
 $T_{\rm asc}$
, with the eclipse centred at an orbital phase of approximately 0.25. See Section 4.1.2 for further details.
$T_{\rm asc}$
, with the eclipse centred at an orbital phase of approximately 0.25. See Section 4.1.2 for further details.
4.2. Imaging
4.2.1. Radio
PSR J1728
 $-$
4608 was observed across a range of radio frequencies using multiple radio telescopes in the image domain (see Section 2). The top panel of Figure 9 presents the folded light curve on the orbital period derived from our timing analysis. The folded light curve exhibits eclipsing behaviour consistent with that seen in the beamformed observations.
$-$
4608 was observed across a range of radio frequencies using multiple radio telescopes in the image domain (see Section 2). The top panel of Figure 9 presents the folded light curve on the orbital period derived from our timing analysis. The folded light curve exhibits eclipsing behaviour consistent with that seen in the beamformed observations.
To quantify the eclipse properties, we fit the EMU data (as it covers the full orbital phase) with a double Fermi-Dirac function (see Zic et al. Reference Zic2024):
 \begin{equation}S({\unicode{x03D5}}) = S_0 \left[ \left( \frac{1}{1 + e^{\frac{{\unicode{x03D5}} - {\unicode{x03D5}}_i}{w_i}}} - \frac{1}{1 + e^{\frac{{\unicode{x03D5}} - {\unicode{x03D5}}_e}{w_e}}} \right) \right]\end{equation}
where
 ${\unicode{x03D5}}$
is the orbital phase,
${\unicode{x03D5}}$
is the orbital phase,
 ${\unicode{x03D5}}_i$
and
${\unicode{x03D5}}_i$
and
 ${\unicode{x03D5}}_e$
are the phases at the eclipse ingress and egress,
${\unicode{x03D5}}_e$
are the phases at the eclipse ingress and egress,
 $w_i$
and
$w_i$
and
 $w_e$
are the widths of the ingress and egress, and
$w_e$
are the widths of the ingress and egress, and
 $S_0$
is the flux density at the pulsar’s inferior conjunction (i.e. out of eclipse). The fitted parameters
$S_0$
is the flux density at the pulsar’s inferior conjunction (i.e. out of eclipse). The fitted parameters
 ${\unicode{x03D5}}_i$
,
${\unicode{x03D5}}_i$
,
 $w_i$
,
$w_i$
,
 ${\unicode{x03D5}}_e$
, and
${\unicode{x03D5}}_e$
, and
 $w_e$
are found to be 0.98(2), 0.05(2), 0.4(1), and 0.001(30), respectively, with uncertainties derived from the covariance matrix of the fit. The total eclipse duration for EMU, calculated as
$w_e$
are found to be 0.98(2), 0.05(2), 0.4(1), and 0.001(30), respectively, with uncertainties derived from the covariance matrix of the fit. The total eclipse duration for EMU, calculated as
 $(1 - {\unicode{x03D5}}_i) + {\unicode{x03D5}}_e$
, is found to be approximately 42% of the orbital phase.
$(1 - {\unicode{x03D5}}_i) + {\unicode{x03D5}}_e$
, is found to be approximately 42% of the orbital phase.
For the uGMRT data, which under-samples the egress side of the eclipse, we fit a modified version of Equation (3), in which we fit only the ingress side:
 \begin{equation} S({\unicode{x03D5}}) = S_0 \left[\left( \frac{1}{1 + e^{\frac{{\unicode{x03D5}} - {\unicode{x03D5}}_i}{w_i}}} \right) \right]\end{equation}
The resulting best-fit parameters for the uGMRT ingress are
 ${\unicode{x03D5}}_i = 0.848(6)$
and
${\unicode{x03D5}}_i = 0.848(6)$
and
 $w_i = 0.091(6)$
.
$w_i = 0.091(6)$
.
To characterise the frequency dependence, we measure the ingress duration (
 $t_{\text{ingress}}$
) at 650 MHz (uGMRT) and 888 MHz (EMU). We define the ingress duration as the time taken for the flux density to decrease from 90% to 10% of its maximum value (
$t_{\text{ingress}}$
) at 650 MHz (uGMRT) and 888 MHz (EMU). We define the ingress duration as the time taken for the flux density to decrease from 90% to 10% of its maximum value (
 $S_0$
in Equations 3 and 4). We found
$S_0$
in Equations 3 and 4). We found
 $t_{\text{ingress,888 MHz}}=1.03$
h and
$t_{\text{ingress,888 MHz}}=1.03$
h and
 $t_{\text{ingress,650 MHz}}=1.77$
h. Assuming a power-law dependence of ingress duration with frequency (
$t_{\text{ingress,650 MHz}}=1.77$
h. Assuming a power-law dependence of ingress duration with frequency (
 $t_{\text{ingress}} \propto \nu^n$
), we estimate a power law index
$t_{\text{ingress}} \propto \nu^n$
), we estimate a power law index
 $n=-1.74$
.
$n=-1.74$
.
Figure 10 illustrates the spectrum fitted with a simple power law of the form
 $S_{\nu} \propto \nu^\alpha$
, where
$S_{\nu} \propto \nu^\alpha$
, where
 $\alpha$
is the spectral index. The spectral index found is
$\alpha$
is the spectral index. The spectral index found is
 $-$
1.81(3), where the error is derived from the covariance matrix of the fit.
$-$
1.81(3), where the error is derived from the covariance matrix of the fit.
4.2.2. Optical
Figure 9 shows the optical G-band phase-folded lightcurve for Gaia1. The Gaia G-band light curve displays two brightness maxima per orbit, consistent with ellipsoidal modulation from a tidally distorted companion. For pure ellipsoidal modulation, the peaks are expected near orbital phases 0 and 0.5, corresponding to the ascending and descending nodes of the companion. However, for our source, the observed maxima occur at phases
 $\sim0.15$
and
$\sim0.15$
and
 $\sim0.6$
. This shift is likely caused by irradiation from the pulsar, indicating that the light curve reflects a combination of ellipsoidal and irradiation effects. Gaia measured an effective temperature (
$\sim0.6$
. This shift is likely caused by irradiation from the pulsar, indicating that the light curve reflects a combination of ellipsoidal and irradiation effects. Gaia measured an effective temperature (
 $T_{\rm eff}$
) of 4 384 K corresponding to a K-type star. This is consistent with RB systems, which generally have companion temperatures in the range 4 000–6 000 K. Gaia DR3 provides a model-dependent distance from the General Stellar Parameterizer from Photometry (GSP-Phot; Andrae et al. Reference Andrae2023) derived from a Bayesian inference combining the BP/RP spectra, G-band photometry, the measured parallax, and stellar evolutionary models. The calculated GSP-Phot distance is 1.288
$T_{\rm eff}$
) of 4 384 K corresponding to a K-type star. This is consistent with RB systems, which generally have companion temperatures in the range 4 000–6 000 K. Gaia DR3 provides a model-dependent distance from the General Stellar Parameterizer from Photometry (GSP-Phot; Andrae et al. Reference Andrae2023) derived from a Bayesian inference combining the BP/RP spectra, G-band photometry, the measured parallax, and stellar evolutionary models. The calculated GSP-Phot distance is 1.288
 $^{+0.122}_{-0.091}$
kpc. Andrae et al. (Reference Andrae2023) state that the GSP-Phot distance is underestimated for sources with large parallax errors (S/N
$^{+0.122}_{-0.091}$
kpc. Andrae et al. (Reference Andrae2023) state that the GSP-Phot distance is underestimated for sources with large parallax errors (S/N
 $\lt$
20). Gaia1 has a parallax of 0.63
$\lt$
20). Gaia1 has a parallax of 0.63
 $\pm$
0.23 mas, giving S/N
$\pm$
0.23 mas, giving S/N
 $\sim$
2.7, so the GSP-Phot distance is likely unreliable. Bailer-Jones et al. (Reference Bailer-Jones, Rybizki, Fouesneau, Demleitner and Andrae2021) also provides geometric and photometric distances based on Galactic priors, which are
$\sim$
2.7, so the GSP-Phot distance is likely unreliable. Bailer-Jones et al. (Reference Bailer-Jones, Rybizki, Fouesneau, Demleitner and Andrae2021) also provides geometric and photometric distances based on Galactic priors, which are
 $3.3^{+2.6}_{-1.8}$
and
$3.3^{+2.6}_{-1.8}$
and
 $4.5^{+1.3}_{-1.0}$
kpc, respectively. The low parallax S/N causes the priors in both Bailer-Jones et al. (Reference Bailer-Jones, Rybizki, Fouesneau, Demleitner and Andrae2021) and Andrae et al. (Reference Andrae2023) to dominate the distance estimates, which can bias the results and likely explains the discrepancy with the DM-based distance of 1.8 and 2.2 kpc from the NE2001 and YMW16 electron density models, respectively. Given the unreliability in both the photometric and geometric distance estimates, we do not place much weight on the results. Nonetheless, the orbital period and observed photometric modulations confirm that Gaia1 is the companion to PSR J1728
$4.5^{+1.3}_{-1.0}$
kpc, respectively. The low parallax S/N causes the priors in both Bailer-Jones et al. (Reference Bailer-Jones, Rybizki, Fouesneau, Demleitner and Andrae2021) and Andrae et al. (Reference Andrae2023) to dominate the distance estimates, which can bias the results and likely explains the discrepancy with the DM-based distance of 1.8 and 2.2 kpc from the NE2001 and YMW16 electron density models, respectively. Given the unreliability in both the photometric and geometric distance estimates, we do not place much weight on the results. Nonetheless, the orbital period and observed photometric modulations confirm that Gaia1 is the companion to PSR J1728
 $-$
4608.
$-$
4608.

Figure 9.
Top panel: Radio folded lightcurve of PSR J1728
 $-$
4608 on the orbital period of 5.05 h, obtained through timing analysis. The flux density has been normalised to its maximum. See Section 4.2 for more details. Bottom panel: Gaia1 G-band optical light curve folded on the same orbital period. The orbital phase is computed with respect to
$-$
4608 on the orbital period of 5.05 h, obtained through timing analysis. The flux density has been normalised to its maximum. See Section 4.2 for more details. Bottom panel: Gaia1 G-band optical light curve folded on the same orbital period. The orbital phase is computed with respect to
 $T_{\rm asc}$
and shown over two consecutive cycles. See Section 4.2.2 for more details.
$T_{\rm asc}$
and shown over two consecutive cycles. See Section 4.2.2 for more details.
We did not obtain reliable results from the LCO photometry. In Section 4.2.2, we noted that SExtractor was used to deblend our target from its nearby companion. However, given the close separation of the two sources (1.36″), this deblending is not fully reliable and introduces significant uncertainties in the photometry. Consequently, we do not attempt any further analysis of these data.
4.3. Searching for
 $\gamma$
-ray pulsations
$\gamma$
-ray pulsations

We searched for
 $\gamma$
-ray pulsations from 4FGL J1728.0
$\gamma$
-ray pulsations from 4FGL J1728.0
 $-$
4606 using Fermi-LAT Pass 8 (P8R3) data (Bruel et al. Reference Bruel2018) in the energy range 0.1–100 GeV, covering the period from 2023-11-17 to 2025-05-02 (the span of our radio ephemeris). Events were selected within a 2
$-$
4606 using Fermi-LAT Pass 8 (P8R3) data (Bruel et al. Reference Bruel2018) in the energy range 0.1–100 GeV, covering the period from 2023-11-17 to 2025-05-02 (the span of our radio ephemeris). Events were selected within a 2
 $^\circ$
region of interest centred on the position of 4FGL J1728.0
$^\circ$
region of interest centred on the position of 4FGL J1728.0
 $-$
4606. No additional cuts were applied at this stage.
$-$
4606. No additional cuts were applied at this stage.

Figure 10. Spectrum of PSR J1728
 $-$
4608 fitted with a simple power-law, using flux densities corresponding to the inferior conjunction of the pulsar. The spectral index
$-$
4608 fitted with a simple power-law, using flux densities corresponding to the inferior conjunction of the pulsar. The spectral index
 $\alpha$
is highlighted on the figure. The marker colours are the same as in Figure 9. For more details, see Section 4.2.
$\alpha$
is highlighted on the figure. The marker colours are the same as in Figure 9. For more details, see Section 4.2.
Using the radio ephemeris and the Fermi plug-in for TEMPO2 (Ray et al. Reference Ray2011), we calculated the rotational phase for each photon arrival time from 4FGL J1728.0
 $-$
4606. We also split the data into three energy bands: 0.1–0.3, 0.3–1, and 10–100 GeV. In all bands, the resulting H-test statistics were below 8, corresponding to significance levels of less than
$-$
4606. We also split the data into three energy bands: 0.1–0.3, 0.3–1, and 10–100 GeV. In all bands, the resulting H-test statistics were below 8, corresponding to significance levels of less than
 $\sim2\sigma$
; the H-test is a statistical test for detecting periodic signals in sparse photon data (de Jager, Raubenheimer, & Swanepoel Reference de Jager, Raubenheimer and Swanepoel1989).We require at least
$\sim2\sigma$
; the H-test is a statistical test for detecting periodic signals in sparse photon data (de Jager, Raubenheimer, & Swanepoel Reference de Jager, Raubenheimer and Swanepoel1989).We require at least
 $5\sigma$
detection to confirm pulsations and thus find no statistically significant evidence in any energy range.
$5\sigma$
detection to confirm pulsations and thus find no statistically significant evidence in any energy range.
The lack of
 $\gamma$
-ray pulsations could be due to intrinsically low photon counts, high background emission levels in the Galactic plane, an unfavourable beaming geometry, or the limited precision of the current radio ephemeris. The relatively short radio ephemeris (
$\gamma$
-ray pulsations could be due to intrinsically low photon counts, high background emission levels in the Galactic plane, an unfavourable beaming geometry, or the limited precision of the current radio ephemeris. The relatively short radio ephemeris (
 $\sim 1.5$
yr) for PSR J1728
$\sim 1.5$
yr) for PSR J1728
 $-$
4608 does not determine the spin and orbital parameters precisely enough to coherently fold all LAT photons, which span back to 2008. In a more detailed analysis, standard event-quality and zenith-angle cuts could also be applied to reduce background contamination. A more in-depth search, such as a multidimensional grid over the uncertain parameters (e.g. Nieder et al. Reference Nieder2019), would be required to fully explore the
$-$
4608 does not determine the spin and orbital parameters precisely enough to coherently fold all LAT photons, which span back to 2008. In a more detailed analysis, standard event-quality and zenith-angle cuts could also be applied to reduce background contamination. A more in-depth search, such as a multidimensional grid over the uncertain parameters (e.g. Nieder et al. Reference Nieder2019), would be required to fully explore the
 $\gamma$
-ray pulsation parameter space, which is beyond the scope of this work.
$\gamma$
-ray pulsation parameter space, which is beyond the scope of this work.
Nevertheless, we still consider 4FGL J1728.0
 $-$
4606 a potential association based on positional coincidence and discuss its properties further in Section 5.3.
$-$
4606 a potential association based on positional coincidence and discuss its properties further in Section 5.3.
5. Discussion
5.1. Orbital period variation
From our timing analysis, we obtained a value of the orbital period derivative,
 $\dot{P}_{\mathrm{orb}}= 3.35(9)\times 10^{-10}$
. Variations in the orbital period are a characteristic feature observed in many spider pulsars and can arise from several astrophysical mechanisms. To investigate the possible causes of
$\dot{P}_{\mathrm{orb}}= 3.35(9)\times 10^{-10}$
. Variations in the orbital period are a characteristic feature observed in many spider pulsars and can arise from several astrophysical mechanisms. To investigate the possible causes of
 $\dot{P}_{\mathrm{orb}}$
, we follow the approach outlined Pletsch & Clark (Reference Pletsch and Clark2015), expressing the total change as:
$\dot{P}_{\mathrm{orb}}$
, we follow the approach outlined Pletsch & Clark (Reference Pletsch and Clark2015), expressing the total change as:
 \begin{equation}\dot{P}_{\mathrm{orb}} = \dot{P}_{\mathrm{GW}} + \dot{P}_{\mathrm{D}} + \dot{P}_\mathrm{M} + \dot{P}_\mathrm{Q},\end{equation}
where
 $\dot{P}_{\mathrm{GW}}$
is the contribution from gravitational-wave emission,
$\dot{P}_{\mathrm{GW}}$
is the contribution from gravitational-wave emission,
 $\dot{P}_{\mathrm{D}}$
arises from Doppler shifts due to system acceleration,
$\dot{P}_{\mathrm{D}}$
arises from Doppler shifts due to system acceleration,
 $\dot{P}_\mathrm{M}$
is due to mass loss from the binary system, and
$\dot{P}_\mathrm{M}$
is due to mass loss from the binary system, and
 $\dot{P}_\mathrm{Q}$
reflects variations in the gravitational quadrupole moment of the companion star.
$\dot{P}_\mathrm{Q}$
reflects variations in the gravitational quadrupole moment of the companion star.
Using Equation (5) from Pletsch & Clark (Reference Pletsch and Clark2015), we calculate the contribution from gravitational-wave emission as
 $\dot{P}_{\mathrm{GW}} = -4.6 \times 10^{-14}$
, which is four orders of magnitude smaller than the observed value. This suggests that gravitational radiation is unlikely to be the dominant cause of the orbital period variation.
$\dot{P}_{\mathrm{GW}} = -4.6 \times 10^{-14}$
, which is four orders of magnitude smaller than the observed value. This suggests that gravitational radiation is unlikely to be the dominant cause of the orbital period variation.
The term
 $\dot{P}_{\mathrm{D}}$
in Equation (5) is further decomposed into three components: the Shklovskii effect
$\dot{P}_{\mathrm{D}}$
in Equation (5) is further decomposed into three components: the Shklovskii effect
 $\dot{P}_\mathrm{Shk}$
arising from the system’s proper motion, the Galactic acceleration term
$\dot{P}_\mathrm{Shk}$
arising from the system’s proper motion, the Galactic acceleration term
 $\dot{P}_\mathrm{Gal}$
, and acceleration due to binary motion
$\dot{P}_\mathrm{Gal}$
, and acceleration due to binary motion
 $\dot{P}_\mathrm{acc}$
.
$\dot{P}_\mathrm{acc}$
.
Using Equation (7) from Pletsch & Clark (Reference Pletsch and Clark2015) and Gaia proper motions of
 $\mu_{\alpha} = 2.0936\ \mathrm{mas\ yr^{-1}}$
and
$\mu_{\alpha} = 2.0936\ \mathrm{mas\ yr^{-1}}$
and
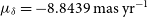 $\mu_{\delta} = -8.8439\ \mathrm{mas\ yr^{-1}}$
, we compute the Shklovskii contribution to be
$\mu_{\delta} = -8.8439\ \mathrm{mas\ yr^{-1}}$
, we compute the Shklovskii contribution to be
 $\dot{P}_\mathrm{Shk} = 1.2 \times 10^{-21}$
. Assuming any apparent orbital period change due to acceleration is proportional to the spin period derivative, we estimate
$\dot{P}_\mathrm{Shk} = 1.2 \times 10^{-21}$
. Assuming any apparent orbital period change due to acceleration is proportional to the spin period derivative, we estimate
 $\dot{P}_\mathrm{acc} = (\dot{P}/P)\times P_{\mathrm{orb}} = 5.0 \times 10^{-14}$
. The Galactic acceleration term,
$\dot{P}_\mathrm{acc} = (\dot{P}/P)\times P_{\mathrm{orb}} = 5.0 \times 10^{-14}$
. The Galactic acceleration term,
 $\dot{P}_\mathrm{Gal}$
, is typically smaller than the other two Doppler-related contributions (Lazaridis et al. Reference Lazaridis2009). Therefore, we approximate the overall
$\dot{P}_\mathrm{Gal}$
, is typically smaller than the other two Doppler-related contributions (Lazaridis et al. Reference Lazaridis2009). Therefore, we approximate the overall
 $\dot{P}_{\mathrm{D}}$
as
$\dot{P}_{\mathrm{D}}$
as
 $5 \times 10^{-14}$
. This value is four orders of magnitude smaller than the observed orbital period derivative, allowing us to rule out Doppler effects as the dominant cause.
$5 \times 10^{-14}$
. This value is four orders of magnitude smaller than the observed orbital period derivative, allowing us to rule out Doppler effects as the dominant cause.
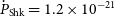
The
 $\dot P_{M}$
term is estimated using Equation (8) in Pletsch & Clark (Reference Pletsch and Clark2015). Assuming the companion star fills its Roche lobe (as calculated in Section 5.4), we obtained a mass loss rate of
$\dot P_{M}$
term is estimated using Equation (8) in Pletsch & Clark (Reference Pletsch and Clark2015). Assuming the companion star fills its Roche lobe (as calculated in Section 5.4), we obtained a mass loss rate of
 $\dot M = 9.3\times 10^{-10}$
 $\text{M}_{\odot} \text{yr}^{-1}$
. This gives
$\text{M}_{\odot} \text{yr}^{-1}$
. This gives
 $\dot P_{M} = -7.0\times 10^{-13}$
. This contribution is therefore not the primary driver of the observed orbital period variation.
$\dot P_{M} = -7.0\times 10^{-13}$
. This contribution is therefore not the primary driver of the observed orbital period variation.
Therefore, the dominating factor in
 $\dot{P}_{\mathrm{orb}}$
is thought to arise from the gravitational quadrupole moment of the companion (Matese & Whitmire Reference Matese and Whitmire1983), as discussed for several spider pulsars (e.g. Voisin et al. Reference Voisin2020; Lazaridis et al. Reference Lazaridis2011). Figure 11 shows
$\dot{P}_{\mathrm{orb}}$
is thought to arise from the gravitational quadrupole moment of the companion (Matese & Whitmire Reference Matese and Whitmire1983), as discussed for several spider pulsars (e.g. Voisin et al. Reference Voisin2020; Lazaridis et al. Reference Lazaridis2011). Figure 11 shows
 $\dot P_b$
against
$\dot P_b$
against
 $M_c$
for PSR J1728
$M_c$
for PSR J1728
 $-$
4608, alongside known spider pulsars with available measurements from the ATNF Pulsar Catalogue
Footnote
c
(Catalogue Version 2.6.0). Specifically, we include only binary pulsars outside globular clusters with companions classified as ultra-light or main-sequence,
$-$
4608, alongside known spider pulsars with available measurements from the ATNF Pulsar Catalogue
Footnote
c
(Catalogue Version 2.6.0). Specifically, we include only binary pulsars outside globular clusters with companions classified as ultra-light or main-sequence,
 $\text{M}_{c}\lt1\,\text{M}_{\odot}$
and
$\text{M}_{c}\lt1\,\text{M}_{\odot}$
and
 $P_{\mathrm{orb}}\leq1$
day. The figure shows that
$P_{\mathrm{orb}}\leq1$
day. The figure shows that
 $\dot P_b$
for PSR J1728
$\dot P_b$
for PSR J1728
 $-$
4608 lies within the parameter space occupied by other RBs.
$-$
4608 lies within the parameter space occupied by other RBs.

Figure 11. Orbital period derivative (
 $\dot P_{\mathrm{orb}}$
) against minimum companion mass (
$\dot P_{\mathrm{orb}}$
) against minimum companion mass (
 $M_c$
) for known RB (with main sequence companions) and BW (with ultra-light companions) spider pulsars from the ATNF catalogue, along with PSR J1728
$M_c$
) for known RB (with main sequence companions) and BW (with ultra-light companions) spider pulsars from the ATNF catalogue, along with PSR J1728
 $-$
4608. The colour map indicated the pulsar’s orbital period (
$-$
4608. The colour map indicated the pulsar’s orbital period (
 $P_{\mathrm{orb}}$
) value. The derived values for PSR J1728
$P_{\mathrm{orb}}$
) value. The derived values for PSR J1728
 $-$
4608 are given in Table 2.
$-$
4608 are given in Table 2.
5.2. Optical light-curve morphology
The optical light curves of RB pulsars are either dominated by irradiation or ellipsoidal modulation. Ellipsoidal modulations are observed in about 50% of known RB systems, where the companion’s shape, rather than irradiation, dominates the light curve. Examples include PSR J1622
 $-$
0315 (
$-$
0315 (
 $P_B$
= 3.9h; Turchetta et al. Reference Turchetta, Linares, Koljonen and Sen2023), PSR J1431
$P_B$
= 3.9h; Turchetta et al. Reference Turchetta, Linares, Koljonen and Sen2023), PSR J1431
 $-$
4715 (
$-$
4715 (
 $P_B = 10.8$
10.8h; Strader et al. Reference Strader2019), and PSR J1628
$P_B = 10.8$
10.8h; Strader et al. Reference Strader2019), and PSR J1628
 $-$
320 (
$-$
320 (
 $P_B = 5.0$
5.0 h; Li, Halpern, & Thorstensen Reference Li, Halpern and Thorstensen2014). This difference arises from the interplay of several factors, such as the companion’s intrinsic luminosity, the mass ratio, orbital separation, and the pulsar’s spin-down luminosity.
$P_B = 5.0$
5.0 h; Li, Halpern, & Thorstensen Reference Li, Halpern and Thorstensen2014). This difference arises from the interplay of several factors, such as the companion’s intrinsic luminosity, the mass ratio, orbital separation, and the pulsar’s spin-down luminosity.
In Section 4.2.2, we saw that the Gaia1 G-band light curve shows consistency with ellipsoidal modulation. The magnitude of irradiation is quantified through the dimensionless ratio
 $f_{\rm sd}$
(Turchetta et al. Reference Turchetta, Linares, Koljonen and Sen2023):
$f_{\rm sd}$
(Turchetta et al. Reference Turchetta, Linares, Koljonen and Sen2023):
 \begin{align} f_{\mathrm{sd}} \simeq 1.1 \times 10^4 \left( \frac{L_{\mathrm{sd}}}{10^{34}\,\mathrm{erg\,s^{-1}}} \right) \left( \frac{T_\mathrm{eff}}{10^3\,\mathrm{K}} \right)^{-4} \\[2pt] \nonumber \times \left( \frac{M_\mathrm{tot}}{M_{\odot}} \right)^{-2/3} \left( \frac{P_{\mathrm{orb}}}{1\,\mathrm{h}} \right)^{-4/3} \end{align}
where
 $L_{\mathrm{sd}}$
is the pulsar spin-down luminosity and
$L_{\mathrm{sd}}$
is the pulsar spin-down luminosity and
 $M_\mathrm{tot}$
is the total mass of the system. For our system, we use
$M_\mathrm{tot}$
is the total mass of the system. For our system, we use
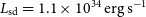 $L_{\mathrm{sd}}=1.1\times10^{34}\,\mathrm{erg\,s^{-1}}$
,
$L_{\mathrm{sd}}=1.1\times10^{34}\,\mathrm{erg\,s^{-1}}$
,
 $M_\mathrm{tot}=1.53$
M
$M_\mathrm{tot}=1.53$
M
 $_{\odot}$
, and
$_{\odot}$
, and
 ${T}_{\rm eff}=4\,384$
K (see Section 4.2.2).
${T}_{\rm eff}=4\,384$
K (see Section 4.2.2).
We estimate
 $f_{\mathrm{sd}} \approx 2.9$
for our system, which lies in the transition region between the ellipsoidal modulation and irradiation. The transition is expected to occur between
$f_{\mathrm{sd}} \approx 2.9$
for our system, which lies in the transition region between the ellipsoidal modulation and irradiation. The transition is expected to occur between
 $f_{\mathrm{sd}}=$
2–4 (Turchetta et al. Reference Turchetta, Linares, Koljonen and Sen2023). Figure 12 shows
$f_{\mathrm{sd}}=$
2–4 (Turchetta et al. Reference Turchetta, Linares, Koljonen and Sen2023). Figure 12 shows
 $L_{\mathrm{sd}}$
versus
$L_{\mathrm{sd}}$
versus
 $P_{\mathrm{orb}}$
for known RB pulsars (using the data from Table (1) of Turchetta et al. (Reference Turchetta, Linares, Koljonen and Sen2023), along with PSR J1728
$P_{\mathrm{orb}}$
for known RB pulsars (using the data from Table (1) of Turchetta et al. (Reference Turchetta, Linares, Koljonen and Sen2023), along with PSR J1728
 $-$
4608, illustrating that our source resides in this intermediate regime.
$-$
4608, illustrating that our source resides in this intermediate regime.

Figure 12.
 $L_{\mathrm{sd}}$
versus
$L_{\mathrm{sd}}$
versus
 $P_{\mathrm{orb}}$
for known RB pulsars, along with PSR J1728
$P_{\mathrm{orb}}$
for known RB pulsars, along with PSR J1728
 $-$
4608. This relation
$-$
4608. This relation
 $L_{\mathrm{sd}} \propto P_{\mathrm{orb}}^{4/3}$
is shown for
$L_{\mathrm{sd}} \propto P_{\mathrm{orb}}^{4/3}$
is shown for
 $f_{\mathrm{sd}}=2$
(solid line) and
$f_{\mathrm{sd}}=2$
(solid line) and
 $f_{\mathrm{sd}}=4$
(dashed line) assuming our source parameters
$f_{\mathrm{sd}}=4$
(dashed line) assuming our source parameters
 ${T}_{\rm eff}$
= 4 384 K, and
${T}_{\rm eff}$
= 4 384 K, and
 ${M}_{\rm tot} = 1.5\,\text{M}_{\odot}$
. The points are colored according to the number of maxima in the optical light curve per orbit, with black indicating two maxima and orange indicating one. The figure has been adapted from Turchetta et al. (Reference Turchetta, Linares, Koljonen and Sen2023); see Section 5.2 for further details.
${M}_{\rm tot} = 1.5\,\text{M}_{\odot}$
. The points are colored according to the number of maxima in the optical light curve per orbit, with black indicating two maxima and orange indicating one. The figure has been adapted from Turchetta et al. (Reference Turchetta, Linares, Koljonen and Sen2023); see Section 5.2 for further details.

Figure 13.
Left:
 $L_{\gamma}$
vs.
$L_{\gamma}$
vs.
 $\dot{E}$
for known Fermi pulsars in the 4FGL catalogue, along with PSR J1728
$\dot{E}$
for known Fermi pulsars in the 4FGL catalogue, along with PSR J1728
 $-$
4608. Dashed vertical lines indicate lines of constant
$-$
4608. Dashed vertical lines indicate lines of constant
 $\gamma$
-ray efficiency,
$\gamma$
-ray efficiency,
 $\eta$
. Right:
$\eta$
. Right:
 $\gamma$
-ray variability index vs. spectral curvature significance for 4FGL pulsars, with PSR J1728
$\gamma$
-ray variability index vs. spectral curvature significance for 4FGL pulsars, with PSR J1728
 $-$
4608 highlighted. See Section 5.3 for details.
$-$
4608 highlighted. See Section 5.3 for details.
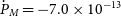
5.3. Fermi association
In Section 2.3.1 we presented the closest Fermi
 $\gamma$
-ray source as 4FGL J1728.0-4606, which lies 2’ from PSR J1728
$\gamma$
-ray source as 4FGL J1728.0-4606, which lies 2’ from PSR J1728
 $-$
4608. We analysed the properties of 4FGL J1728.0
$-$
4608. We analysed the properties of 4FGL J1728.0
 $-$
4606 to see if they are consistent with other known
$-$
4606 to see if they are consistent with other known
 $\gamma$
-ray pulsars in the 4FGL catalogue. The left panel in Figure 13 shows
$\gamma$
-ray pulsars in the 4FGL catalogue. The left panel in Figure 13 shows
 $\dot E$
of known
$\dot E$
of known
 $\gamma$
-ray pulsars (obtained by cross-matching the 4FGL catalogue with the ATNF catalogue) against
$\gamma$
-ray pulsars (obtained by cross-matching the 4FGL catalogue with the ATNF catalogue) against
 $\gamma$
-ray luminosity (
$\gamma$
-ray luminosity (
 $L_{\gamma}$
) (from the 4FGL catalogue).
$L_{\gamma}$
) (from the 4FGL catalogue).
 $L_{\gamma}$
is calculated using
$L_{\gamma}$
is calculated using
 $L_{\gamma} = 4\pi d^2G_{100}$
, where
$L_{\gamma} = 4\pi d^2G_{100}$
, where
 $G_{100}$
is the measured energy flux (from 100 to 100 GeV) available in the 4FGL catalogue, and d is the distance derived from the DM of the sources in the ATNF catalogue. Using the d estimated from the YMW16 model (as listed in Table 2) and
$G_{100}$
is the measured energy flux (from 100 to 100 GeV) available in the 4FGL catalogue, and d is the distance derived from the DM of the sources in the ATNF catalogue. Using the d estimated from the YMW16 model (as listed in Table 2) and
 $G_{100}$
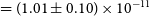 $= (1.01 \pm 0.10) \times 10^{-11}$
erg cm
$= (1.01 \pm 0.10) \times 10^{-11}$
erg cm
 $^{-2}$
s
$^{-2}$
s
 $^{-1}$
(between 100 MeV–100 GeV),
$^{-1}$
(between 100 MeV–100 GeV),
 $L_{\gamma}$
of 4FGL J1728.0-4606 is calculated to be
$L_{\gamma}$
of 4FGL J1728.0-4606 is calculated to be
 $5.85\times10^{33}\mathrm{erg/s}$
. The figure illustrates that 4FGL J1728.0-4606 sits in the parameter space of other known
$5.85\times10^{33}\mathrm{erg/s}$
. The figure illustrates that 4FGL J1728.0-4606 sits in the parameter space of other known
 $\gamma$
-ray pulsars. We calculated a
$\gamma$
-ray pulsars. We calculated a
 $\gamma$
-ray conversion efficiency
$\gamma$
-ray conversion efficiency
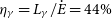 $\eta_{\gamma} =L_{\gamma} /\dot E=44\% $
.
$\eta_{\gamma} =L_{\gamma} /\dot E=44\% $
.
The right panel of Figure 13 shows the
 $\gamma$
-ray spectral curvature significance against the
$\gamma$
-ray spectral curvature significance against the
 $\gamma$
-ray variability index. Pulsars are steady
$\gamma$
-ray variability index. Pulsars are steady
 $\gamma$
-ray emitters and are therefore expected to exhibit low variability indices (typically
$\gamma$
-ray emitters and are therefore expected to exhibit low variability indices (typically
 $\lt27$
; Abdollahi et al. Reference Abdollahi2020). The spectral curvature significance quantifies the deviation of the
$\lt27$
; Abdollahi et al. Reference Abdollahi2020). The spectral curvature significance quantifies the deviation of the
 $\gamma$
-ray spectrum from a simple power law and is typically greater than
$\gamma$
-ray spectrum from a simple power law and is typically greater than
 $3\sigma$
for pulsars, which are known to have curved spectra. Our system is consistent with the properties of previously identified RB pulsars.
$3\sigma$
for pulsars, which are known to have curved spectra. Our system is consistent with the properties of previously identified RB pulsars.
5.4. Probing the eclipse mechanism
In the following section, we explore possible eclipse mechanisms proposed by Thompson et al. (Reference Thompson, Blandford, Evans and Phinney1994) that could be responsible for the observed eclipses in PSR J1728
 $-$
4608. The size of the companions’ Roche lobe(
$-$
4608. The size of the companions’ Roche lobe(
 $R_L$
) is estimated using Equation (1) in Eggleton (Reference Eggleton1983) and is found to be 0.04 R
$R_L$
) is estimated using Equation (1) in Eggleton (Reference Eggleton1983) and is found to be 0.04 R
 $_{\odot}$
. The eclipse radius, given by
$_{\odot}$
. The eclipse radius, given by
 $R_E=\pi a\Delta {\unicode{x03D5}}$
where
$R_E=\pi a\Delta {\unicode{x03D5}}$
where
 $\Delta {\unicode{x03D5}} = {\unicode{x03D5}}_{e} - {\unicode{x03D5}}_{i}$
, is found to be 0.12 R
$\Delta {\unicode{x03D5}} = {\unicode{x03D5}}_{e} - {\unicode{x03D5}}_{i}$
, is found to be 0.12 R
 $_{\odot}$
(
$_{\odot}$
(
 $\sim2.5R_L$
). This suggests that the material causing the eclipses extends beyond the companion’s
$\sim2.5R_L$
). This suggests that the material causing the eclipses extends beyond the companion’s
 $R_L$
.
$R_L$
.
The first eclipse mechanism we consider by Thompson et al. (Reference Thompson, Blandford, Evans and Phinney1994) is due to the plasma frequency. Eclipses can be caused when the radio wave frequency is lower than the plasma frequency in the medium. We calculate the electron density
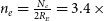 $n_e = \frac{N_e}{2R_E} = 3.4\,\times$
 $10^8\mathrm{cm}^{-3}$
. The plasma cut-off frequency is given by
$10^8\mathrm{cm}^{-3}$
. The plasma cut-off frequency is given by
 $f_p = 8.5\ [\frac{n_e}{\mathrm{cm}^{-2}}]^\frac{1}{2}$
kHz and is calculated to be 160 MHz. Eclipses are observed above this frequency, so we rule out plasma frequency as a potential eclipse mechanism.
$f_p = 8.5\ [\frac{n_e}{\mathrm{cm}^{-2}}]^\frac{1}{2}$
kHz and is calculated to be 160 MHz. Eclipses are observed above this frequency, so we rule out plasma frequency as a potential eclipse mechanism.
Eclipses due to refraction can also be ruled out, as
 $\sim$
10–100 ms delays are expected for refraction.
$\sim$
10–100 ms delays are expected for refraction.
Scattering of radio waves can cause eclipses if the pulse broadens beyond the pulsar’s spin period. We consider a total DM of 67.4856 pc cm−3, consisting of the non-eclipse phase DM of 65.4856 pc cm−3 plus an excess of 2.0 pc cm−3 from the eclipse region. We calculate the scattering timescale to be 9.9
 ${\unicode{x03BC}}$
s at 1 GHz, using Equation (7) from Lewandowski, Kowalińska, & Kijak (2015). This is substantially shorter than the pulsar’s spin period, so scattering cannot account for the eclipse, and we therefore rule out scattering as the dominant mechanism.
${\unicode{x03BC}}$
s at 1 GHz, using Equation (7) from Lewandowski, Kowalińska, & Kijak (2015). This is substantially shorter than the pulsar’s spin period, so scattering cannot account for the eclipse, and we therefore rule out scattering as the dominant mechanism.
We next consider free-free absorption as a possible eclipse mechanism. At 2 368 MHz we find
 $N_e = 5.9\times10^{18}$
 $\mathrm{cm}^{-2}$
, and the absorption length
$\mathrm{cm}^{-2}$
, and the absorption length
 $L=2R_E$
. Using Equation (11) of Thompson et al.(Reference Thompson, Blandford, Evans and Phinney1994) and the condition that
$L=2R_E$
. Using Equation (11) of Thompson et al.(Reference Thompson, Blandford, Evans and Phinney1994) and the condition that
 $\tau_{\mathrm{ff}}\gt 1$
, we find the following condition
$\tau_{\mathrm{ff}}\gt 1$
, we find the following condition
 $T\geq10^5 f_{\rm cl}^{\frac{3}{2}}$
, where T is the temperature and
$T\geq10^5 f_{\rm cl}^{\frac{3}{2}}$
, where T is the temperature and
 $f_{\rm cl}$
(
$f_{\rm cl}$
(
 $= \frac{\langle n_{e}^2 \rangle}{\langle n_{e} \rangle ^2} $
) is the clumping factor of the eclipsing medium. For free-free absorption to be a valid eclipse mechanism, very low temperatures or a very high clumping factor are required. Neither is possible in this system, as the temperature of the stellar wind is typically
$= \frac{\langle n_{e}^2 \rangle}{\langle n_{e} \rangle ^2} $
) is the clumping factor of the eclipsing medium. For free-free absorption to be a valid eclipse mechanism, very low temperatures or a very high clumping factor are required. Neither is possible in this system, as the temperature of the stellar wind is typically
 $10^8$
–
$10^8$
–
 $10^9$
K, and a high
$10^9$
K, and a high
 $f_{\rm cl}$
is not possible in the eclipse environment (Thompson et al. Reference Thompson, Blandford, Evans and Phinney1994). Therefore, we rule out free-free absorption as a valid eclipse mechanism.
$f_{\rm cl}$
is not possible in the eclipse environment (Thompson et al. Reference Thompson, Blandford, Evans and Phinney1994). Therefore, we rule out free-free absorption as a valid eclipse mechanism.
We consider induced Compton scattering as a possible mechanism and calculate the optical depth (
 $\tau_{\mathrm{ICS}}$
) using Equation (11) of Thompson et al. (Reference Thompson, Blandford, Evans and Phinney1994). Using the radiometer equation, we calculate a pulsed flux density of 57
$\tau_{\mathrm{ICS}}$
) using Equation (11) of Thompson et al. (Reference Thompson, Blandford, Evans and Phinney1994). Using the radiometer equation, we calculate a pulsed flux density of 57
 ${\unicode{x03BC}}$
Jy at 2 368 MHz. Using the distance of 2.2 kpc (see Table 2), a spectral index of
${\unicode{x03BC}}$
Jy at 2 368 MHz. Using the distance of 2.2 kpc (see Table 2), a spectral index of
 $-1.81$
and a magnification factor
$-1.81$
and a magnification factor
 $M=1$
, we derive a value of
$M=1$
, we derive a value of
 $\tau _{\mathrm{ind}} = 0.005$
. Since this value is
$\tau _{\mathrm{ind}} = 0.005$
. Since this value is
 $\lt\!\lt$
1, induced Compton scattering can be excluded as a significant contributor to the observed eclipses.
$\lt\!\lt$
1, induced Compton scattering can be excluded as a significant contributor to the observed eclipses.
Next, we consider cyclotron absorption. We calculate the characteristic magnetic field (
 $B_E$
) by equating the plasma energy density
$B_E$
) by equating the plasma energy density
 $P_{B}=\frac{B_{E}^2}{8\pi}$
to the pulsar wind energy density
$P_{B}=\frac{B_{E}^2}{8\pi}$
to the pulsar wind energy density
 $U_E = \frac{\dot{E}}{4\pi c a^2}$
, obtaining a value of
$U_E = \frac{\dot{E}}{4\pi c a^2}$
, obtaining a value of
 $B_E=$
83 G. The cyclotron frequency,
$B_E=$
83 G. The cyclotron frequency,
 $\nu_{B}=\frac{eB}{2\pi m_{e}c}$
is calculated to be approximately 230 MHz, where
$\nu_{B}=\frac{eB}{2\pi m_{e}c}$
is calculated to be approximately 230 MHz, where
 $m_e$
is the mass of the electron, e is the charge on the electron, and c is the speed of light. The cyclotron harmonic (m) is found to be 10 at observing frequency 2 368 MHz, calculated using
$m_e$
is the mass of the electron, e is the charge on the electron, and c is the speed of light. The cyclotron harmonic (m) is found to be 10 at observing frequency 2 368 MHz, calculated using
 $m=\frac{\nu}{\nu_{B}}$
. Using Equation (43) in Thompson et al. (Reference Thompson, Blandford, Evans and Phinney1994), we find that
$m=\frac{\nu}{\nu_{B}}$
. Using Equation (43) in Thompson et al. (Reference Thompson, Blandford, Evans and Phinney1994), we find that
 $T\geq6\times10^7$
K. For cyclotron absorption to be valid,
$T\geq6\times10^7$
K. For cyclotron absorption to be valid,
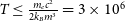 $T\leq \frac{m_e c^2}{2k_Bm^3} = 3\times10^6$
K (Equation (C2) in Thompson et al. Reference Thompson, Blandford, Evans and Phinney1994). Therefore, we rule out cyclotron absorption as an eclipse mechanism.
$T\leq \frac{m_e c^2}{2k_Bm^3} = 3\times10^6$
K (Equation (C2) in Thompson et al. Reference Thompson, Blandford, Evans and Phinney1994). Therefore, we rule out cyclotron absorption as an eclipse mechanism.
Lastly, we consider synchrotron absorption, which arises from a population of non-thermal electrons, typically assumed to follow a power-law energy distribution of the form
 $n(E)=n_{0}E^{-p}$
, where p is the power-law index (Thompson et al. Reference Thompson, Blandford, Evans and Phinney1994). The corresponding optical depth is given by (Thompson et al. Reference Thompson, Blandford, Evans and Phinney1994):
$n(E)=n_{0}E^{-p}$
, where p is the power-law index (Thompson et al. Reference Thompson, Blandford, Evans and Phinney1994). The corresponding optical depth is given by (Thompson et al. Reference Thompson, Blandford, Evans and Phinney1994):
 \begin{equation} \tau_{\text{sync}(\nu)} = \left(\frac{ 3^\frac{(p+1)}{2} \Gamma \left( \frac{3p + 2}{12} \right) \, \Gamma \left( \frac{3p + 22}{12} \right)}{4}\right) \left( \frac{\sin \theta}{m} \right)^{\frac{p+2}{2}} \frac{n_0 e^2}{m_e c \, \nu } L \end{equation}
where
 $\theta$
is the angle between the magnetic field and the line of sight and
$\theta$
is the angle between the magnetic field and the line of sight and
 $n_0$
is the number density of non-thermal electrons, typically taken to be
$n_0$
is the number density of non-thermal electrons, typically taken to be
 $\sim$
1% of the total electron density (Thompson et al. Reference Thompson, Blandford, Evans and Phinney1994).
$\sim$
1% of the total electron density (Thompson et al. Reference Thompson, Blandford, Evans and Phinney1994).
To evaluate synchrotron absorption as a potential eclipse mechanism in our system, we compute the optical depth
 $\tau_{\text{sync}(\nu)}$
using Equation (7) at a frequency of 2 368 MHz. We vary p over the range 2–8 and
$\tau_{\text{sync}(\nu)}$
using Equation (7) at a frequency of 2 368 MHz. We vary p over the range 2–8 and
 $\theta$
between 0.5 and 1.5 radians. We find that for
$\theta$
between 0.5 and 1.5 radians. We find that for
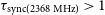 $\tau_{\text{sync}(2368\,\mathrm{MHz})} \gt 1$
, the parameters must satisfy
$\tau_{\text{sync}(2368\,\mathrm{MHz})} \gt 1$
, the parameters must satisfy
 $\theta \gt 0.61$
radians and
$\theta \gt 0.61$
radians and
 $p \geq 2 $
. For synchrotron absorption by non-thermal electrons, p can vary between 2–7, m between 10–100, and
$p \geq 2 $
. For synchrotron absorption by non-thermal electrons, p can vary between 2–7, m between 10–100, and
 $\theta$
between 0.3–1.40 radians (Dulk & Marsh Reference Dulk and Marsh1982). For mildly relativistic electrons, p is expected to fall within the range 2–3. (Takakura & Scalise Reference Takakura and Scalise1970; Ramaty Reference Ramaty1969). In our system, the calculated values of p,
$\theta$
between 0.3–1.40 radians (Dulk & Marsh Reference Dulk and Marsh1982). For mildly relativistic electrons, p is expected to fall within the range 2–3. (Takakura & Scalise Reference Takakura and Scalise1970; Ramaty Reference Ramaty1969). In our system, the calculated values of p,
 $\theta$
, and m all fall within the theoretical ranges. Thus, we conclude that synchrotron absorption is the most plausible eclipse mechanism for PSR J1728
$\theta$
, and m all fall within the theoretical ranges. Thus, we conclude that synchrotron absorption is the most plausible eclipse mechanism for PSR J1728
 $-$
4608.
$-$
4608.
6. Conclusions
In this paper, we report the study of PSR J1728
 $-$
4608, an RB eclipsing MSP with a spin period of 2.86 ms, a DM of 65.5 cm
$-$
4608, an RB eclipsing MSP with a spin period of 2.86 ms, a DM of 65.5 cm
 $^{-3}$
pc, and a 5.05 h orbital period with a minimum companion mass of 0.13 M
$^{-3}$
pc, and a 5.05 h orbital period with a minimum companion mass of 0.13 M
 $_{\odot}$
.
$_{\odot}$
.
Timing studies revealed a
 $DM_{\rm excess}$
of
$DM_{\rm excess}$
of
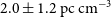 $2.0 \pm 1.2 \ \mathrm{pc\ cm^{-3}}$
, corresponding to an electron column density of
$2.0 \pm 1.2 \ \mathrm{pc\ cm^{-3}}$
, corresponding to an electron column density of
 $5.9 \pm 3.6 \times10^{18} \ \mathrm{cm^{-2}}$
. We find that synchrotron absorption is the most plausible eclipse mechanism in this system. Several other spider pulsars also show evidence for synchrotron absorption as the dominant process, such as PSR J1431
$5.9 \pm 3.6 \times10^{18} \ \mathrm{cm^{-2}}$
. We find that synchrotron absorption is the most plausible eclipse mechanism in this system. Several other spider pulsars also show evidence for synchrotron absorption as the dominant process, such as PSR J1431
 $-$
4715 (Kumari et al. Reference Kumari2024) and PSR J1908
$-$
4715 (Kumari et al. Reference Kumari2024) and PSR J1908
 $+$
2105 (Ghosh et al. 2025). Polarisation studies near the eclipse boundaries can help reveal the magnetic properties of the eclipsing medium.
$+$
2105 (Ghosh et al. 2025). Polarisation studies near the eclipse boundaries can help reveal the magnetic properties of the eclipsing medium.
PSR J1728
 $-$
4608 also exhibits orbital period variability, with a significant first-order orbital period derivative consistent with other known RB pulsars. This variability is likely driven by changes in the companion star’s gravitational quadrupole moment due to shape deformations over time, providing insight into the long-term evolution of the binary system.
$-$
4608 also exhibits orbital period variability, with a significant first-order orbital period derivative consistent with other known RB pulsars. This variability is likely driven by changes in the companion star’s gravitational quadrupole moment due to shape deformations over time, providing insight into the long-term evolution of the binary system.
Archival data identified a Gaia optical counterpart within
 $0.5''$
of the radio position. The G-band light curve shows behaviour consistent with both ellipsoidal modulation and irradiation of the companion star. High-sensitivity optical follow-up with a
$0.5''$
of the radio position. The G-band light curve shows behaviour consistent with both ellipsoidal modulation and irradiation of the companion star. High-sensitivity optical follow-up with a
 $\gt$
1-m telescope, sufficient to resolve the nearby sources, will enable study of colour evolution and further characterise the system, as indicated by the LCO data.
$\gt$
1-m telescope, sufficient to resolve the nearby sources, will enable study of colour evolution and further characterise the system, as indicated by the LCO data.
Finally, the detection of additional RB systems through imaging surveys, such as VAST, will expand the known sample, thereby improving our understanding of orbital dynamics, eclipsing mechanisms, and the evolutionary processes shaping these binaries.
Acknowledgements
YW acknowledges the support of the Australian Research Council (ARC) grant DP220102305. YW acknowledges support through ARC Future Fellowship FT190100155. N.H.-W. is the recipient of an Australian Research Council Future Fellowship (project number FT190100231).
This scientific work uses data obtained from Inyarrimanha Ilgari Bundara/the CSIRO Murchison Radio-astronomy Observatory. We acknowledge the Wajarri Yamaji People as the Traditional Owners and native title holders of the Observatory site. CSIRO’s ASKAP radio telescope is part of the Australia Telescope National Facility (https://ror.org/05qajvd42). Operation of ASKAP is funded by the Australian Government with support from the National Collaborative Research Infrastructure Strategy. ASKAP uses the resources of the Pawsey Supercomputing Research Centre. Establishment of ASKAP, Inyarrimanha Ilgari Bundara, the CSIRO Murchison Radio-astronomy Observatory and the Pawsey Supercomputing Research Centre are initiatives of the Australian Government, with support from the Government of Western Australia and the Science and Industry Endowment Fund. The Australia Telescope Compact Array is part of the Australia Telescope National Facility (https://ror.org/05qajvd42), which is funded by the Australian Government for operation as a National Facility managed by CSIRO. We acknowledge the Gomeroi people as the Traditional Owners of the Observatory site. Murriyang, the Parkes radio telescope, is part of the Australia Telescope National Facility (https://ror.org/05qajvd42), which is funded by the Australian Government for operation as a National Facility managed by CSIRO. We acknowledge the Wiradjuri people as the Traditional Owners of the Observatory site. Parts of this research were conducted by the Australian Research Council Centre of Excellence for Gravitational Wave Discovery (OzGrav), through project number CE230100016. This work used resources of China SKA Regional Centre prototype (An et al. Reference An, Wu and Hong2019, 2022) funded by National SKA Program of China (2022SKA0130103) and the National Key R&D Programme of China (2018YFA0404603). This research has made use of the VizieR catalogue access tool, CDS, Strasbourg, France (DOI: 10.26093/cds/vizier). The original description of the VizieR service was published in Ochsenbein, Bauer, & Marcout (Reference Ochsenbein, Bauer and Marcout2000).
We acknowledge the Pawsey Supercomputing Centre, which is supported by the Western Australian and Australian Governments. The MeerKAT telescope is operated by the South African Radio Astronomy Observatory, which is a facility of the National Research Foundation, an agency of the Department of Science and Innovation. This work has made use of the ‘MPIfR S-band receiver system’ designed, constructed and maintained with funding of the MPI für Radioastronomy and the Max-Planck-Society. Observations made use of the Pulsar Timing User Supplied Equipment (PTUSE) servers at MeerKAT, which were funded by the MeerTime Collaboration members ASTRON, AUT, CSIRO, ICRAR-Curtin, MPIfR, INAF, NRAO, Swinburne University of Technology, the University of Oxford, UBC, and the University of Manchester. The system design and integration was led by Swinburne University of Technology and Auckland University of Technology in collaboration with SARAO and supported by the ARC Centre of Excellence for Gravitational Wave Discovery (OzGrav) under grant CE170100004. We thank the staff of the GMRT who made these observations possible. GMRT is run by the National Centre for Radio Astrophysics of the Tata Institute of Fundamental Research.
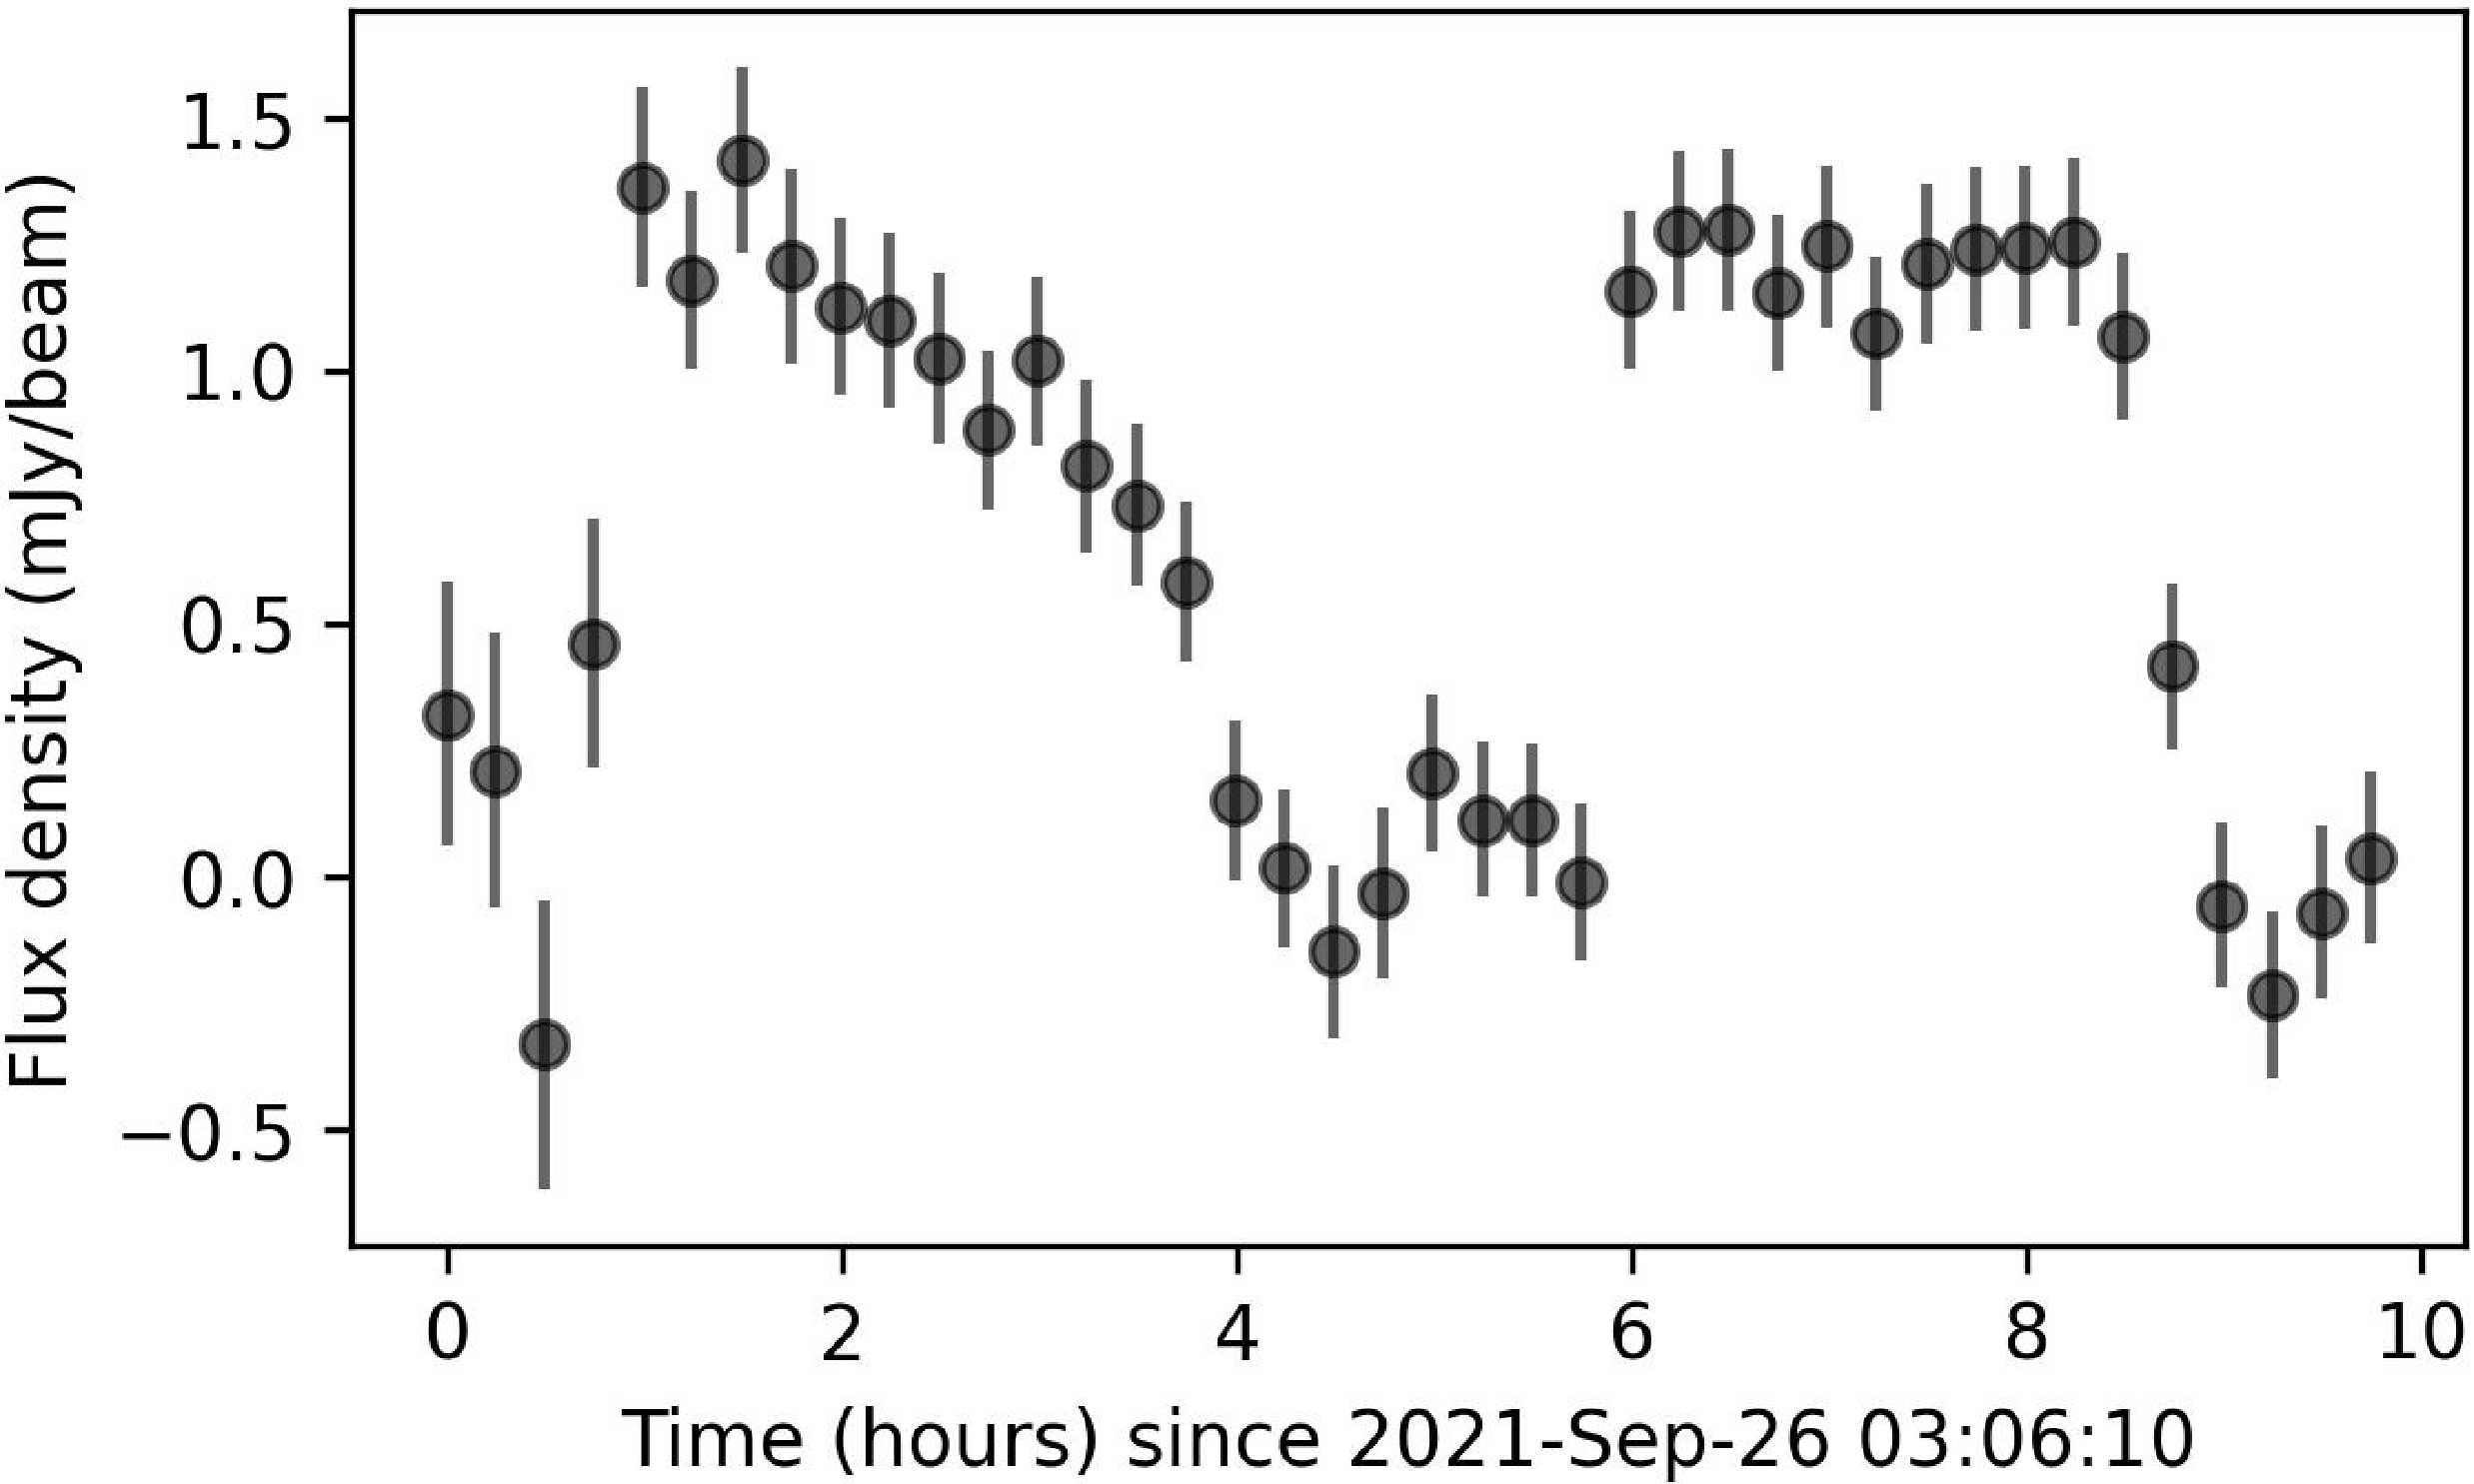

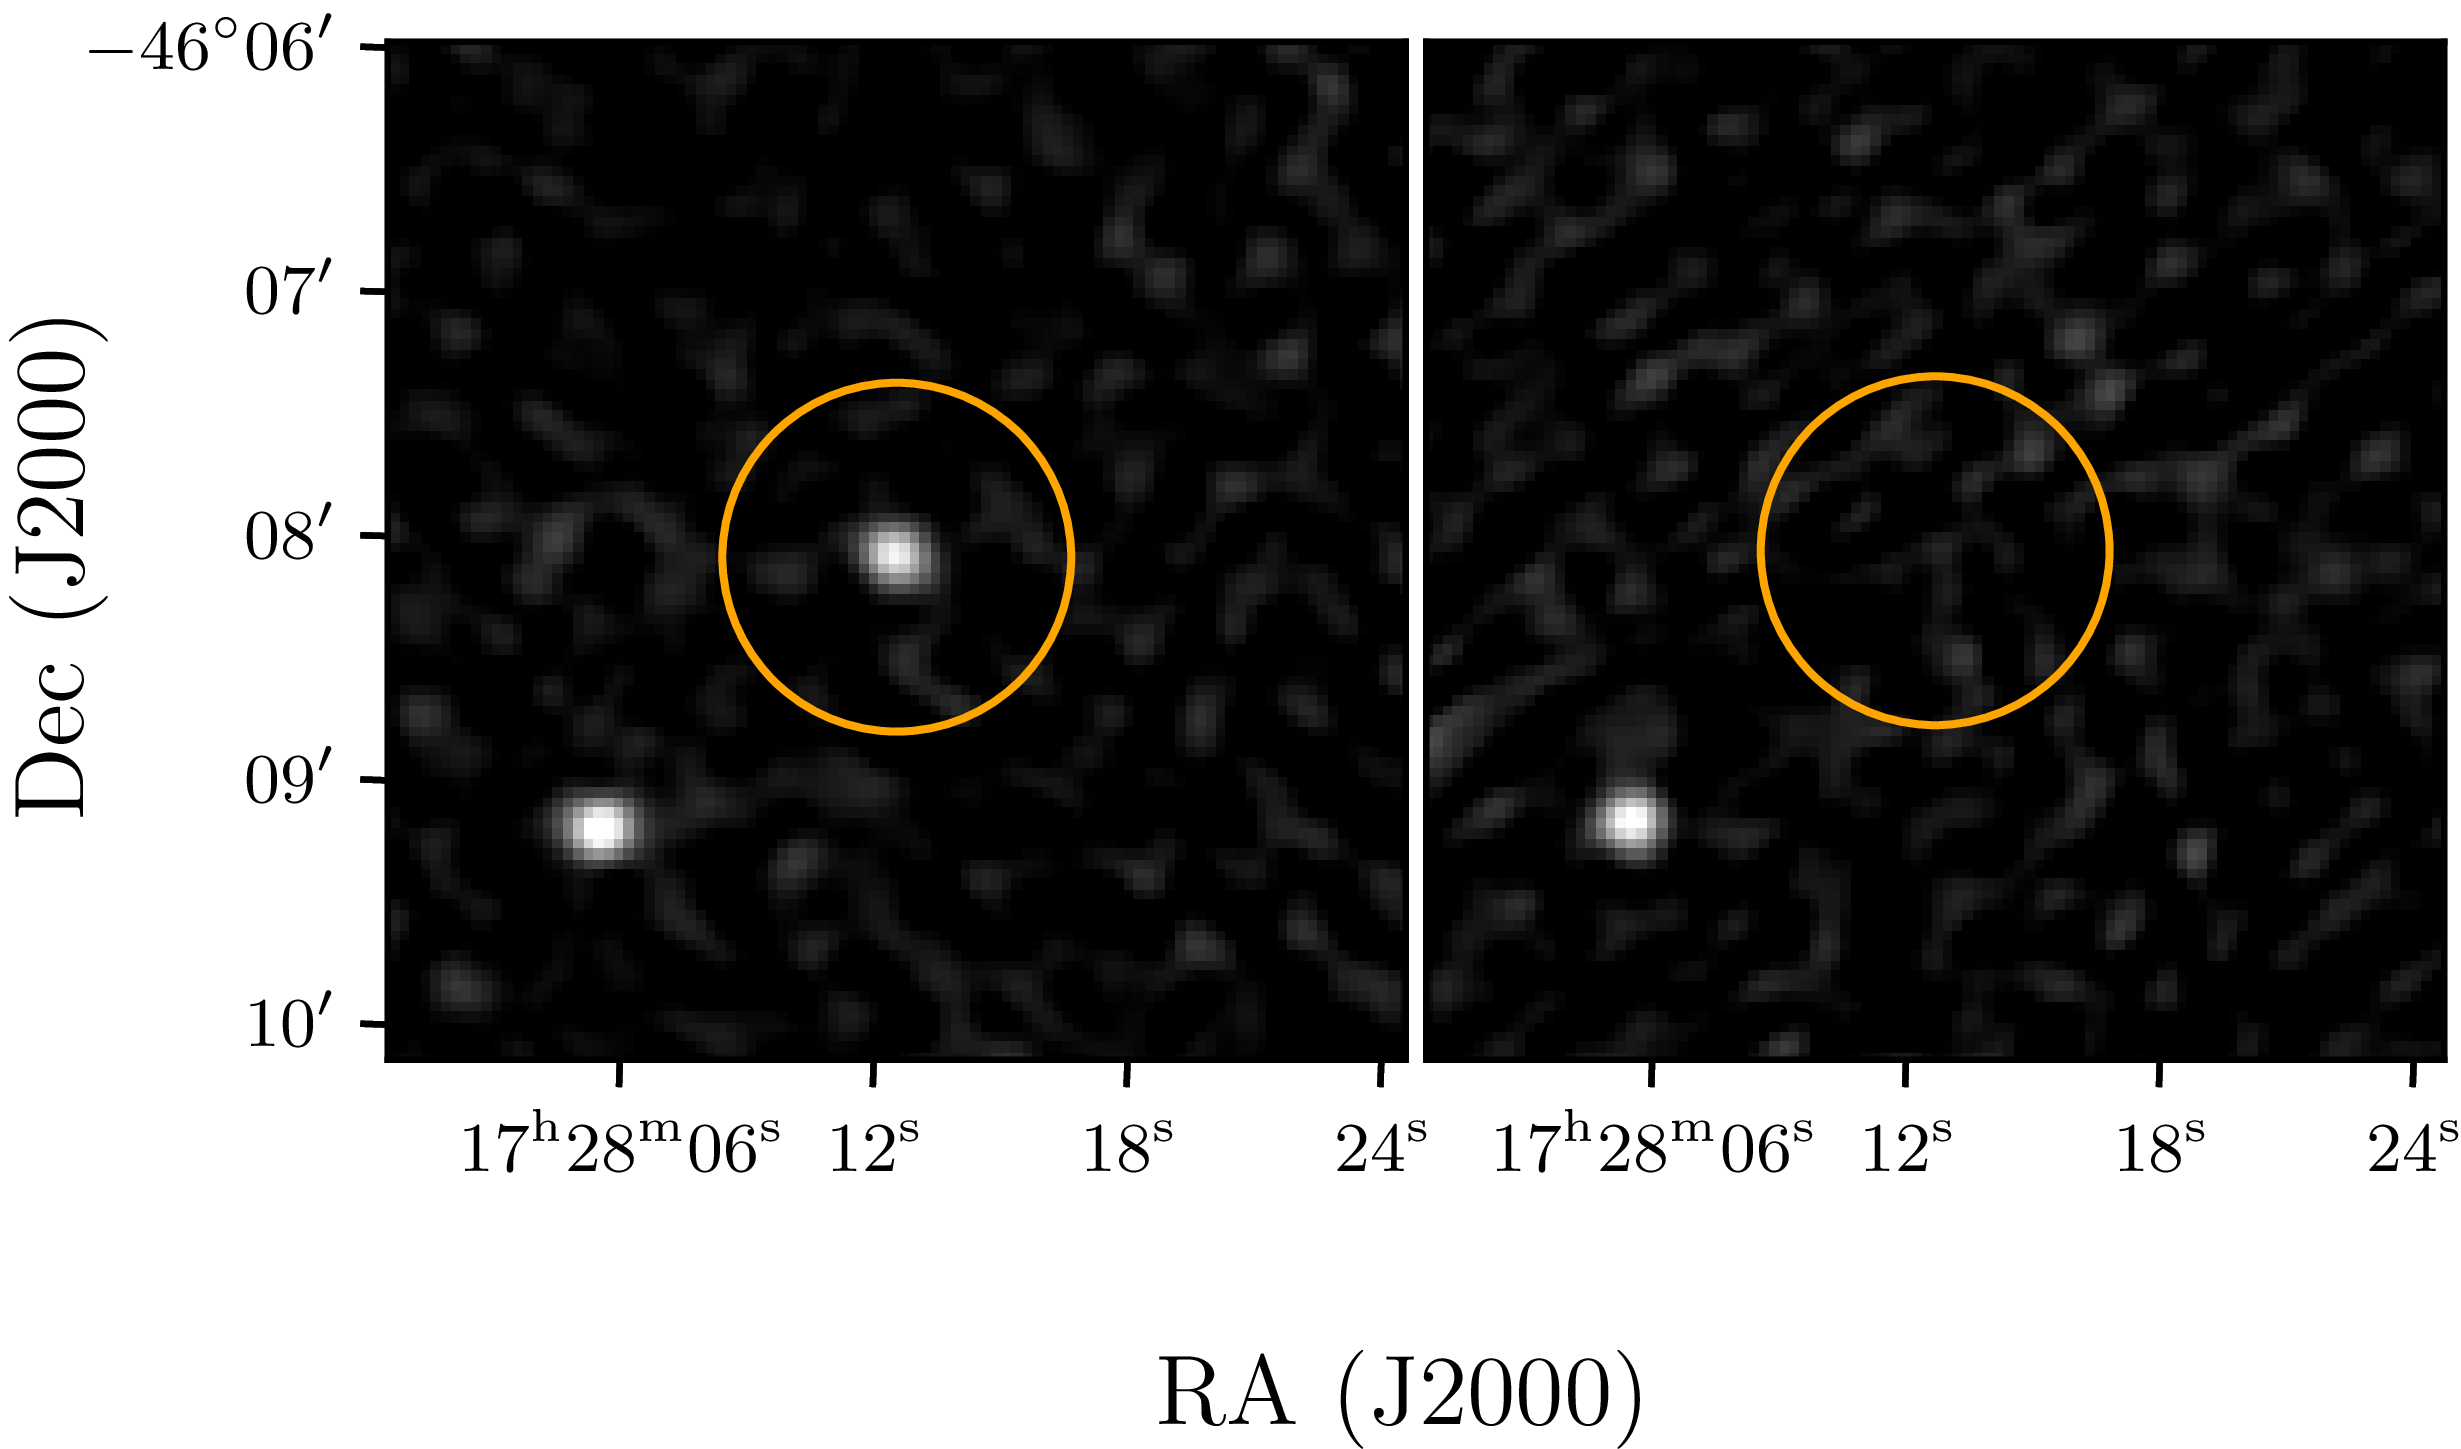


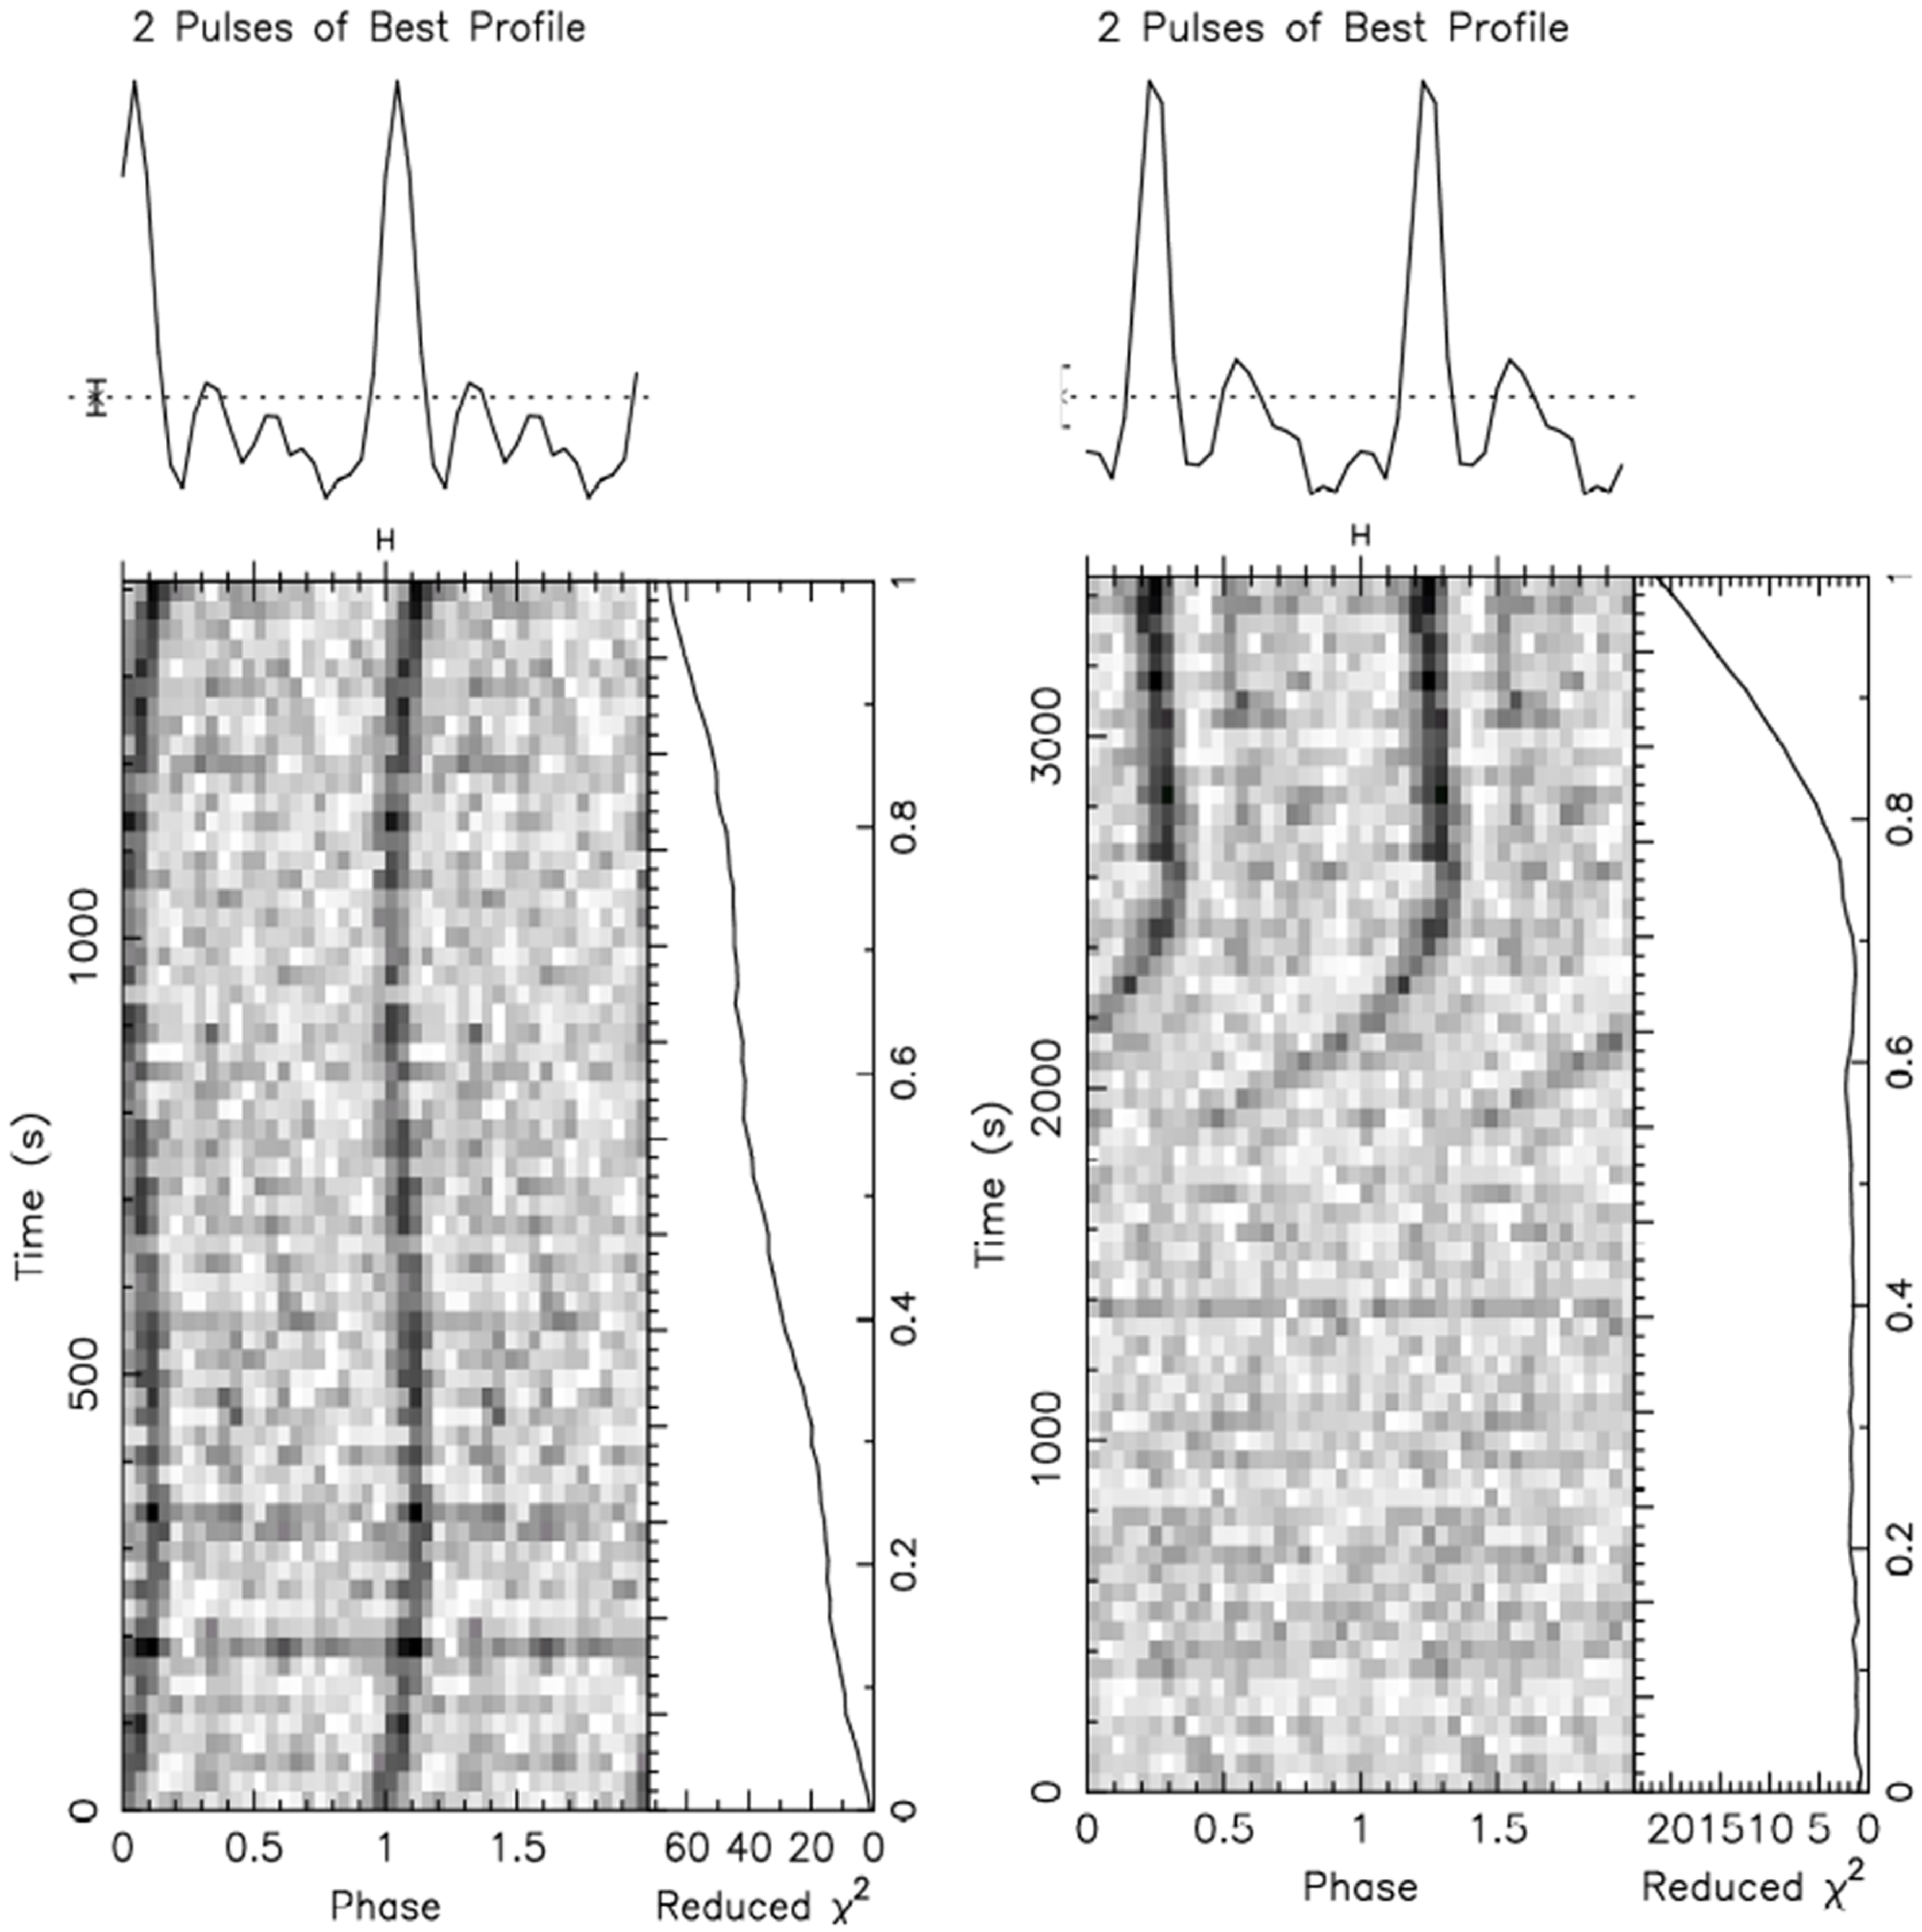

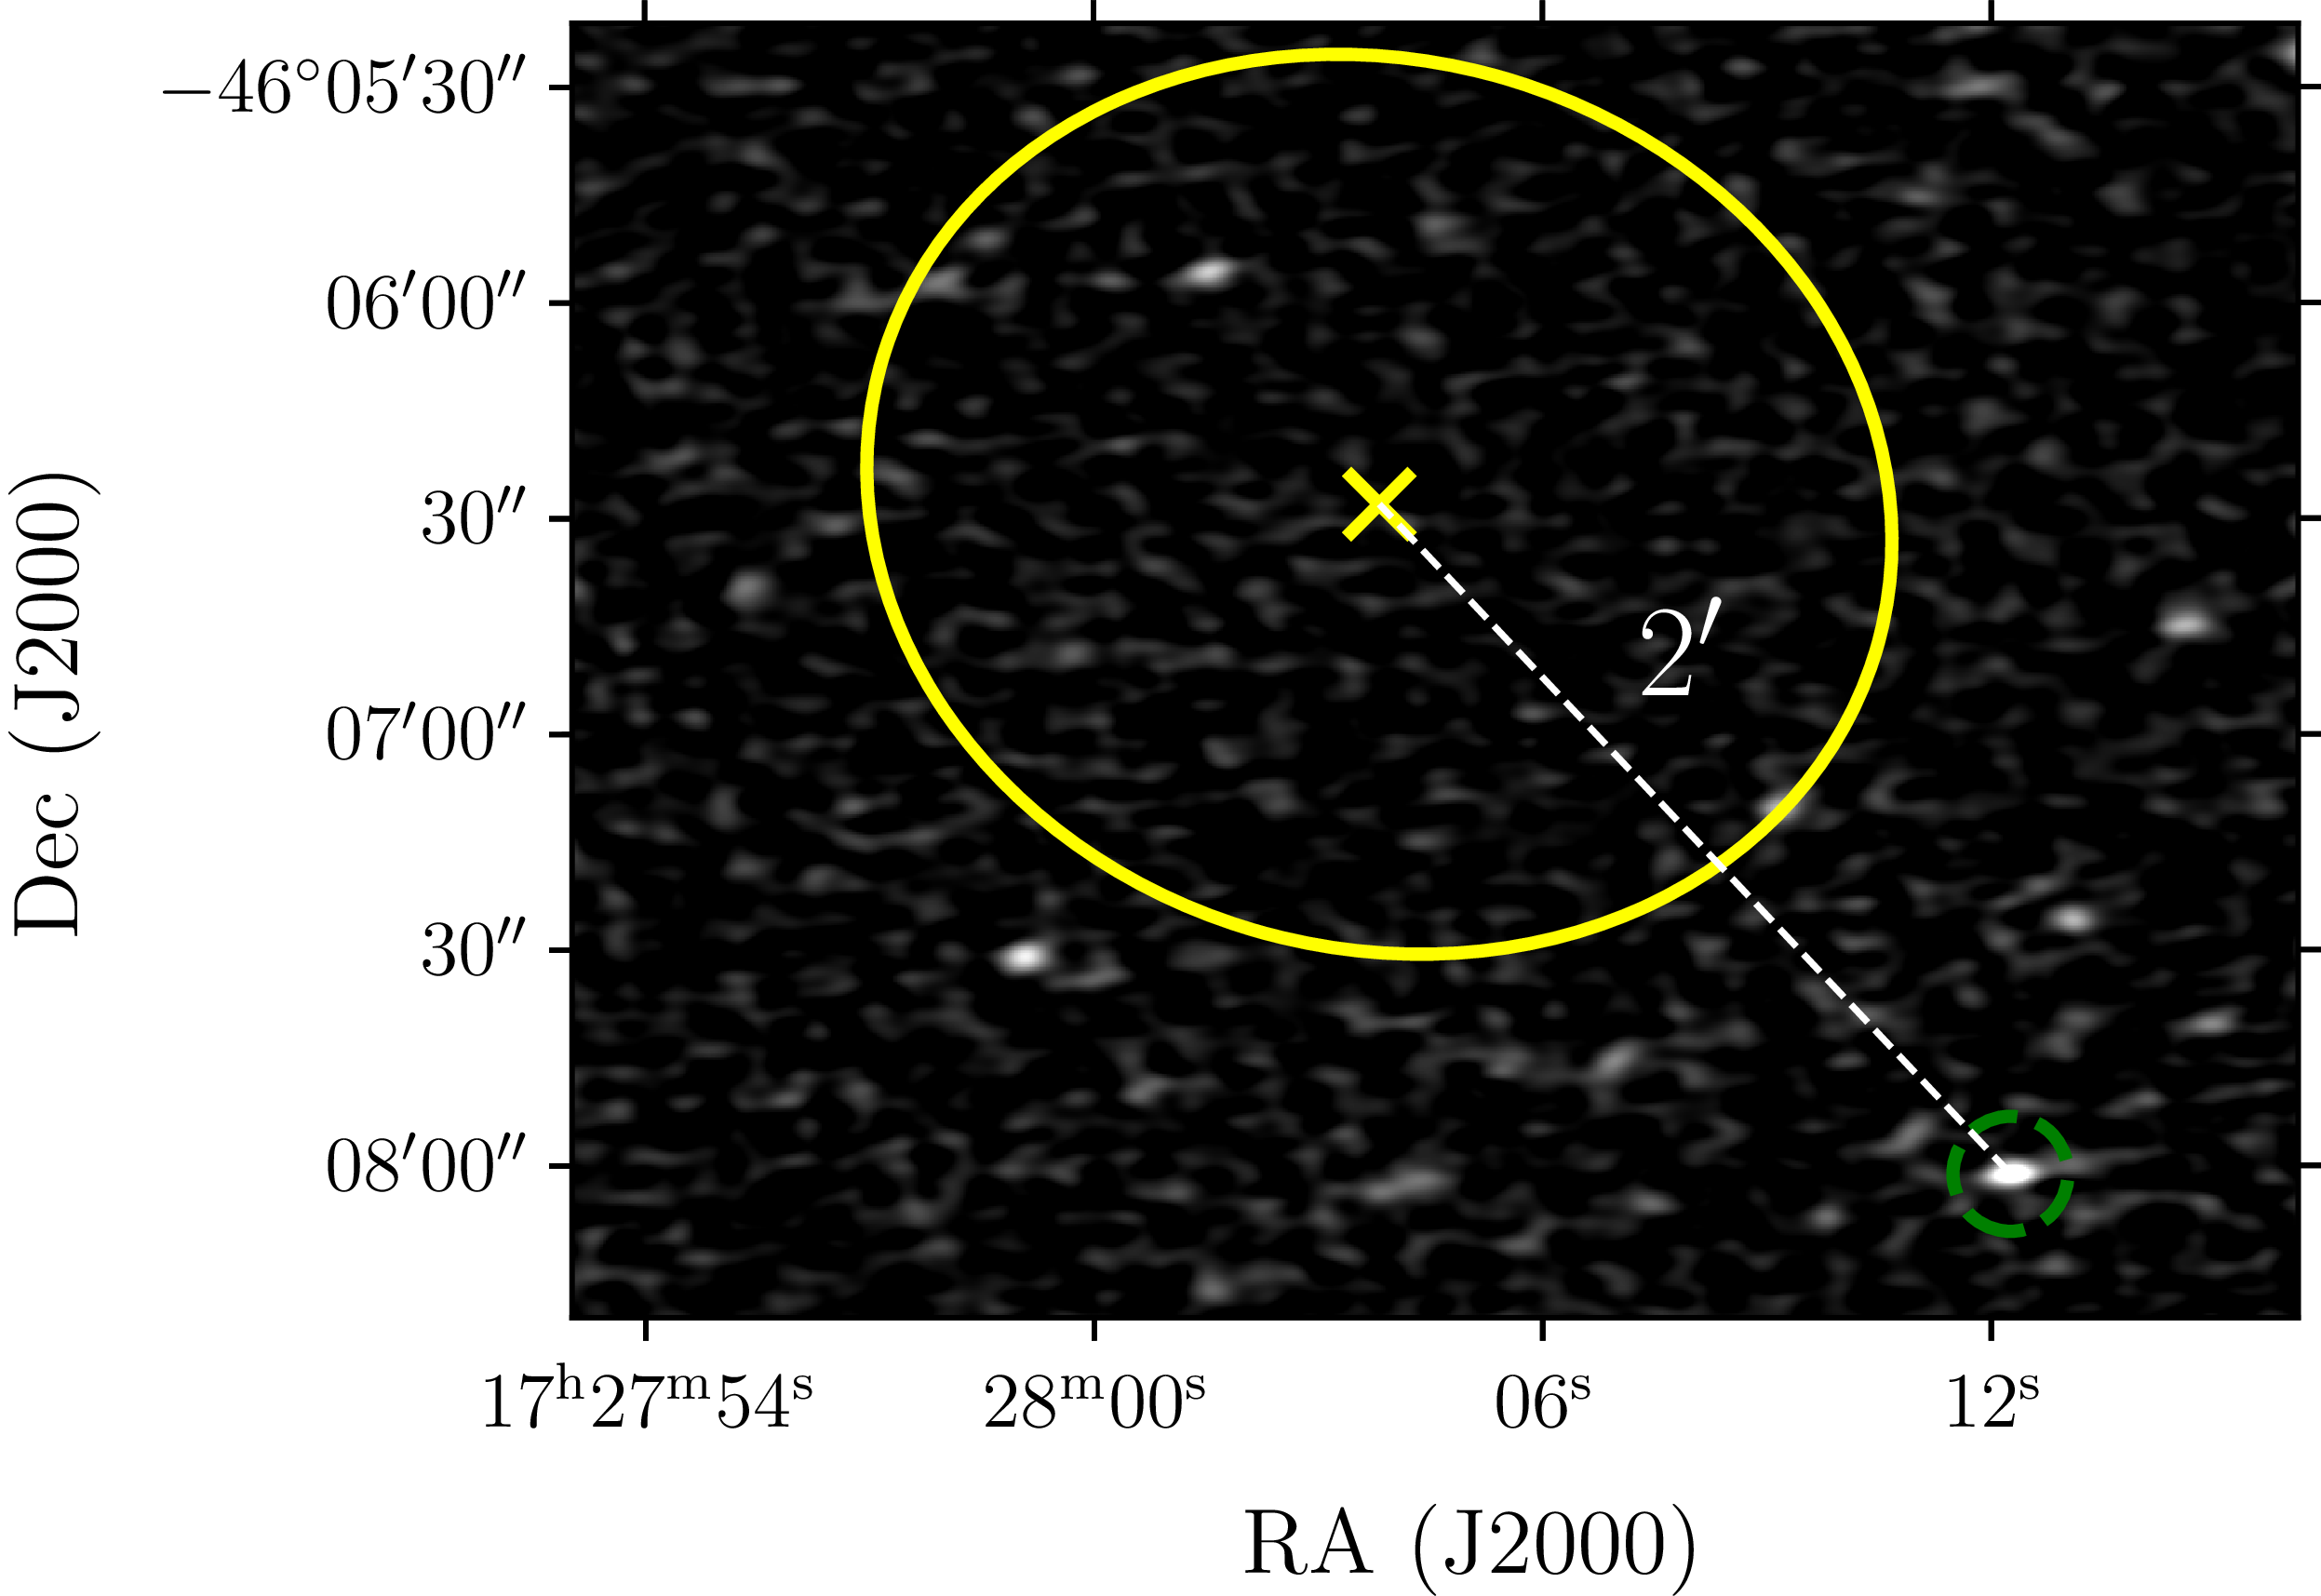


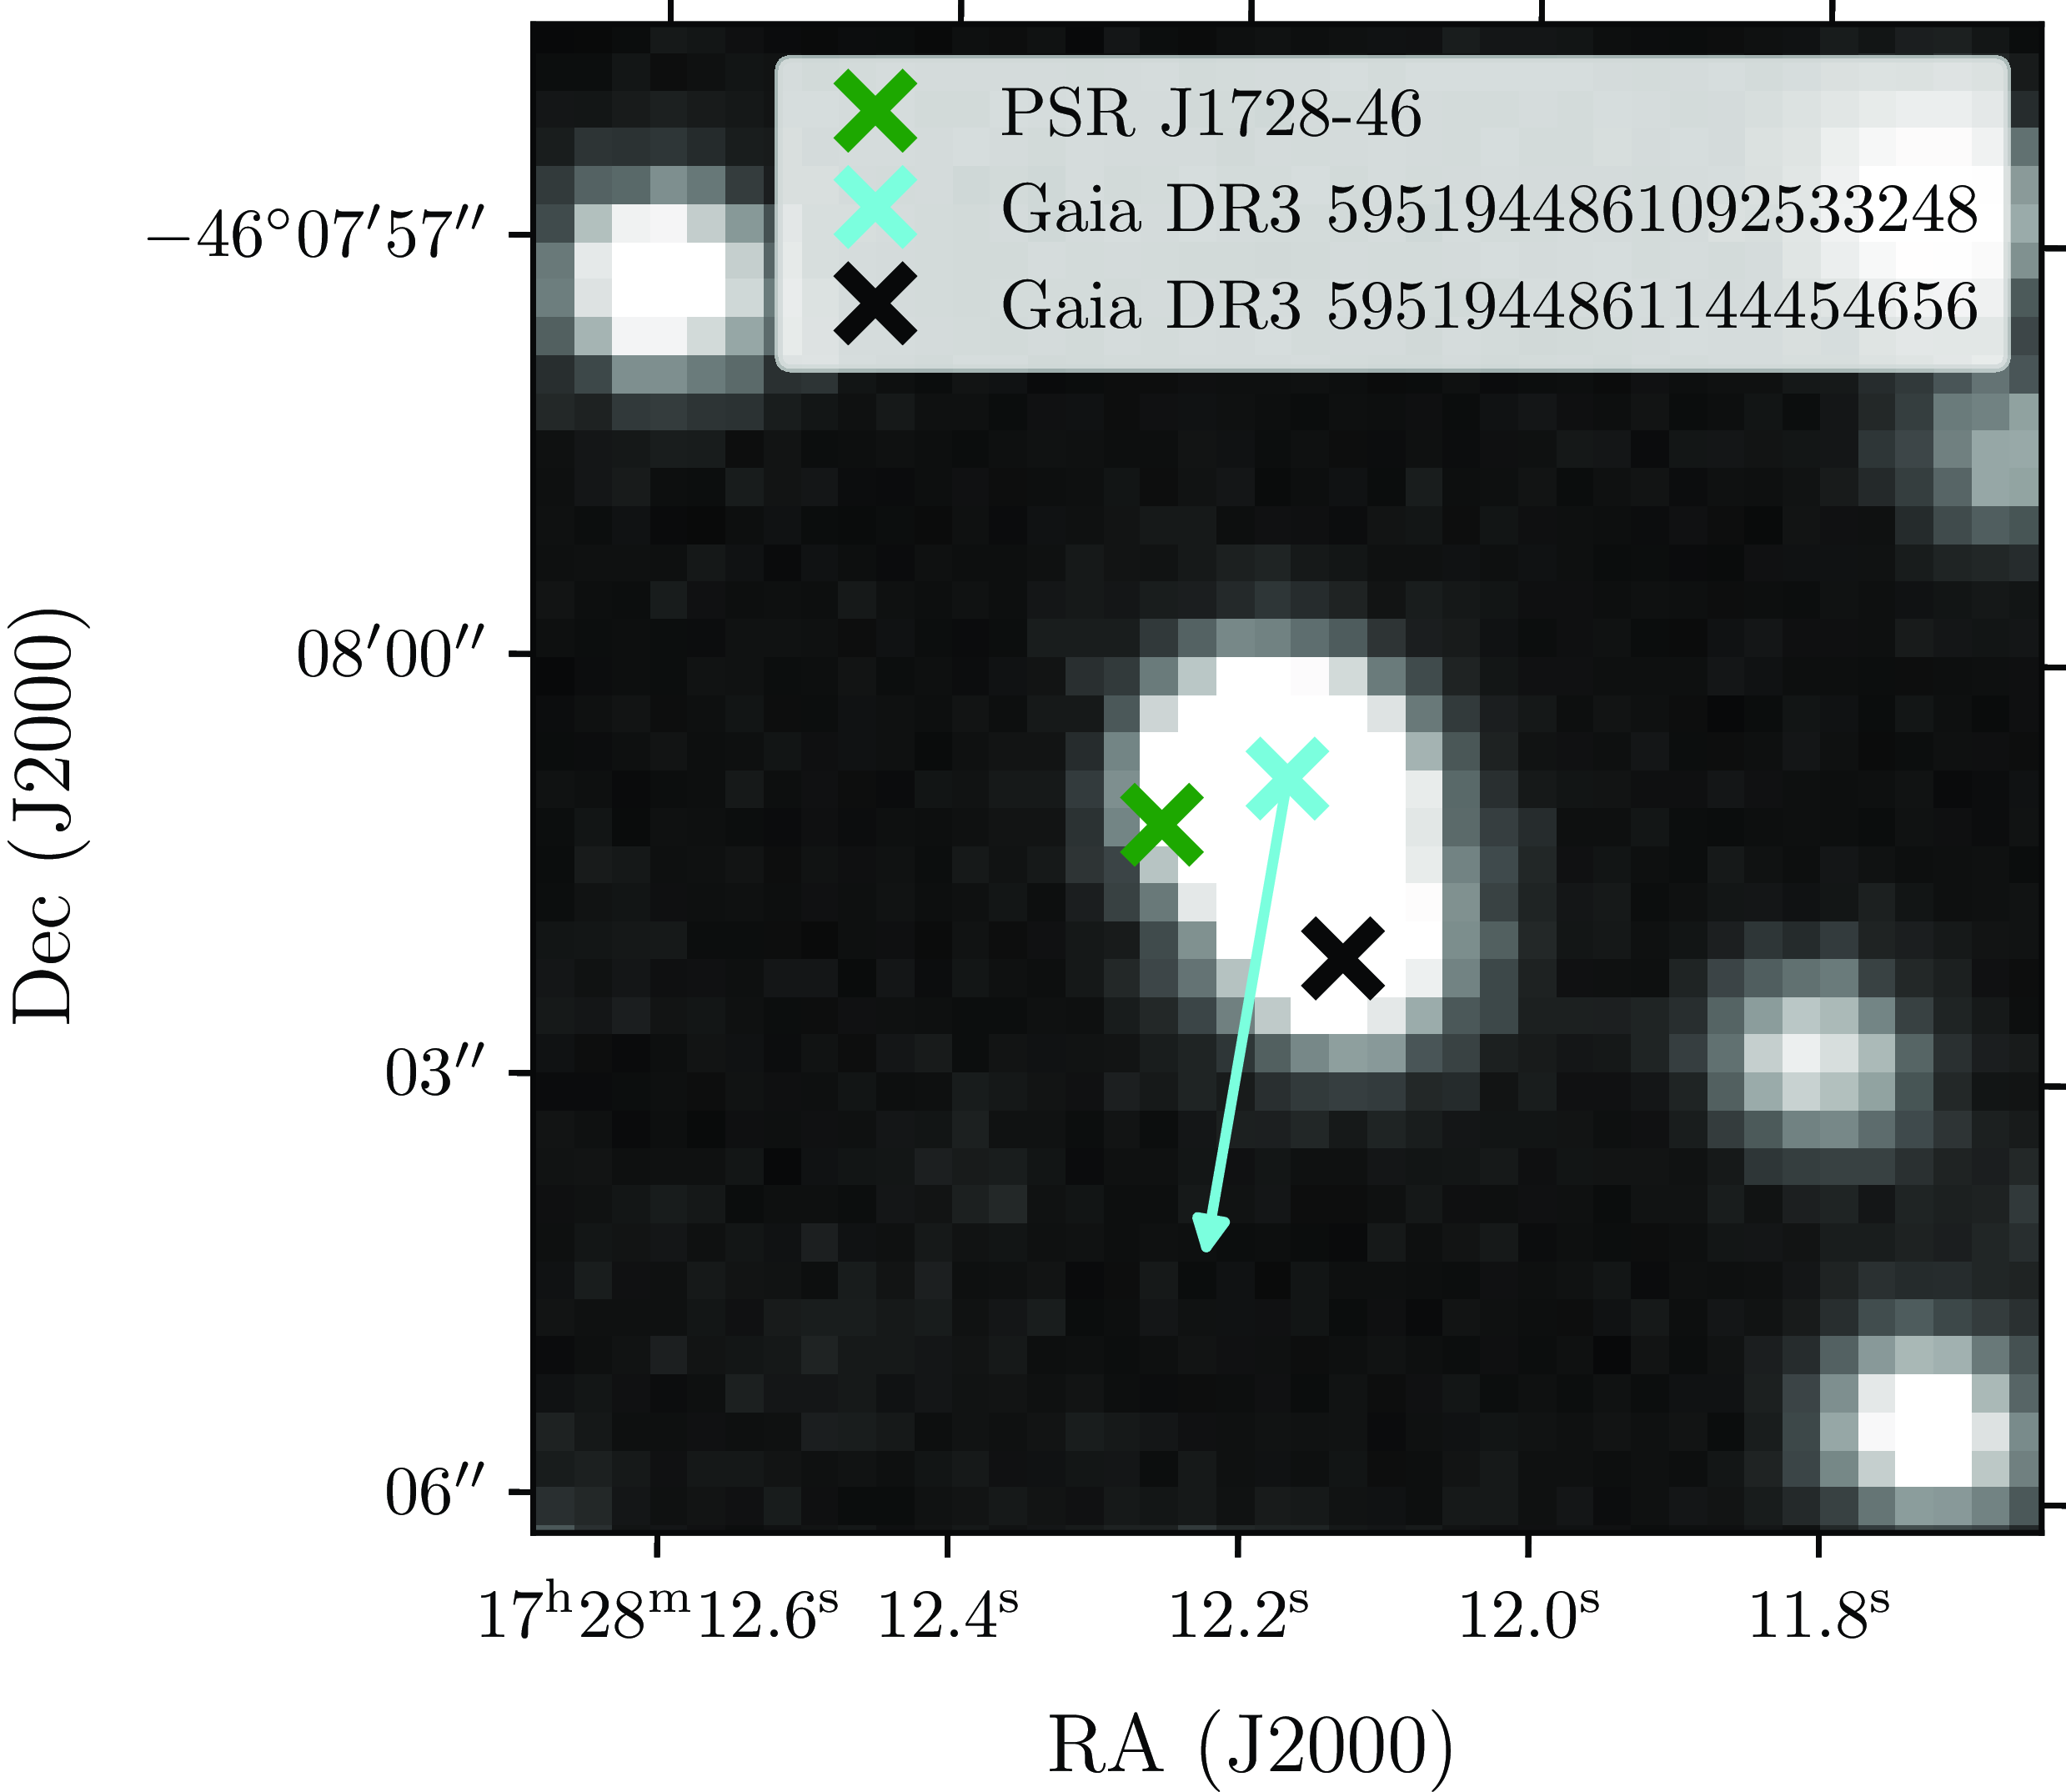


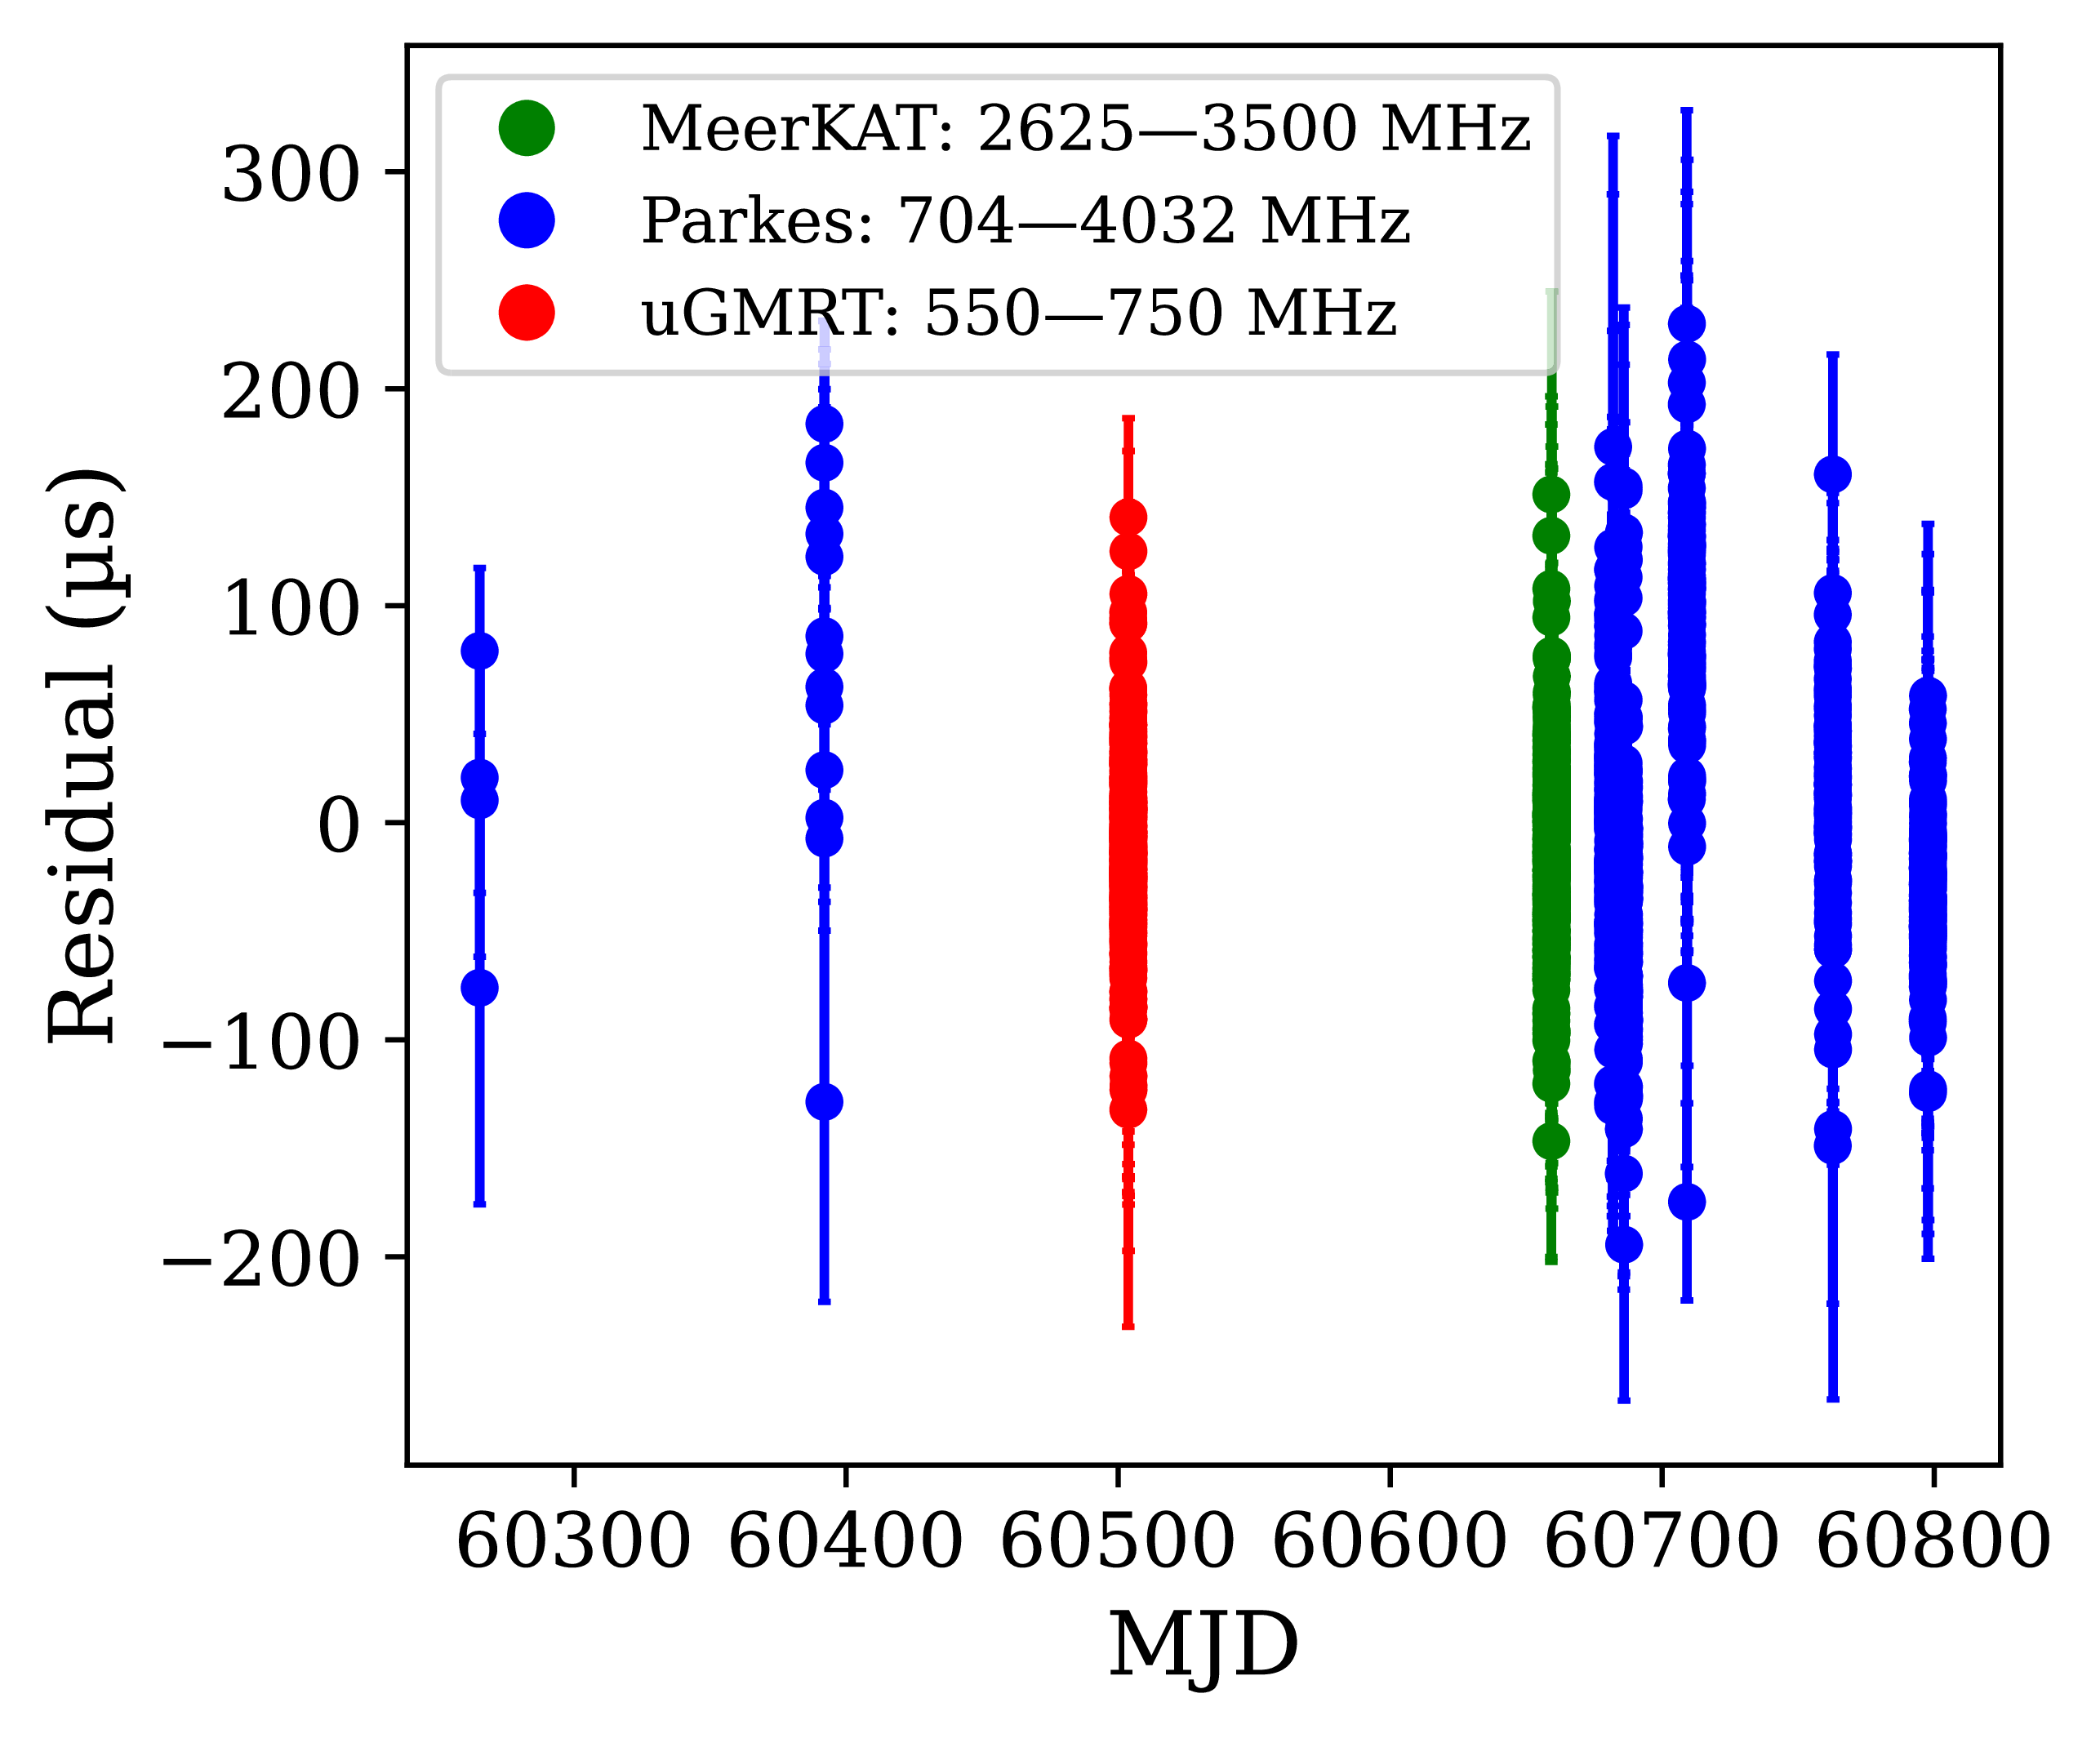


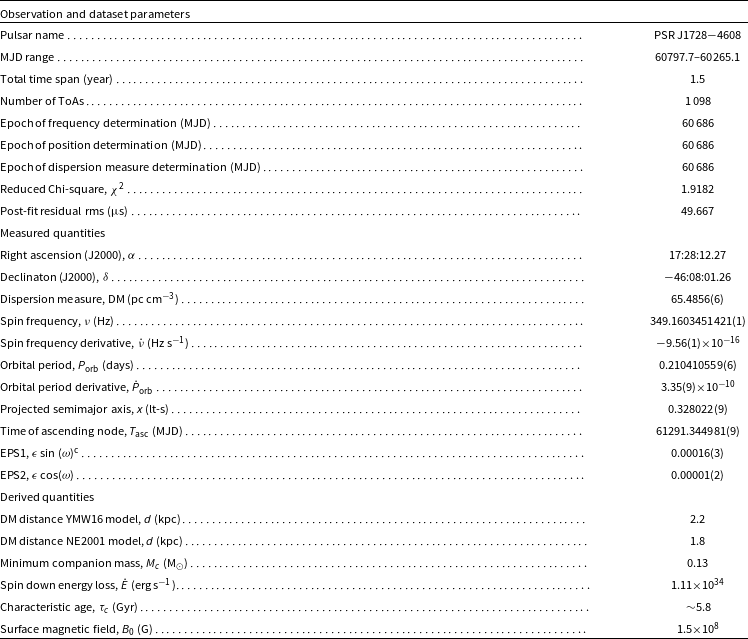

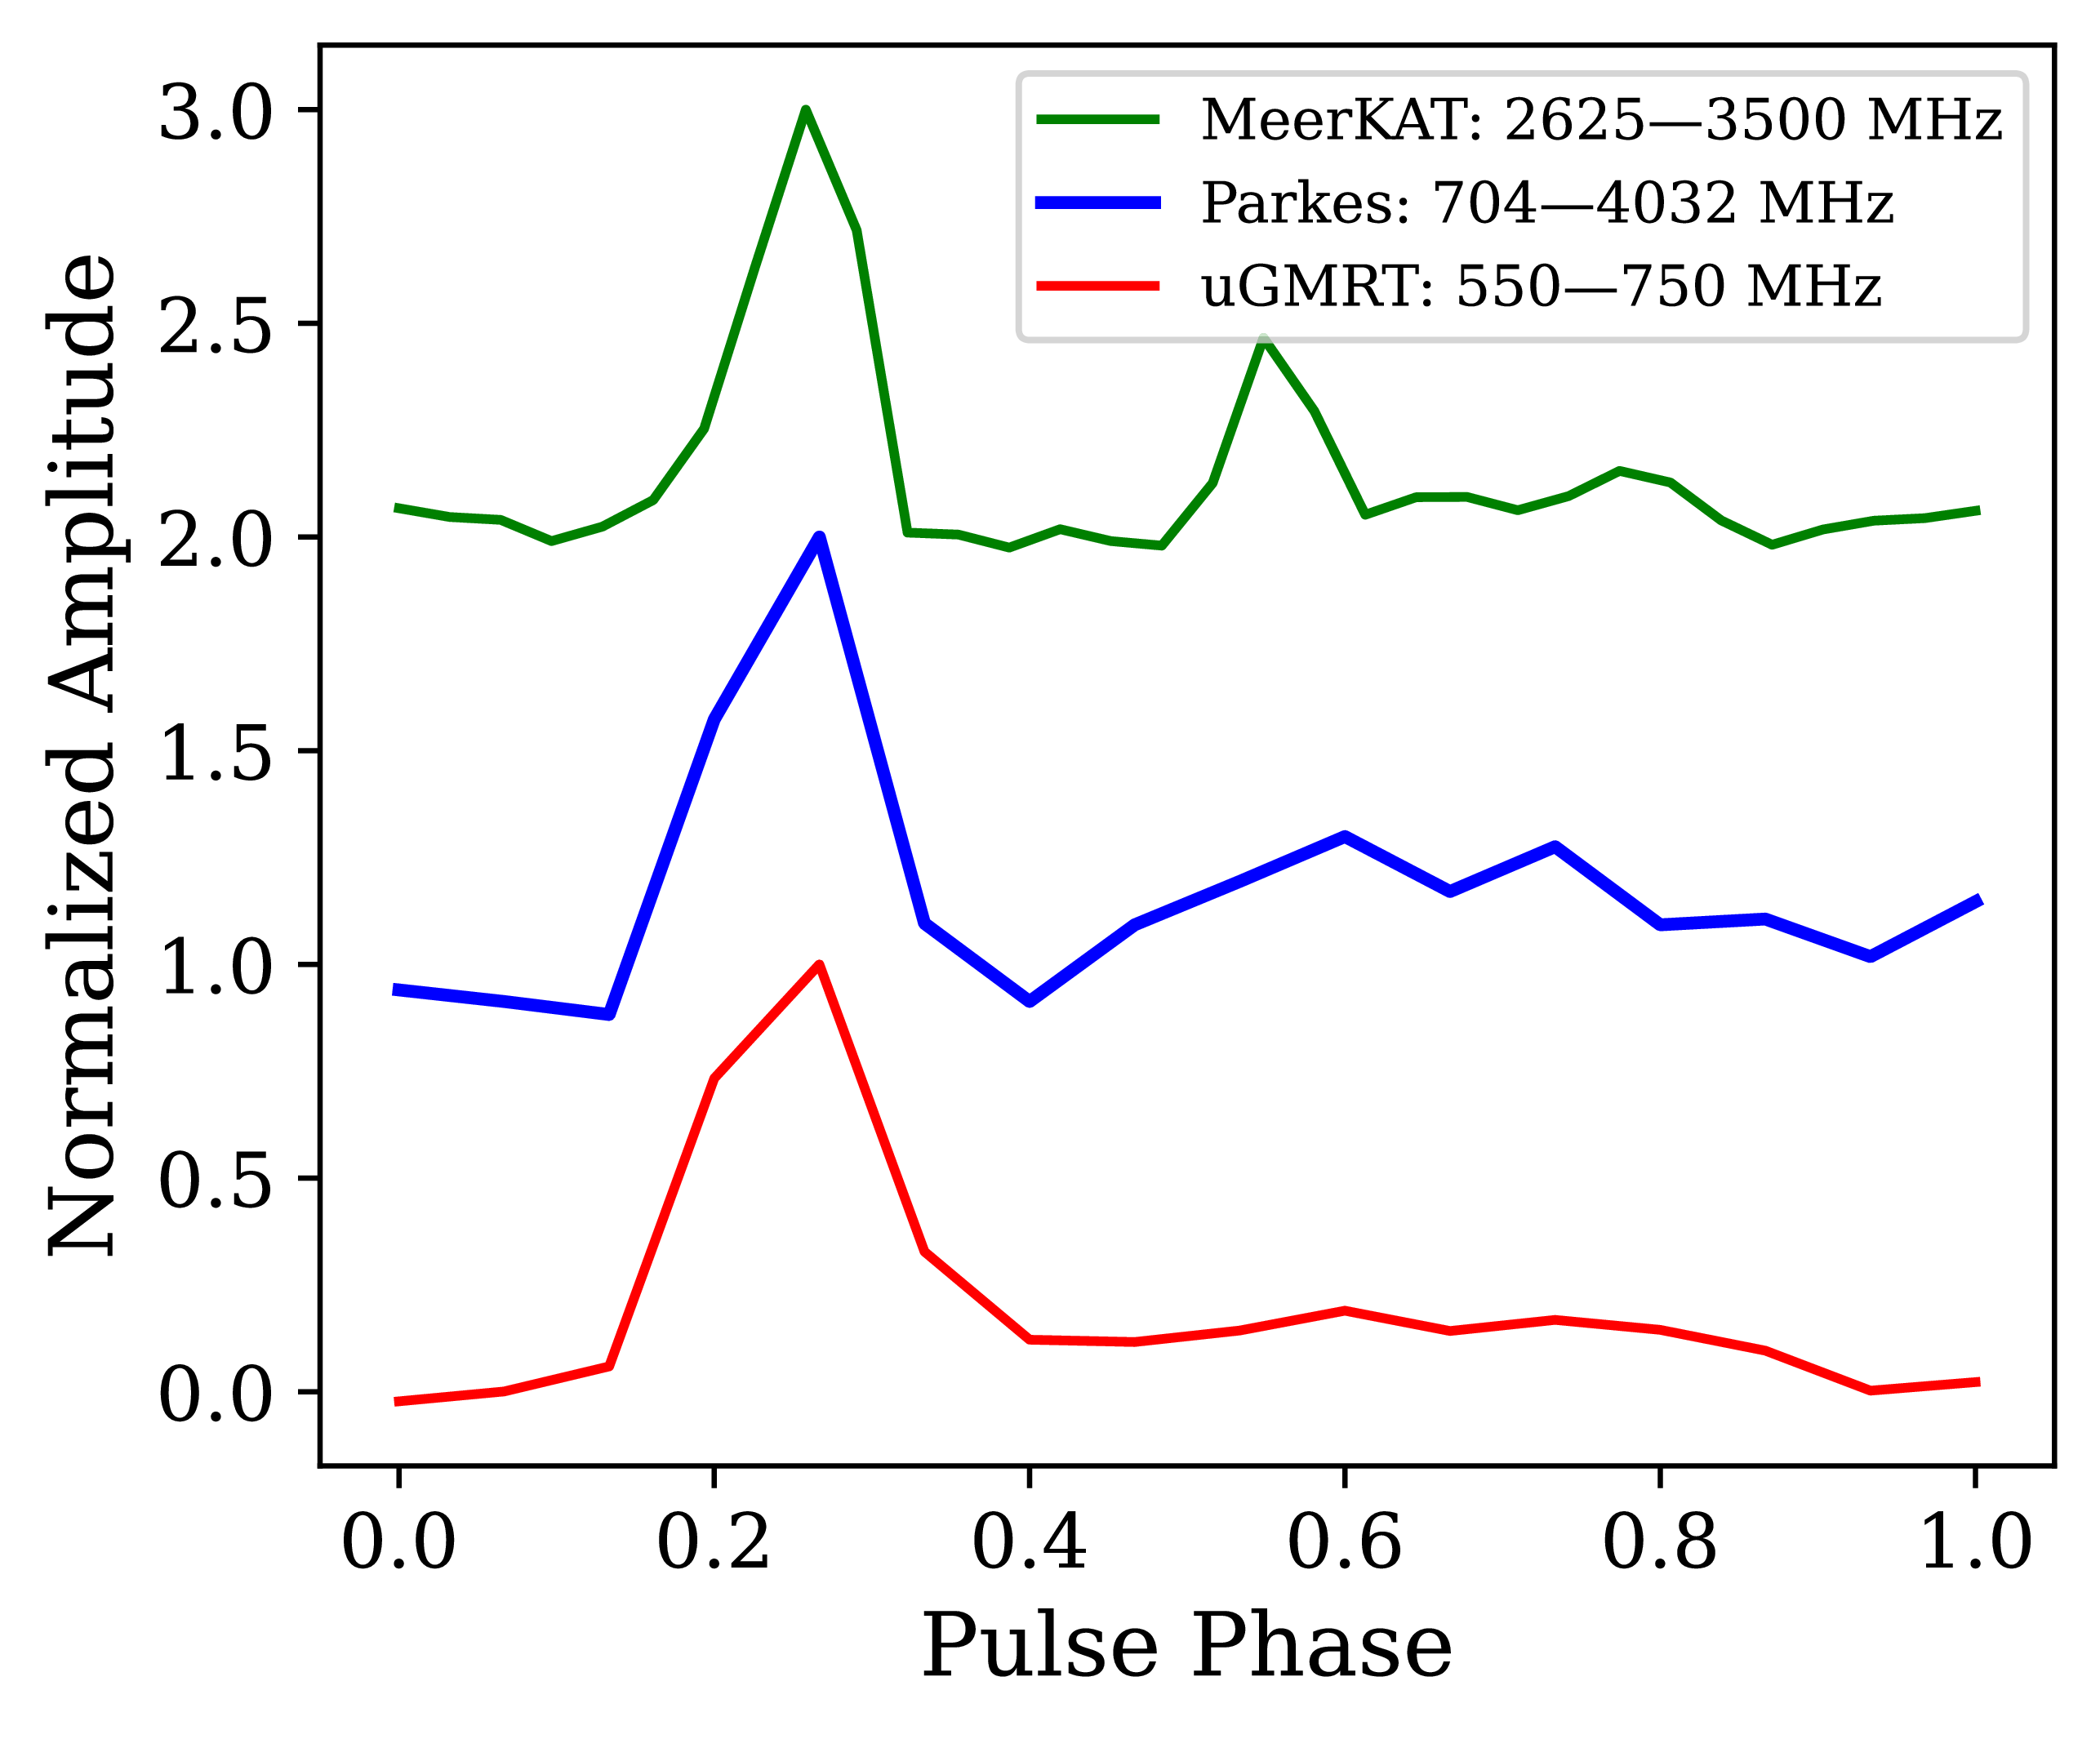
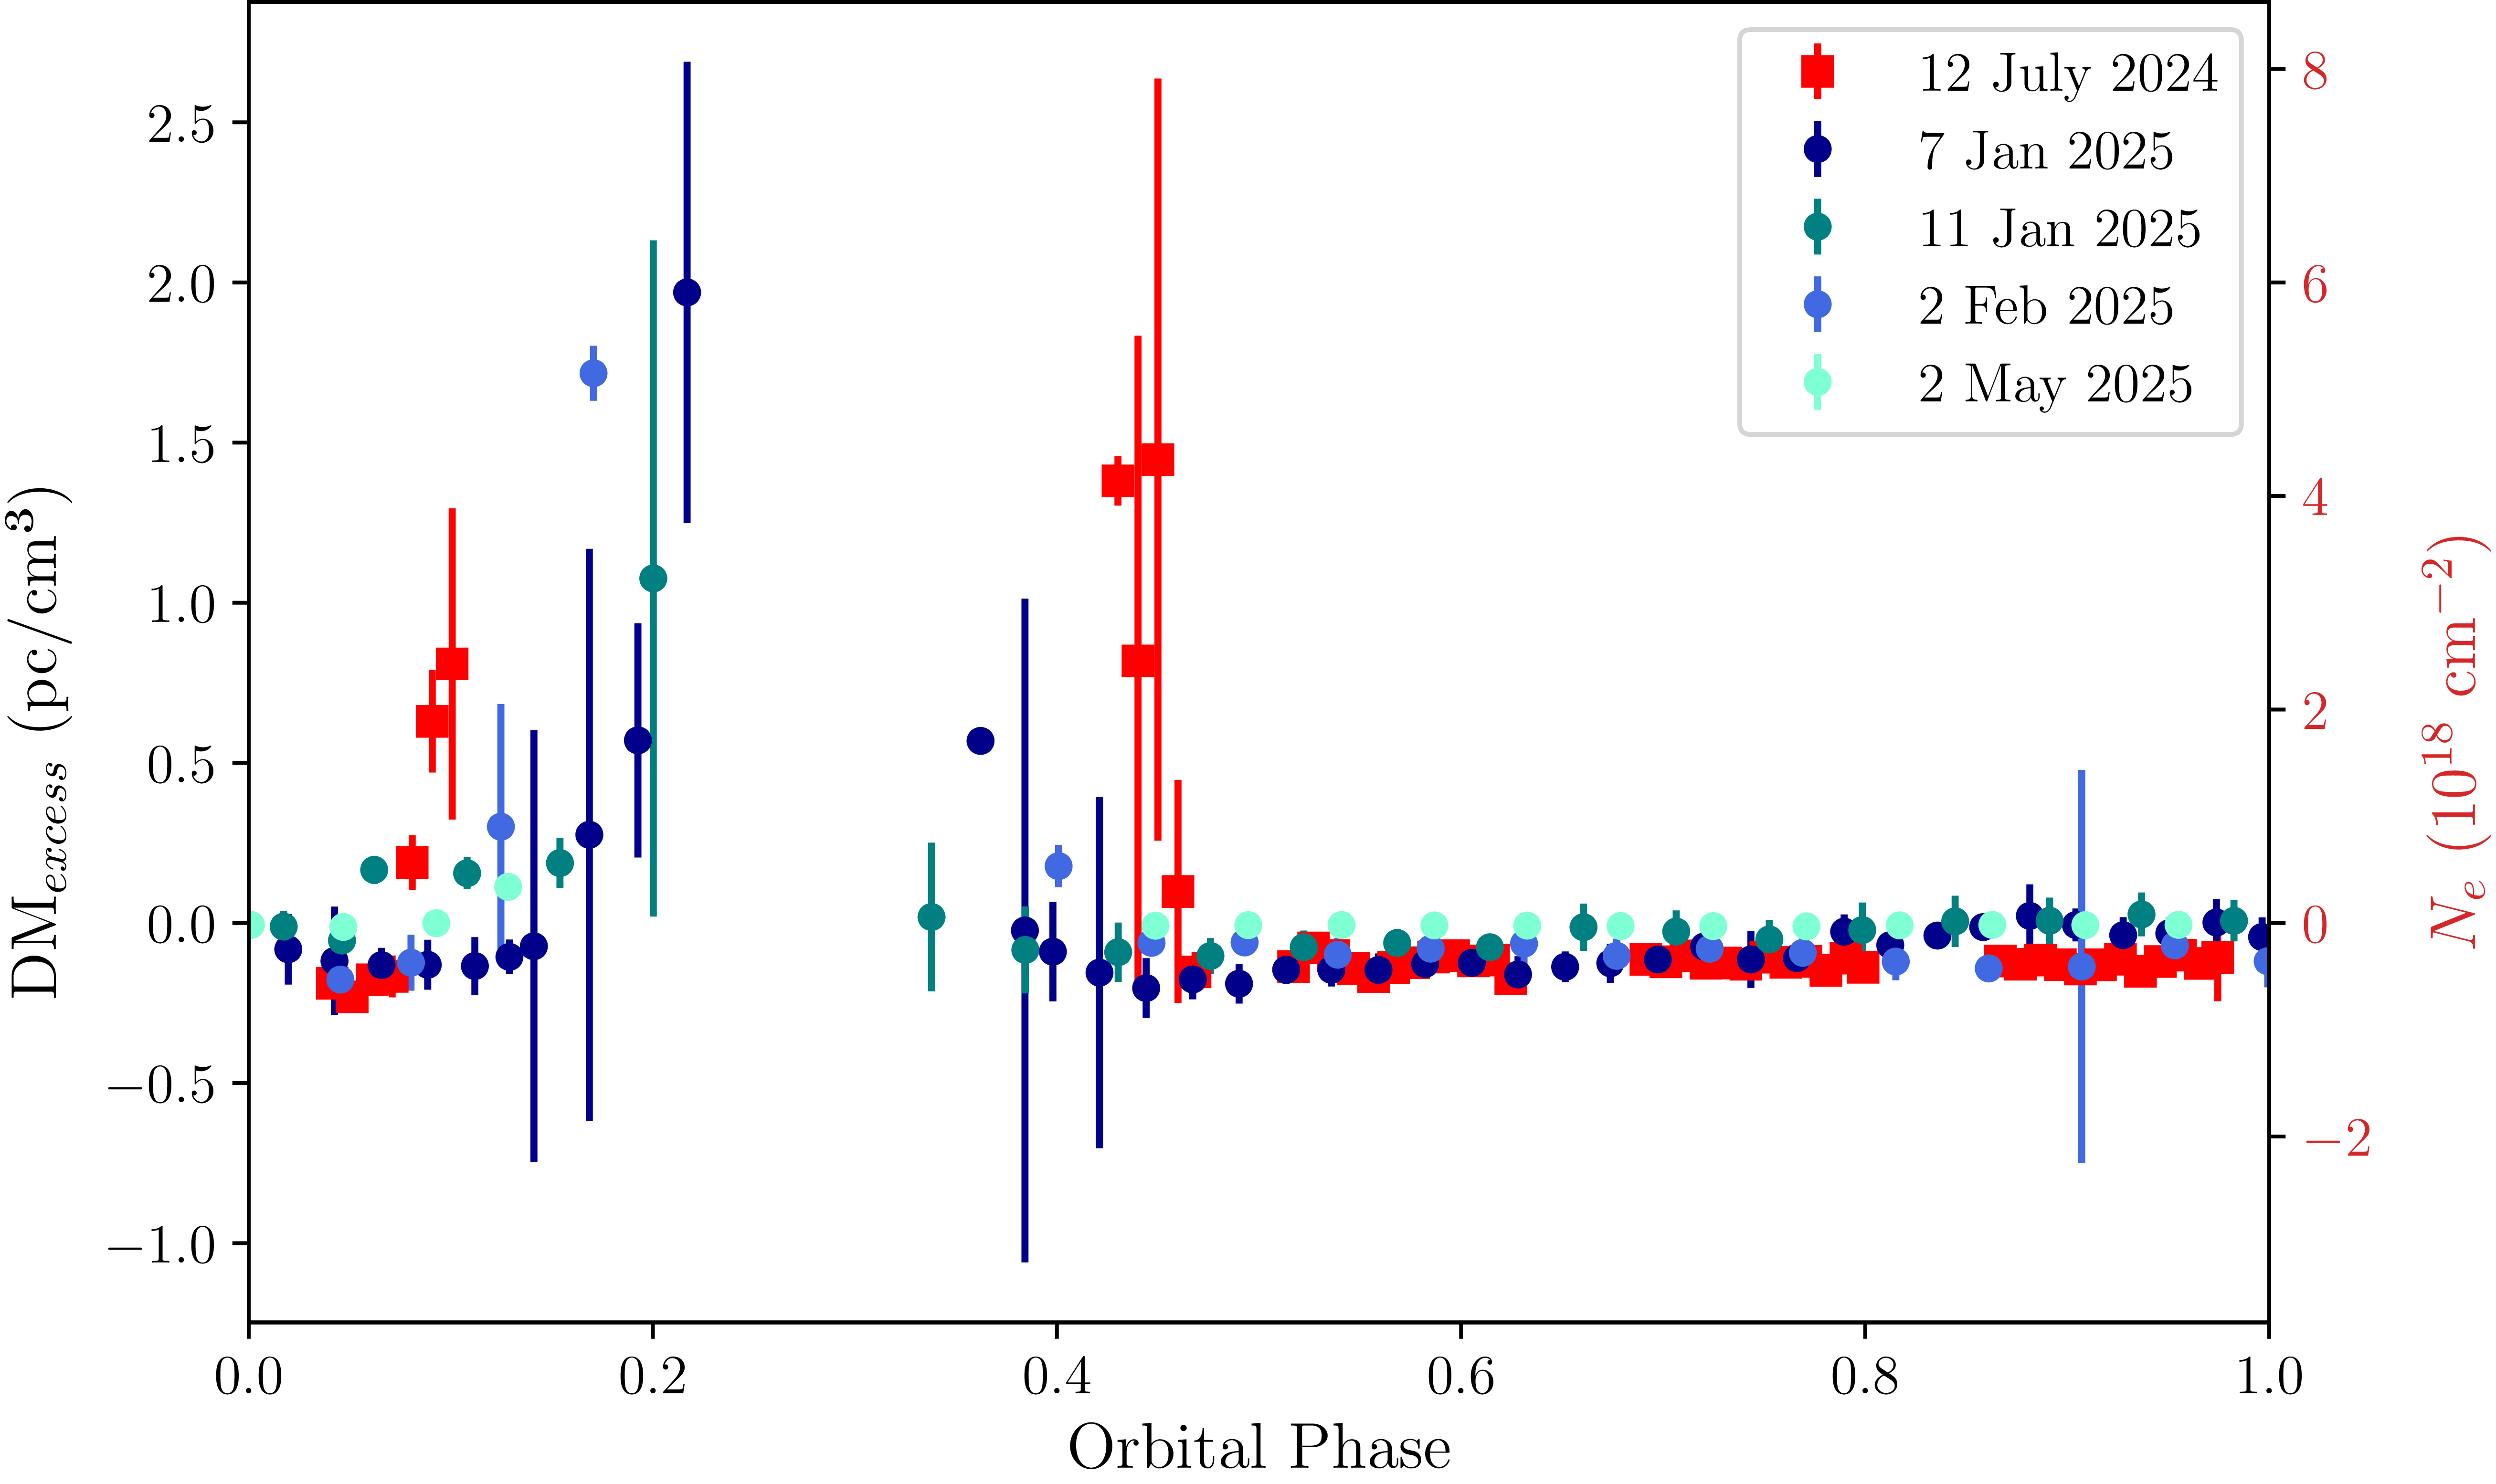


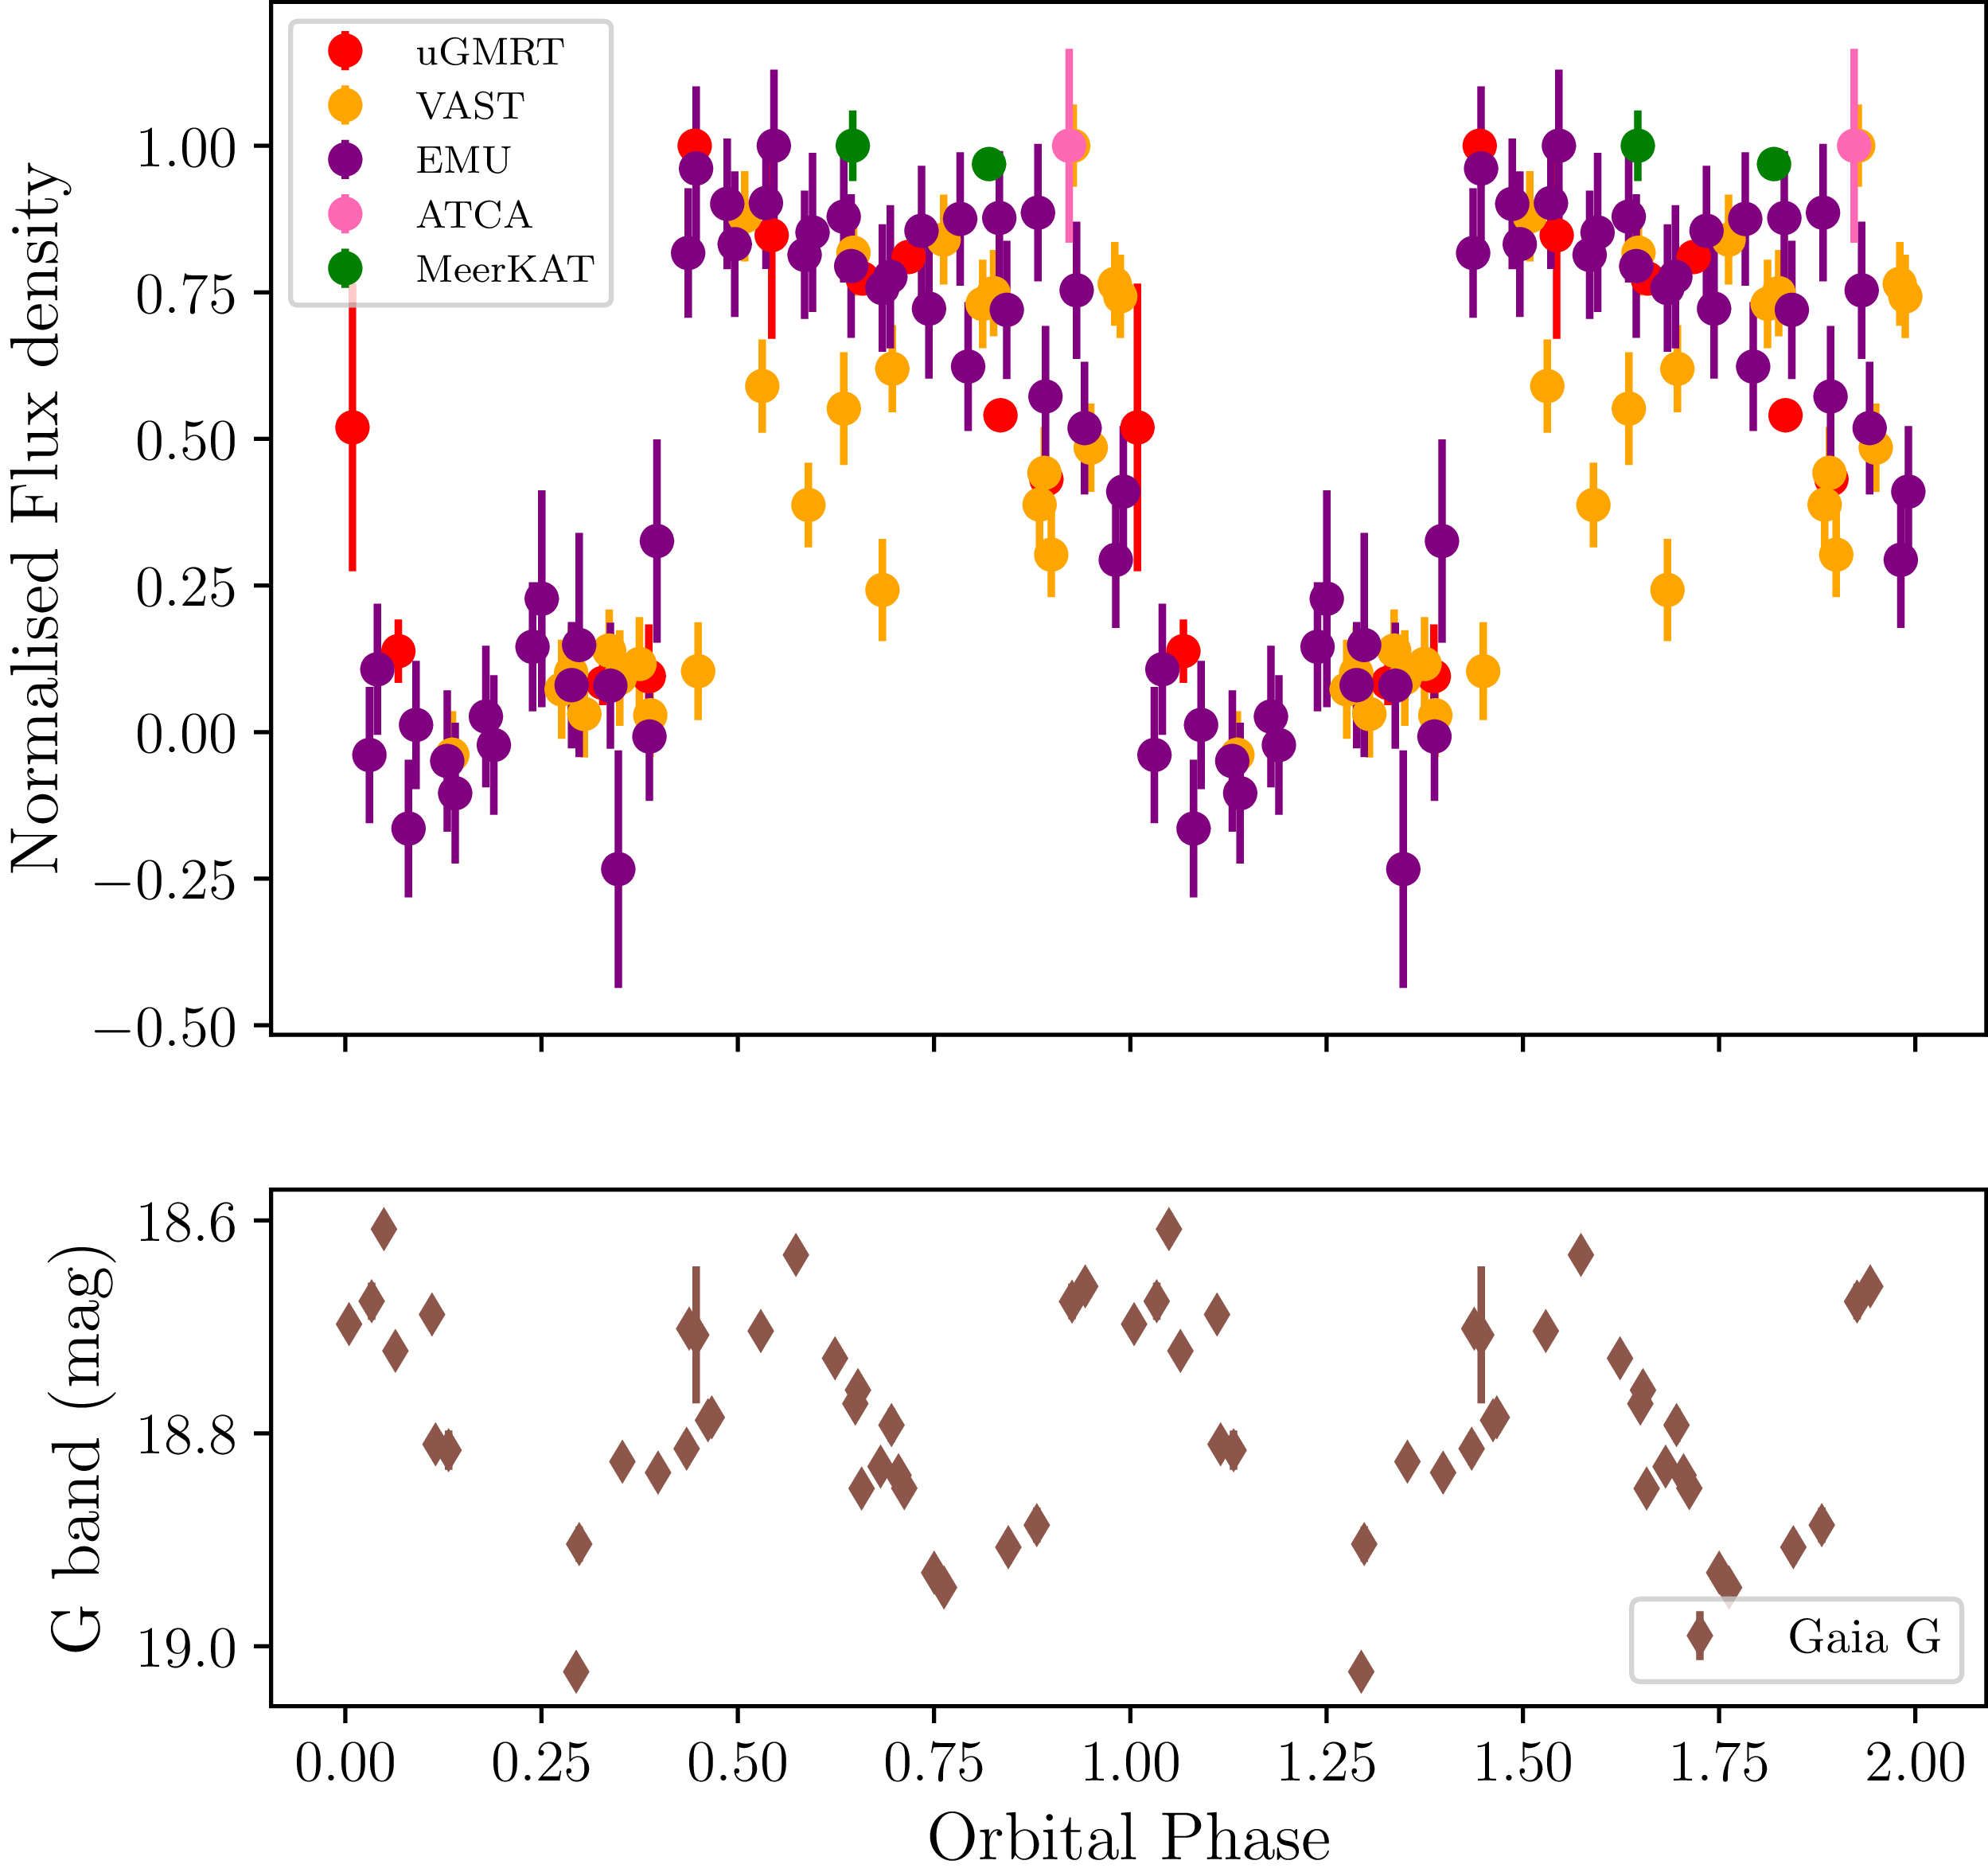


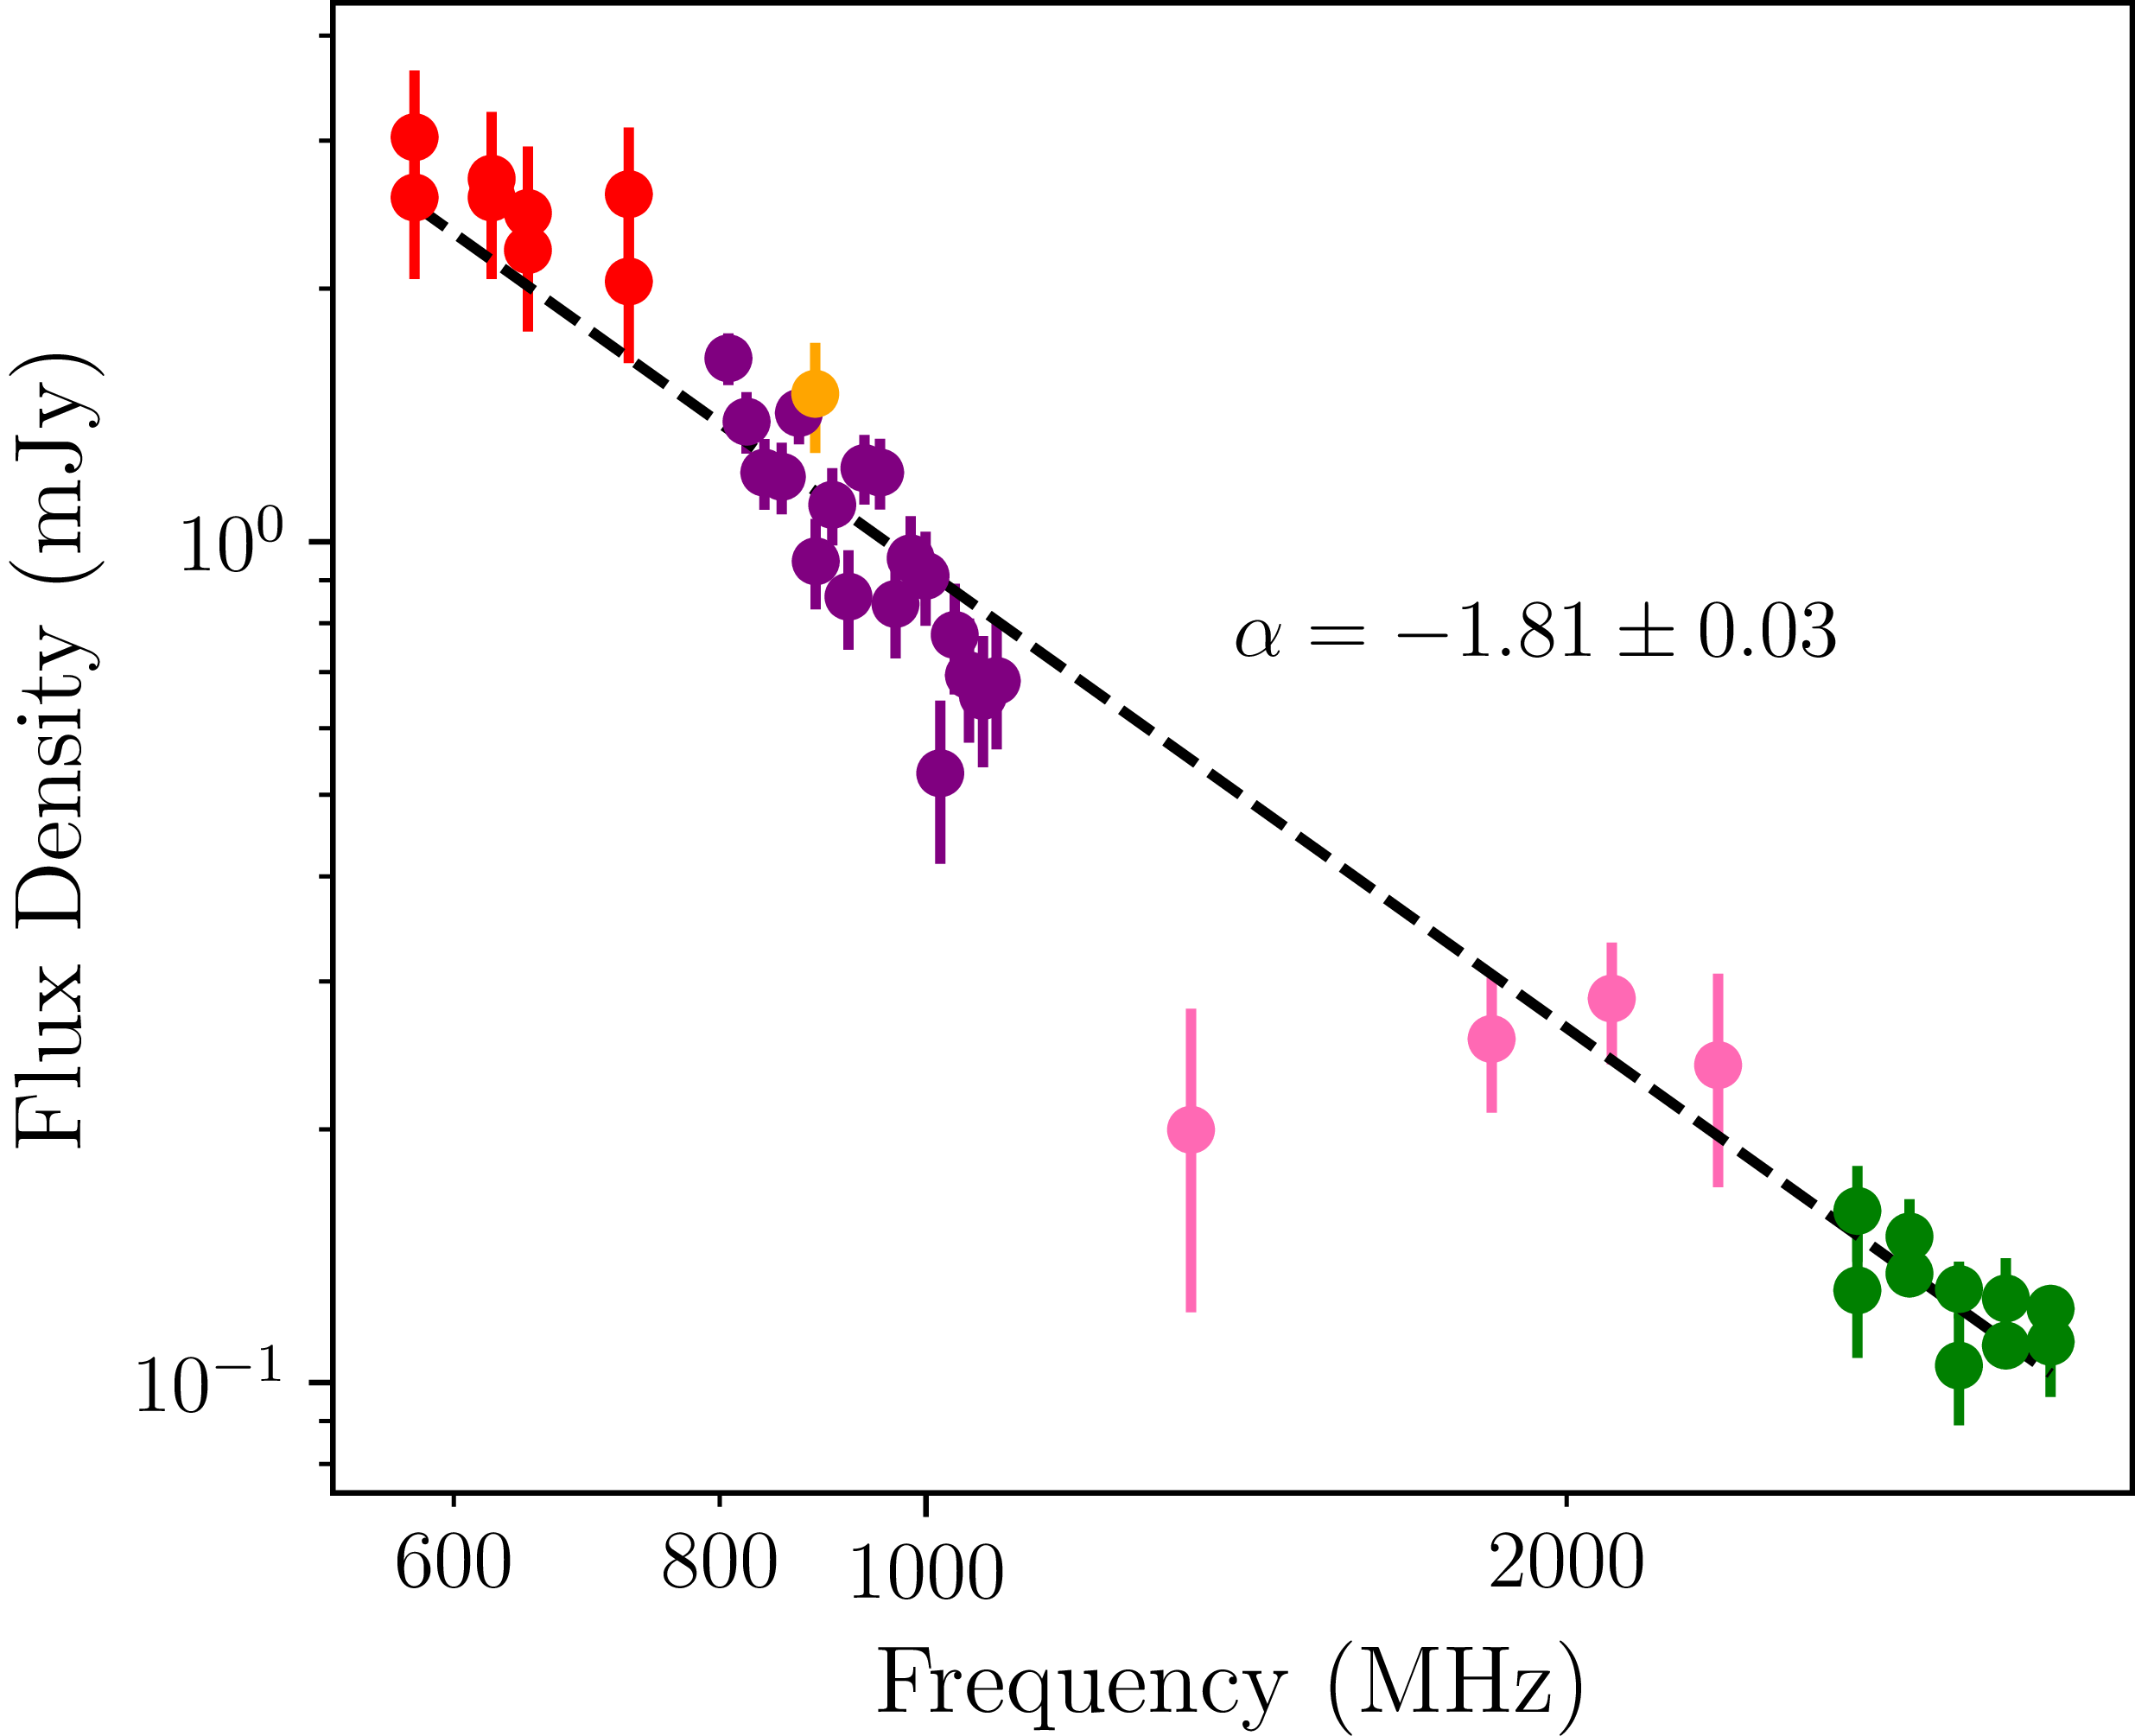


 Open access