


Introduction
Quality aging depends on social participation. Volunteering enables older adults to remain connected to society (Morrow-Howell Reference Morrow-Howell2010). It helps them form social bonds and overcome adverse events in life (Ehlers et al. Reference Ehlers, Naegele and Reichert2011).
Given the societal significance of volunteering among older adults, this study examined the relationship between participation in volunteering and quality of life for European and Israelian volunteers aged 50 and above. Specifically, we focus on how this relationship changes along with the volunteering rate across the countries. This issue was previously raised by Haski-Leventhal (Reference Haski-Leventhal2009), who analyzed data collected in 2004 in 11 countries from Western and Northern Europe and Israel, and found a positive correlation between volunteering and perceived health, satisfaction with life, and self-reported life expectancy among Europeans 50+.
Importantly, Haski-Leventhal (Reference Haski-Leventhal2009) found a relatively low impact of volunteering on well-being in countries with high volunteering rates. Precisely, the relationship between participation in volunteering and subjective dimensions of well-being depends upon the popularity of volunteering in a given country. Her result was obtained by Pearson’s linear correlation approach for a geographically limited group of countries. However, Niebuur et al. (Reference Niebuur, van Lente, Liefbroer, Steverink and Smidt2018) criticized most studies on volunteering for being conducted in the US or selected Western European countries and postulated to diversify studies in terms of geographical coverage. New evidence has supported the positive relationship between volunteering and well-being (Wilson Reference Wilson2012; Haski-Leventhal et al. Reference Haski-Leventhal, Metz, Hogg, Ibrahim, Smith, Wang, Smith, Stebbins and Grotz2016; Hansen et al. Reference Hansen, Aartsen, Slagsvold and Deindl2018), and availability of new data from European countries makes it worth to re-examine the aforementioned relationship.
The study at hand was inspired by Haski-Leventhal (Reference Haski-Leventhal2009) findings. We test validity (robustness) of the above results by applying Pearson’s linear correlation and the Kendall tau-b correlation to a much larger set of European countries and data collected during 2015. It extends previous analyses to include post-communist countries from Central and Eastern Europe (CEE) that were not included in the earlier studies. This approach provides us with greater variation in the studied variables.
Researchers have established high variability of volunteering rates across countries (OECD 2016; Hank and Erlinghagen Reference Hank and Erlinghagen2010a; Hank and Stuck Reference Hank and Stuck2008; Haski-Leventhal Reference Haski-Leventhal2009; Plagnol and Huppert Reference Plagnol and Huppert2010). Volunteering rates increase alongside with economic development, which is consistent with the proposition that the rates should be higher in wealthier countries supporting higher human capital, liberal democracies supporting higher social capital, and in countries with higher levels of religiosity (Parboteeah et al. Reference Parboteeah, Cullen and Lim2004; Ziemek Reference Ziemek2006).
The role theory provides a rationale for our interest in the relationship between volunteering and quality of life across countries. It proposes that people accumulate roles to enhance their power and status, which then translates into greater well-being. However, too many roles may lead to strain and burden. A person in older age does not typically perform too many roles, and volunteering may provide a useful role enhancement. Such role enhancement makes one’s life more meaningful and leads to multiple positive outcomes such as increased quality of life (Moen et al. Reference Moen, Robinson and Dempster-McCain1995; Musick et al. Reference Musick, Herzog and House1999).
The main hypothesis relates to the Haski-Leventhal finding (Reference Haski-Leventhal2009, p. 394) concerning a relatively weak association between volunteering and well-being in countries where the volunteering rates are high and a relatively stronger association between volunteering and well-being in countries with lower rates. This interesting result could be explained by the volunteers’ sense of necessity for satisfaction (Cnaan and Cascio Reference Cnaan and Cascio1999) and the Social Origin TheoryFootnote 1 (Salamon and Anheier Reference Salamon and Anheier1998). The finding is also in line with a wider phenomenon known as the “crowding-out” effect (Day and Devlin Reference Day and Devlin1996; Bredtmann Reference Bredtmann2016), which proposes that when a public sector provides most of the essential services then what remains for volunteers is not seen as the crucial contribution to public life.
Arguably, it is important to investigate whether adding the countries of Central and Eastern Europe (CEE) will change the relationship between volunteering and the quality of life among older adults. It is hard to predict the relation for those countries due to historical reasons (Salamon and Sokolowski Reference Salamon and Sokolowski2001). Prior studies suggest a strong positive relation since the crowding effect is rather weak, while the importance of a sense of necessity is strong.
In the following parts of the paper, we start with a review of the current literature on volunteering and quality of life among the elderly. Next, we present the methodology used in this research, which is followed by data analysis. The final part provides conclusions and a discussion of potential implications.
Literature
Elderly volunteering is motivated mainly by the expected psychological benefits, rather than biological (e.g., sleep, food, free time), economic (e.g., paid work, housework), or political benefits (Smith Reference Smith1981). Older adults tend to volunteer because it gives them the opportunity to participate in meaningful activities (Haski-Leventhal Reference Haski-Leventhal2009).
Previous research presents ample evidence that helping others can have a positive effect on subjective well-being (e.g., Haski-Leventhal Reference Haski-Leventhal2009; Morrow-Howell et al. Reference Morrow-Howell, Hinterlong, Rozario and Tang2003; Thoits and Hewitt Reference Thoits and Hewitt2001; Meier and Stutzer Reference Meier and Stutzer2008). The positive effects of volunteering on the elderly are well known and commonly accepted (Morrow-Howell Reference Morrow-Howell2010). For instance, Thoits and Hewitt (Reference Thoits and Hewitt2001) examined how volunteering affects six different dimensions of well-being: levels of happiness, life satisfaction, self-esteem, sense of control over life, physical health, and depression. The scholars found that volunteering has a positive impact on both mental and physical health. People who volunteer are happier and experience better physical health and are less prone to depression. Volunteering provides a sense of purpose, encourages concern for others, and generates a sense of personal fulfillment (Stebbins and Graham Reference Stebbins and Graham2004). Wilson (Reference Wilson2012) identified a number of benefits from volunteering such as improvement in mental health and protection against symptoms of mental illness, lower levels of morbidity and mortality, increase in chances of obtaining a better education and a better job, accomplishment, social interaction and belongingness.
Jenkinson et al. (Reference Jenkinson, Dickens, Jones, Thompson-Coon, Taylor, Rogers, Bambra, Lang and Richards2013) examined forty experimental and cohort studies comparing the physical and mental health outcomes and mortality of a volunteering group against a non-volunteering group. They found that volunteering had a positive effect on people with depression, increased life satisfaction, and improved perceived well-being. A positive association between volunteering and subjective health was reported in Van Willigen (Reference Van Willigen2000), Greenfield and Marks (Reference Greenfield and Marks2004), Li and Ferraro (Reference Li and Ferraro2006), Borgonovi (Reference Borgonovi2008), Anderson et al. (Reference Anderson, Damianakis, Kröger, Wagner, Dawson, Binns, Bernstein, Caspi and Cook2014), and Detollenaere et al. (Reference Detollenaere, Willems and Baert2017).
Volunteering may improve the well-being of the elderly by engaging them in socially meaningful roles and providing the meaning and purpose in life (Greenfield and Marks Reference Greenfield and Marks2004; Prouteau and Wolff Reference Prouteau and Wolff2008). It helps to establish new relationships (Ehlers et al. Reference Ehlers, Naegele and Reichert2011). Volunteering supports meaningful activities in a person’s life after adverse events such as the death of a close family member. A positive relationship between social activities and the quality of life of older people has been repeatedly confirmed in research (Bath and Deeg Reference Bath and Deeg2005; Di Gessa and Grundy Reference Di Gessa and Grundy2014; Fernández-Mayoralas et al. Reference Fernández-Mayoralas, Rojo-Pérez, Martínez-Martín, Prieto-Flores, Rodríguez-Blázquez, Martín-García, Rojo-Abuín and Forjaz2015; Litwin and Stoeckel Reference Litwin and Stoeckel2013; Kehl and Stahlschmidt Reference Kehl and Stahlschmidt2016; Youssim et al. Reference Youssim, Hank and Litwin2015).
The positive effects of volunteering are amplified if volunteers feel reciprocity (i.e., their help is appreciated) and contribute their time for prosocial causes (Anderson et al. Reference Anderson, Damianakis, Kröger, Wagner, Dawson, Binns, Bernstein, Caspi and Cook2014). Intrinsically motivated volunteering activities benefit a person more than extrinsically motivated ones. Volunteering is not only positively related to desirable outcomes such as well-being, but it also buffers against the negative effects of low self-esteem (Russell et al. Reference Russell, Nyame-Mensah, de Wit and Handy2019).
As our study covers diverse historical, cultural, and economic settings,Footnote 2 benefits from helping others are observed in diverse contexts (Aknin et al. Reference Aknin, Barrington-Leigh, Dunn, Helliwell, Burns, Biswas-Diener and Norton2013). The elderly are likely to feel the need to volunteer–volunteering substitutes for their prior roles in society and provides opportunities for social contact and gives meaning to their lives (Sherman and Shavit Reference Sherman and Shavit2012). On the other hand, certain country-specific customs strengthening family bonds make elderly take care of grandchildren, which limits their availability to be involved in formal volunteering activities. This may explain low rates in Southern and Eastern European countries (Wilson and Musick Reference Wilson and Musick1997; Dykstra and Fokkema Reference Dykstra and Fokkema2011; Hank Reference Hank2007). Moreover, the elderly from Eastern European countries experienced forced “volunteering” during socialism when people were required to devote their time to social, cultural, and political causes. This life-course experience may lower their desire to provide assistance to others (Kuti Reference Kuti2004; Anheier and Salamon Reference Anheier and Salamon1999).
Research Hypotheses
Based on the literature review, we expect that the rate of formal volunteering among people aged 50+ in a country is largely related to the level of economic development. We also expect that the impact of volunteering on the quality of life of volunteers depends on the volunteering rate in a given country. Therefore, we hypothesize:
H1
The rates of formal volunteering among older people vary from country to country: the rates are high in developed European countries and low in countries of Central and Eastern Europe (CEE).
H2
The impact of volunteering on quality of life (QoL) is decreasing in accordance to volunteering rates: It is high in countries with low volunteering rates, and it is low if the rates are high.
Data and Methods
In this paper, we focus on the specific relationship between participation in volunteering and the quality of life (QoL) among older adults (50+). We use data from the wave 6 (release 6.0.0) of the Survey of Health, Aging and Retirement in Europe (SHARE) (Börsch-Supan Reference Börsch-Supan2017). SHARE has been used to study volunteering by: Erlinghagen and Hank (Reference Erlinghagen and Hank2006), Hank and Stuck (Reference Hank and Stuck2008), Haski-Leventhal (Reference Haski-Leventhal2009), Hank and Erlinghagen (Reference Hank and Erlinghagen2010a, Reference Hank and Erlinghagenb), Prinicpi et al. (Reference Prinicpi, Lindley, Perek-Białas and Turek2012), Hansen et al. (Reference Hansen, Aartsen, Slagsvold and Deindl2018) and Dávila (Reference Dávila2017). The dataset provides information on the socioeconomic status, health, and family relationships of people over 50 years old. The dataset includes information from 68,231 interviews conducted in 2015 in 18 countries.Footnote 3 The generic questionnaire is translated into the national languages. In each participating country, a probability sample was drawn. The household level response rate ranged from 30.3% in Luxemburg to 69.3% in Greece (Bergmann et al. Reference Bergmann, Kneip, De Luca and Scherpenzeel2017).
A volunteer is defined as a person who gave an answer “Done voluntary or charity work.” to a question: “Have you done any of these activities in the last month?” The same identification of formal volunteering was used in Haski-Leventhal (Reference Haski-Leventhal2009), Hank and Erlinghagen (Reference Hank and Erlinghagen2010a) and Wahrendorf et al. (Reference Wahrendorf, Blane, Matthews and Siegrist2016). We do not consider informal volunteering, such as providing unpaid help to a friend, neighbor, or family member. These types of activities are covered by different questions in SHARE. A detailed discussion of the challenges associated with the measurement of volunteering can be found in Salamon et al. (Reference Salamon, Haddock, Sokolowski, Butcher and Einolf2017).
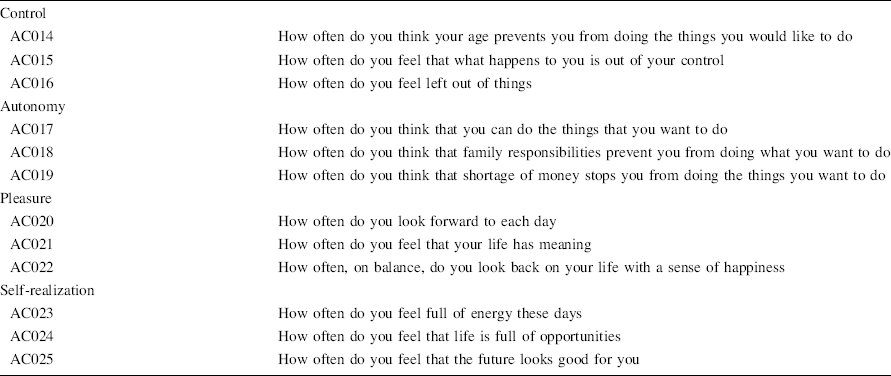
SHARE assesses the quality of life in two ways. First, a respondent is asked about the subjective assessment of life satisfaction on a scale from 0 to 10: “On a scale from 0 to 10 where 0 means completely dissatisfied and 10 means completely satisfied, how satisfied are you with your life?“. The second measure uses 12 questions developed for the purpose of CASP scale (Vanhoutte Reference Vanhoutte2012, Reference Vanhoutte2014). CASP stands for control, autonomy, self-realization, and pleasure, and it was constructed to measure the quality of life at the early old age as the dependent variable. The index was constructed based on the theory of satisfaction of needs (Maslow Reference Maslow1968; Doyal and Gough Reference Doyal and Gough1991). It assumes that quality of life depends on a degree of satisfaction of people’s needs. It uses four main domains that are important at the early old age for the positive experience of life: the possibility of influencing one’s own surroundings (control), the right of a person to be free from unwanted interference by others (autonomy), self-fulfillment (self-realization), and enjoying life (pleasure) (Hyde Reference Hyde2003). All of these domains are treated as equally important.
Even though CASP is referred to as a quality of life indicator, it may be also understood as a subjective well-being measure since it is purely based on subjective opinion and not on objective measures (Okulicz-Kozaryn Reference Okulicz-Kozaryn2013, Reference Okulicz-Kozaryn2016). Here, we use CASP-12 which is a shorter version of CASP-19 (see Table 4 in “Appendix”). The distribution of CASP among volunteers and non-volunteers across countries is provided in “Appendix.” A detailed analysis of CASP-12 in the SHARE is given by Vanhoutte (Reference Vanhoutte2012) who also considers CASP to be more like the subjective well-being measure than the quality of life measure. According to Gasper (Reference Gasper2010), both terms overlap significantly and sometimes the biggest difference is due to the fact that “well-being” is more popular among psychologists and “quality of life” is more popular among other social scientists. Kim et al. (Reference Kim, Gopalakrishnan, Blane, Peasey, Malyutina, Simonova, Kubinova, Pajak, Croezen, Bobak and Pikhart2015) lists studies in which CASP-19 was used.
To examine the association between participation in volunteering and quality of life, we first calculate the volunteering rates. Second, we measure the association between volunteering and the quality of life across countries using the Kendall’s tau-b correlation coefficient. It is a nonparametric measure based on the number of concordances and discordances in paired observations. It ranges between − 1 and 1. Kendall’s tau-b is an appropriate measure for two ordinal variables, while the Pearson correlation coefficient is more appropriate for continuous nominal data. Also, the Kendall coefficient is better for distributions with large skewness or excess kurtosis since it is less sensitive to outliers than the Pearson correlation. In the case of discrete binary variables in large samples, Pearson approach yields sensible results (Cox Reference Cox1972). It is instructive to compare the results from both measures.
Our sample includes people between 50 and 90 years old. From that age group, we exclude those with severe mobility problems, more than 2 limitations with activities of daily living (about 6%), 4 and more symptoms of depression on the EURO-D scale (about 9%).Footnote 4 We excluded people living in households with income lower than 1st percentile or higher than 95th percentile at country level. The sample used for analysis has 50,874 observations.
Results
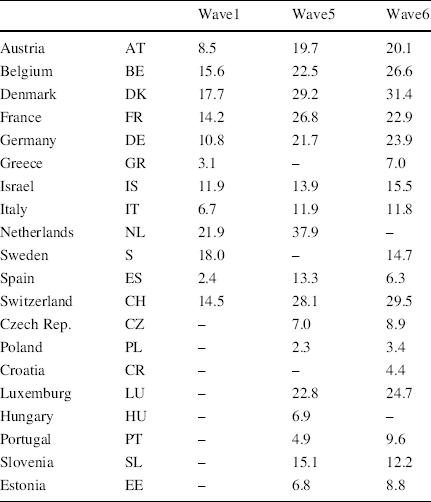
The volunteering rates in wave 1 (data collected in 2005) were noticeably lower than in the later surveys (Table 1). In the first wave, respondents were asked about volunteering in the last 4 weeks preceding interviews, while in the waves 5 and 6 the question was about activities in the last 12 months. Sweden is the only country with a lower rate in wave 6 than in wave 1. This is due to a change in translation of the term “voluntary” in Swedish questionnaire. Revised translation from wave 4 (and onwards) opted to more narrowly define volunteering.Footnote 5
Table 1 Volunteering rates among people 50+ (%)

Wave1 |
Wave5 |
Wave6 |
||
|---|---|---|---|---|
Austria |
AT |
8.5 |
19.7 |
20.1 |
Belgium |
BE |
15.6 |
22.5 |
26.6 |
Denmark |
DK |
17.7 |
29.2 |
31.4 |
France |
FR |
14.2 |
26.8 |
22.9 |
Germany |
DE |
10.8 |
21.7 |
23.9 |
Greece |
GR |
3.1 |
– |
7.0 |
Israel |
IS |
11.9 |
13.9 |
15.5 |
Italy |
IT |
6.7 |
11.9 |
11.8 |
Netherlands |
NL |
21.9 |
37.9 |
– |
Sweden |
S |
18.0 |
– |
14.7 |
Spain |
ES |
2.4 |
13.3 |
6.3 |
Switzerland |
CH |
14.5 |
28.1 |
29.5 |
Czech Rep. |
CZ |
– |
7.0 |
8.9 |
Poland |
PL |
– |
2.3 |
3.4 |
Croatia |
CR |
– |
– |
4.4 |
Luxemburg |
LU |
– |
22.8 |
24.7 |
Hungary |
HU |
– |
6.9 |
– |
Portugal |
PT |
– |
4.9 |
9.6 |
Slovenia |
SL |
– |
15.1 |
12.2 |
Estonia |
EE |
– |
6.8 |
8.8 |
“Wave 1” is from Haski-Leventhal (Reference Haski-Leventhal2009), “Wave 5” is from OECD (2016), and “Wave 6” is our own calculation
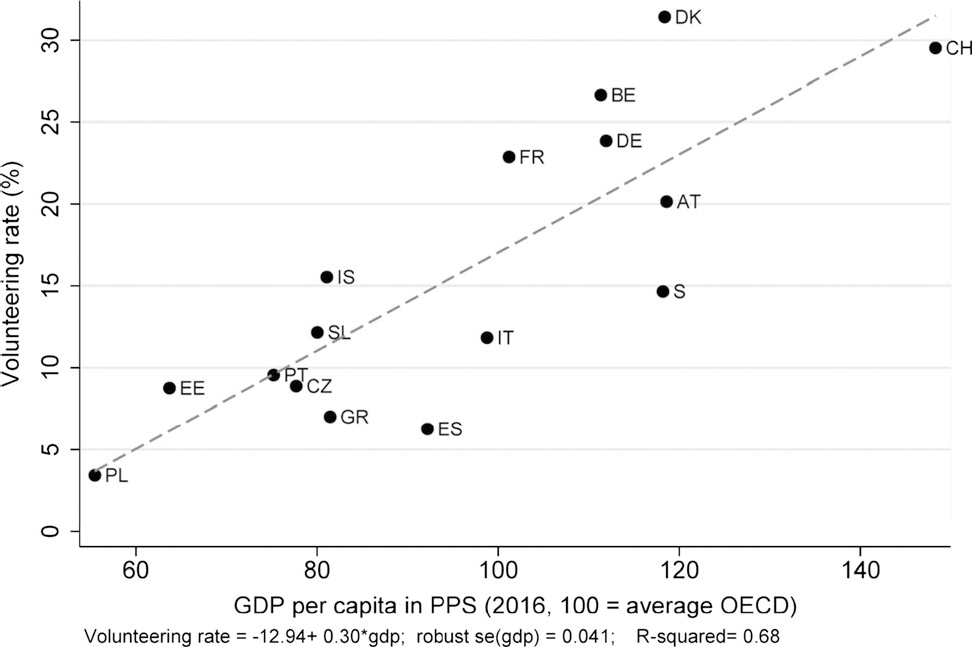
As expected, there are high rates for northern and western European countries: the Netherlands (nearly 40%), Denmark, Switzerland, and Belgium (around 30%). The rates in eastern and southern Europe are lower. In all Central and Eastern European countries (except Slovenia), they are below 10%. The lowest rates in wave 6 are for Croatia (4.4%) and Poland (3.4%). Figure 1 shows a linear relation between a country’s economic wealth (GDP per capita PPP)Footnote 6 and the volunteering rate among older adults (50+). OLS coefficient of 0.23 is statistically significant at 1% level and R 2 is 63.6%. Thus, we find support for hypothesis 1: volunteering rates are higher in more developed countries and lower in Central and Eastern Europe (CEE). The CEE rates are definitely lower than in more advanced Western and Northern European countries, but they are similar to Southern European countries.

Fig. 1 Volunteering rates and GDP. Comment. Huber/White/sandwich estimator of variance was applied.
Increasing heteroscedasticity of the volunteering rates along with economic wealth should be noted. Comparison of Denmark, Austria, and Sweden provides a good example.
The low rates of volunteering among elderly should be worrisome. First, volunteering is a productive activity that benefits society (Erlinghagen and Hank Reference Erlinghagen and Hank2006; Hank and Erlinghagen Reference Hank and Erlinghagen2010b; Prouteau and Wolff Reference Prouteau and Wolff2006). The monetary value of volunteering in the OECD25 group was estimated as 1.9% of GDP in purchasing power parity with the highest impact in Australia (4.7%), New Zealand (4.1%), the USA (3.7%), and Germany (3.3%) (OECD 2015).Footnote 7 Second, volunteering increases subjective well-being and quality of life through many channels that were mentioned above and that are included in the GDP measure.
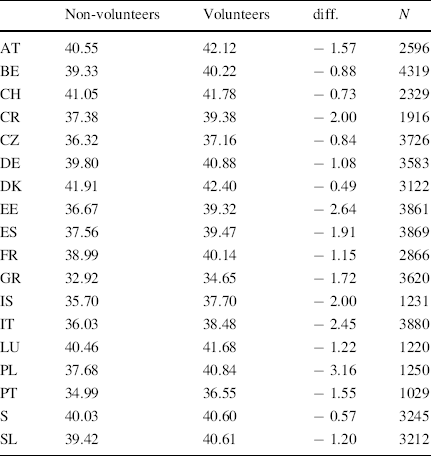
The average values of CASP for volunteers are higher than among non-volunteers in all countries regardless of GDP (Table 2). The highest absolute differences are among low-rate countries (Poland, Estonia, Italy, and Croatia). The lowest differences are for countries with high rates of volunteering (Denmark, Sweden, and Switzerland). This pattern is consistent with the main hypothesis. However, using differences in means can lead to false conclusions in this case.
Table 2 Average values of CASP—volunteers and non-volunteers.

Non-volunteers |
Volunteers |
diff. |
N |
|
|---|---|---|---|---|
AT |
40.55 |
42.12 |
− 1.57 |
2596 |
BE |
39.33 |
40.22 |
− 0.88 |
4319 |
CH |
41.05 |
41.78 |
− 0.73 |
2329 |
CR |
37.38 |
39.38 |
− 2.00 |
1916 |
CZ |
36.32 |
37.16 |
− 0.84 |
3726 |
DE |
39.80 |
40.88 |
− 1.08 |
3583 |
DK |
41.91 |
42.40 |
− 0.49 |
3122 |
EE |
36.67 |
39.32 |
− 2.64 |
3861 |
ES |
37.56 |
39.47 |
− 1.91 |
3869 |
FR |
38.99 |
40.14 |
− 1.15 |
2866 |
GR |
32.92 |
34.65 |
− 1.72 |
3620 |
IS |
35.70 |
37.70 |
− 2.00 |
1231 |
IT |
36.03 |
38.48 |
− 2.45 |
3880 |
LU |
40.46 |
41.68 |
− 1.22 |
1220 |
PL |
37.68 |
40.84 |
− 3.16 |
1250 |
PT |
34.99 |
36.55 |
− 1.55 |
1029 |
S |
40.03 |
40.60 |
− 0.57 |
3245 |
SL |
39.42 |
40.61 |
− 1.20 |
3212 |
Differences are statistically significant at 5% level
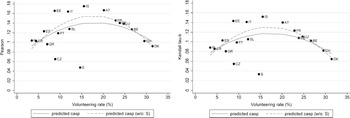
Next, we proceed to the main part of data analysis, and test hypothesis 2. Panel A of Fig. 2 shows the values of Pearson’s linear correlation coefficients. Panel B shows the values of Kendall’s tau-b coefficients. The highest value of the Kendall correlation coefficient was obtained for Israel: 0.15. Other high-impact countries were Italy and Austria, countries with average volunteering rates. Weaker associations were observed for countries with either low or high rates. Hence, we find only partial support for hypothesis 2.

Fig. 2 Volunteering rates and its impact on QoL. Linear and quadratic effects are statistically significant at 5% level when Sweden is excluded from the regressions.
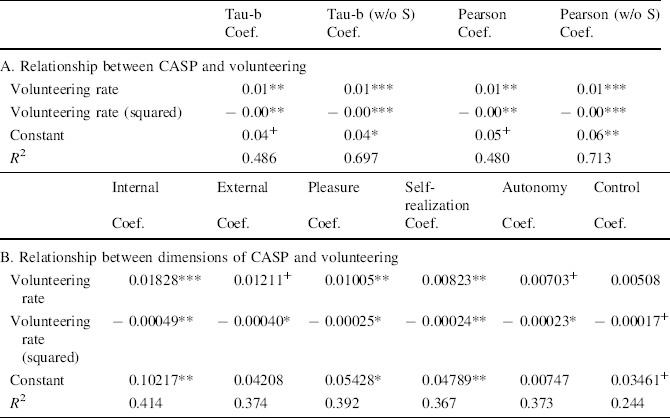
To visualize the pattern, we fit linear regressions models with a quadratic term. Regression results are given in “Appendix” (Table 8). We find support for the finding in Haski-Leventhal (Reference Haski-Leventhal2009) that the high rates of volunteering are not associated with a strong positive relation of volunteering and well-being. It is interesting that dispersion of association decreases along with the volunteering rate. For countries with the rate above 20% the correlations follow the well-fitted path. We may speculate that for “rich” countries the country-specific factors are becoming less important in explaining the impact of volunteering on QoL.
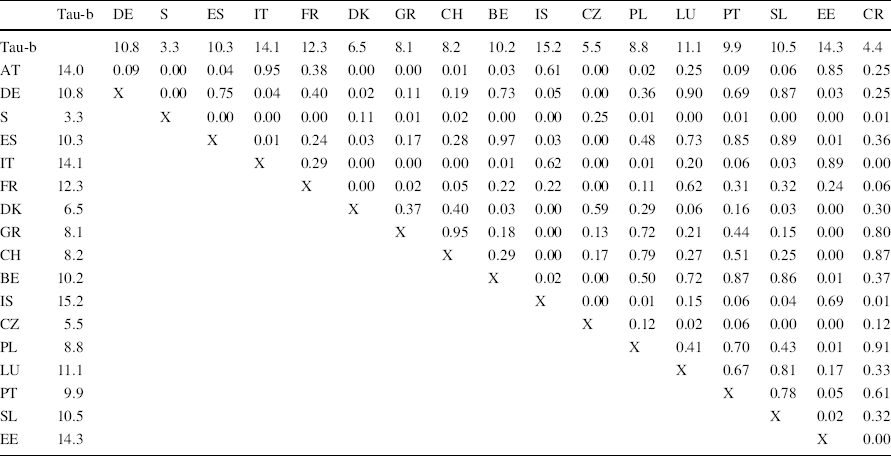
Results from cross-sectional linear regression are very suggestive. However, a low number of observations (N = 18) may be problematic. Therefore, we make pairwise comparisons of tau-b coefficients (Table 6 in “Appendix” shows statistical tests). We show that some country differences in tau-b values for the association between participation in volunteering and CASP (QoL indicator) are not statistically different. For example, associations in Germany (tau-b = 0.10) and in Slovenia (tau-b = 0.11) are not statistically different, despite large differences in the rates of volunteering. At the same time, tau-b of 0.14 for Austria is higher than the tau-b values for Germany and Slovenia. There are many other examples of non-monotonic order. For example, volunteering effects on QoL in Spain, Portugal, Poland, and Greece are statistically the same as in Germany and Belgium, but the rates of volunteering are noticeably lower. Also, different volunteering effects are observed in countries with similar volunteering rates, e.g., Estonia and the Czech Republic. In Estonia, the volunteering effect on QoL is stronger (0.141) than in the Czech Republic (0.053), although the rates of volunteering are similar. We conclude that the inverted-U-type relation between volunteering rate and its impact on QoL is supported by two statistical approaches.
The weak association across highly developed countries is consistent with previous research. Generous welfare policies in such countries meet the demand for most social needs and thus reduce the demand for volunteering (Salamon and Anheier Reference Salamon and Anheier1998; Stadelmann-Steffen Reference Stadelmann-Steffen2011). External factors may be less important than internal factors in explaining the impact of volunteering on QoL.
In contrast, in less developed countries, with weaker social welfare systems, volunteers are probably more needed. Lack of generous social policy means that volunteers engage in socially significant issues and therefore experience a sense of real accomplishment, which increases their QoL.
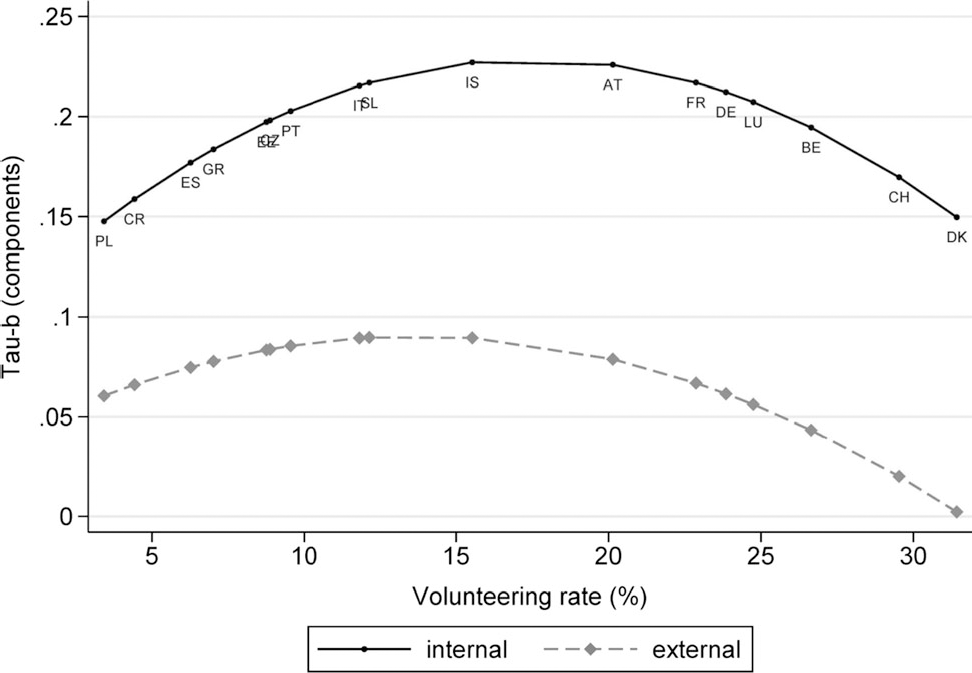
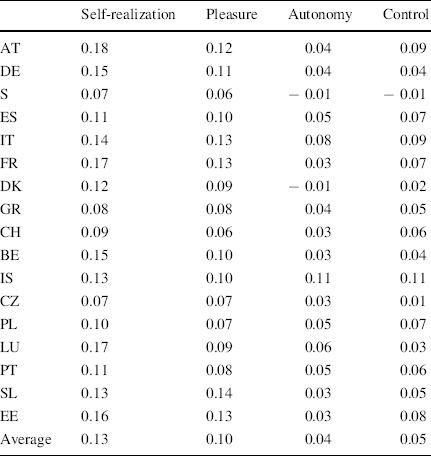
Wiggins et al. (Reference Wiggins, Higgs, Hyde and Blane2004) notice that “self-realization” and “pleasure” dimensions included in CASP are associated with individual (internal) characteristics of a person. On the other hand, “control” and “autonomy” are related to prerequisites of free participation in society and they are, at least partially, dependent on external characteristics of the social environment. We repeated the previous exercise for external and internal dimensions of CASP. We calculated tau-b correlations for the dimensions of CASP (Table 7). For components related to internal dimension, the correlation is 0.13 for self-realization and 0.10 for pleasure. Correlations for components related to external dimension are lower: 0.004 for autonomy and 0.05 for control.
Figure 3 shows fitted values and predicted relation between volunteering rate and its association with external and internal dimensions of QoL. The positive impact of volunteering on QoL is more related to its impact on individual domains than on features of the external environment. This is true regardless of the volunteering rate. Also, the relative importance of the internal dimension in countries with high volunteering rates (Denmark and Switzerland) is higher than in countries with low rates. In Croatia, Greece, and Spain where the overall association is the same as in Denmark and Switzerland, the relative impact of external components is noticeably more important. The same association between volunteering and its impact on QoL in different countries may be explained by different mechanisms.

Fig. 3 Associations between volunteering and dimensions of CASP. Note: Tau-b correlation coefficient between volunteering and internal/external dimensions of CASP.
Conclusion and Discussion
We used data from wave 6 of the SHARE survey to examine the relationship between volunteering and quality of life of older adults (50+) across different countries. We calculated the correlation coefficients of Kendall’s tau-b between CASP-12 and volunteering. The highest correlation values were obtained for countries with medium volunteering rates. In countries where volunteering is the most popular (Denmark, Switzerland, and Belgium) and in those with the lowest rates (Poland, Greece, the Czech Republic, and Spain), the average relationship is weaker.
The paper was motivated by work of Haski-Leventhal (Reference Haski-Leventhal2009), who found a negative relationship between the volunteering rates at the country level and impact of volunteering on individual well-being. We demonstrated that the Haski-Leventhal (Reference Haski-Leventhal2009) result is not robust for the extended sample including countries of Central and Eastern Europe. We found low rates of formal volunteering among older people in CEE and low impact of formal volunteering on QoL in these countries. The low popularity of volunteering among the elderly may be due to a negative attitude toward volunteering caused by the experience of forced volunteering during socialism. Discussing low rates of volunteering in CEE, we need to remember about different life courses of the inhabitants of Western and Eastern Europe (Salamon and Sokolowski Reference Salamon and Sokolowski2001). The extension of the research into questions about the role of life-course events requires much more detailed data than available in SHARE.
With a larger and more diverse set of countries, we found strong support for the inverted-U relationship between volunteering rates and its impact on QoL. We tested the statistical significance of differences in Kendall tau-b correlation coefficients between countries and fitted a simple linear regression model with the quadratic term. Different explanations for weak association for low and high rate countries are plausible. Both arguments, social norms and crowding out, contribute to a better understanding of why volunteering has a limited impact on the quality of life in affluent countries.
Our finding that “gains” from volunteering are more related to the internal dimension than to the external (social) conditions is relevant for policy design. “self-realization” and “pleasure” are more important than “control” and “autonomy” in all countries. This should be taken into consideration while debating on encouraging volunteering among the elderly. We propose a communication policy to highlight the positive impacts of volunteering on elderly volunteers. Of course, an ideal solution would be to direct such policy to older adults who view volunteering as a way to achieve individual goals.
The relatively stronger role of the external dimensions of the CASP index in countries with low volunteering rates is consistent with explanations based on feelings of necessity and lack of crowding out (Bredtmann Reference Bredtmann2016). Further investigations of factors connecting volunteering and QoL in countries with low volunteering rates are needed.
The exploratory analysis in this paper applies harmonized variables and large dataset to present new insights on volunteering. However, it is possible that volunteering effect on QoL in low-rate countries is underestimated due to selection bias. One may expect that if volunteering is not popular, only those who are most likely to benefit significantly in terms of their quality of life should be involved in such activity (Plagnol and Huppert Reference Plagnol and Huppert2010).
Our results do not allow for making causal conclusions. In the study, we use self-reports of volunteering as an independent variable and values of CASP index as a dependent variable. Self-reports of volunteering are relatively free of response bias since the self-reports consider an objective activity. The CASP index was chosen because it is less exposed to arbitrary assessments and less dependent on highly variable factors affecting the overall satisfaction rating, such as mood or time of year (White Reference White2007). However, it is still possible that results may be prone to response bias.
We discuss empirical results without referring or making an attempt to formulate theory explaining the empirical pattern described in the paper. More information about cultural, historical, and economic connections with volunteering by older people is needed before such an attempt is made. We consider this paper as a stepping stone that might help to construct such a theory in future.
Acknowledgements
The study was funded from a Grant 2016/21/B/HS4/03058 (Narodowe Centrum Nauki). This paper uses data from SHARE Wave 6 (https://doi.org/10.6103/share.w6.611), see Börsch-Supan et al. (Reference Börsch-Supan, Brandt, Hunkler, Kneip, Korbmacher, Malter, Schaan, Stuck and Zuber2013) for methodological details. (1). The SHARE data collection has been primarily funded by the European Commission through FP5 (QLK6-CT-2001-00360), FP6 (SHARE-I3: RII-CT-2006-062193, COMPARE: CIT5-CT-2005-028857, SHARELIFE: CIT4-CT-2006-028812), and FP7 (SHARE-PREP: N°211909, SHARE-LEAP: N°227822, SHARE M4: N°261982). Additional funding from the German Ministry of Education and Research, the Max Planck Society for the Advancement of Science, the U.S. National Institute on Aging (U01_AG09740-13S2, P01_AG005842, P01_AG08291, P30_AG12815, R21_AG025169, Y1-AG-4553-01, IAG_BSR06-11, OGHA_04-064, HHSN271201300071C) and from various national funding sources is gratefully acknowledged (see www.share-project.org).
Appendix
See Fig. 4 and Tables 3 and 4.

Fig. 4 CASP distribution
Table 3 Variable definitions (SHARE, wave 6)
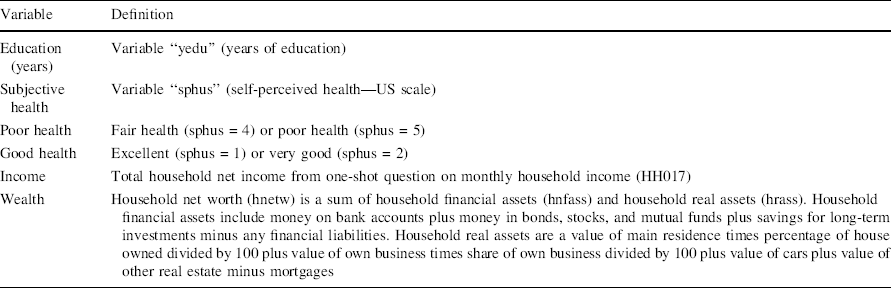
Variable |
Definition |
|---|---|
Education (years) |
Variable “yedu” (years of education) |
Subjective health |
Variable “sphus” (self-perceived health—US scale) |
Poor health |
Fair health (sphus = 4) or poor health (sphus = 5) |
Good health |
Excellent (sphus = 1) or very good (sphus = 2) |
Income |
Total household net income from one-shot question on monthly household income (HH017) |
Wealth |
Household net worth (hnetw) is a sum of household financial assets (hnfass) and household real assets (hrass). Household financial assets include money on bank accounts plus money in bonds, stocks, and mutual funds plus savings for long-term investments minus any financial liabilities. Household real assets are a value of main residence times percentage of house owned divided by 100 plus value of own business times share of own business divided by 100 plus value of cars plus value of other real estate minus mortgages |
Table 4 Questions included in CASP-12 (SHARE)

Control |
|
AC014 |
How often do you think your age prevents you from doing the things you would like to do |
AC015 |
How often do you feel that what happens to you is out of your control |
AC016 |
How often do you feel left out of things |
Autonomy |
|
AC017 |
How often do you think that you can do the things that you want to do |
AC018 |
How often do you think that family responsibilities prevent you from doing what you want to do |
AC019 |
How often do you think that shortage of money stops you from doing the things you want to do |
Pleasure |
|
AC020 |
How often do you look forward to each day |
AC021 |
How often do you feel that your life has meaning |
AC022 |
How often, on balance, do you look back on your life with a sense of happiness |
Self-realization |
|
AC023 |
How often do you feel full of energy these days |
AC024 |
How often do you feel that life is full of opportunities |
AC025 |
How often do you feel that the future looks good for you |
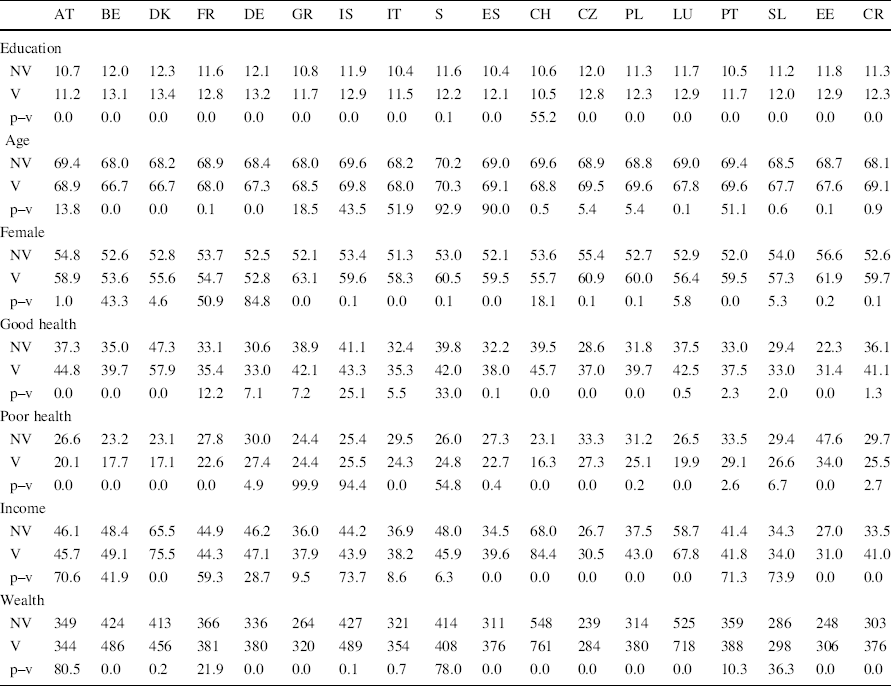
The descriptive analysis is complemented by a comparison of the conditional averages for the main personal determinants of QoL in Table 5. Results are as expected. In all countries, the average number of years of education for volunteers is higher than for non-volunteers. Education and health are presumably highly correlated among elderly, and they are usually identified as key predictors of QoL. The subjective health differs between volunteers and non-volunteers in highly developed countries. There is no clear volunteering pattern between males and females. In France and Germany, men are more involved in volunteering than women, while the opposite is true in Southern Europe (Greece, Portugal, Italy, and Spain). There is no gender effect among CEE countries. The impact of income on volunteering is mixed. In some countries (Denmark, Belgium, Austria, Portugal, Slovenia, the Czech Republic, and Poland), household income per person (in purchasing power parity units) is the same for volunteers and non-volunteers. In Germany, France, Israel, Italy, Estonia, and Spain, the income is higher in households with a volunteer, and in Greece, it is higher in households without a volunteer (Tables 6, 7, 8).
Table 5 Descriptive statistics: conditional averages and significance tests of differences

AT |
BE |
DK |
FR |
DE |
GR |
IS |
IT |
S |
ES |
CH |
CZ |
PL |
LU |
PT |
SL |
EE |
CR |
|
|---|---|---|---|---|---|---|---|---|---|---|---|---|---|---|---|---|---|---|
Education |
||||||||||||||||||
NV |
10.7 |
12.0 |
12.3 |
11.6 |
12.1 |
10.8 |
11.9 |
10.4 |
11.6 |
10.4 |
10.6 |
12.0 |
11.3 |
11.7 |
10.5 |
11.2 |
11.8 |
11.3 |
V |
11.2 |
13.1 |
13.4 |
12.8 |
13.2 |
11.7 |
12.9 |
11.5 |
12.2 |
12.1 |
10.5 |
12.8 |
12.3 |
12.9 |
11.7 |
12.0 |
12.9 |
12.3 |
p–v |
0.0 |
0.0 |
0.0 |
0.0 |
0.0 |
0.0 |
0.0 |
0.0 |
0.1 |
0.0 |
55.2 |
0.0 |
0.0 |
0.0 |
0.0 |
0.0 |
0.0 |
0.0 |
Age |
||||||||||||||||||
NV |
69.4 |
68.0 |
68.2 |
68.9 |
68.4 |
68.0 |
69.6 |
68.2 |
70.2 |
69.0 |
69.6 |
68.9 |
68.8 |
69.0 |
69.4 |
68.5 |
68.7 |
68.1 |
V |
68.9 |
66.7 |
66.7 |
68.0 |
67.3 |
68.5 |
69.8 |
68.0 |
70.3 |
69.1 |
68.8 |
69.5 |
69.6 |
67.8 |
69.6 |
67.7 |
67.6 |
69.1 |
p–v |
13.8 |
0.0 |
0.0 |
0.1 |
0.0 |
18.5 |
43.5 |
51.9 |
92.9 |
90.0 |
0.5 |
5.4 |
5.4 |
0.1 |
51.1 |
0.6 |
0.1 |
0.9 |
Female |
||||||||||||||||||
NV |
54.8 |
52.6 |
52.8 |
53.7 |
52.5 |
52.1 |
53.4 |
51.3 |
53.0 |
52.1 |
53.6 |
55.4 |
52.7 |
52.9 |
52.0 |
54.0 |
56.6 |
52.6 |
V |
58.9 |
53.6 |
55.6 |
54.7 |
52.8 |
63.1 |
59.6 |
58.3 |
60.5 |
59.5 |
55.7 |
60.9 |
60.0 |
56.4 |
59.5 |
57.3 |
61.9 |
59.7 |
p–v |
1.0 |
43.3 |
4.6 |
50.9 |
84.8 |
0.0 |
0.1 |
0.0 |
0.1 |
0.0 |
18.1 |
0.1 |
0.1 |
5.8 |
0.0 |
5.3 |
0.2 |
0.1 |
Good health |
||||||||||||||||||
NV |
37.3 |
35.0 |
47.3 |
33.1 |
30.6 |
38.9 |
41.1 |
32.4 |
39.8 |
32.2 |
39.5 |
28.6 |
31.8 |
37.5 |
33.0 |
29.4 |
22.3 |
36.1 |
V |
44.8 |
39.7 |
57.9 |
35.4 |
33.0 |
42.1 |
43.3 |
35.3 |
42.0 |
38.0 |
45.7 |
37.0 |
39.7 |
42.5 |
37.5 |
33.0 |
31.4 |
41.1 |
p–v |
0.0 |
0.0 |
0.0 |
12.2 |
7.1 |
7.2 |
25.1 |
5.5 |
33.0 |
0.1 |
0.0 |
0.0 |
0.0 |
0.5 |
2.3 |
2.0 |
0.0 |
1.3 |
Poor health |
||||||||||||||||||
NV |
26.6 |
23.2 |
23.1 |
27.8 |
30.0 |
24.4 |
25.4 |
29.5 |
26.0 |
27.3 |
23.1 |
33.3 |
31.2 |
26.5 |
33.5 |
29.4 |
47.6 |
29.7 |
V |
20.1 |
17.7 |
17.1 |
22.6 |
27.4 |
24.4 |
25.5 |
24.3 |
24.8 |
22.7 |
16.3 |
27.3 |
25.1 |
19.9 |
29.1 |
26.6 |
34.0 |
25.5 |
p–v |
0.0 |
0.0 |
0.0 |
0.0 |
4.9 |
99.9 |
94.4 |
0.0 |
54.8 |
0.4 |
0.0 |
0.0 |
0.2 |
0.0 |
2.6 |
6.7 |
0.0 |
2.7 |
Income |
||||||||||||||||||
NV |
46.1 |
48.4 |
65.5 |
44.9 |
46.2 |
36.0 |
44.2 |
36.9 |
48.0 |
34.5 |
68.0 |
26.7 |
37.5 |
58.7 |
41.4 |
34.3 |
27.0 |
33.5 |
V |
45.7 |
49.1 |
75.5 |
44.3 |
47.1 |
37.9 |
43.9 |
38.2 |
45.9 |
39.6 |
84.4 |
30.5 |
43.0 |
67.8 |
41.8 |
34.0 |
31.0 |
41.0 |
p–v |
70.6 |
41.9 |
0.0 |
59.3 |
28.7 |
9.5 |
73.7 |
8.6 |
6.3 |
0.0 |
0.0 |
0.0 |
0.0 |
0.0 |
71.3 |
73.9 |
0.0 |
0.0 |
Wealth |
||||||||||||||||||
NV |
349 |
424 |
413 |
366 |
336 |
264 |
427 |
321 |
414 |
311 |
548 |
239 |
314 |
525 |
359 |
286 |
248 |
303 |
V |
344 |
486 |
456 |
381 |
380 |
320 |
489 |
354 |
408 |
376 |
761 |
284 |
380 |
718 |
388 |
298 |
306 |
376 |
p–v |
80.5 |
0.0 |
0.2 |
21.9 |
0.0 |
0.0 |
0.1 |
0.7 |
78.0 |
0.0 |
0.0 |
0.0 |
0.0 |
0.0 |
10.3 |
36.3 |
0.0 |
0.0 |
Variable definitions are given in Table 3
SHARE data, Wave 6
NV non-volunteer, V volunteer, p–v p value
Table 6 Significance levels for correlations between CASP and volunteering (Kendall’s tau-b)

Tau-b |
DE |
S |
ES |
IT |
FR |
DK |
GR |
CH |
BE |
IS |
CZ |
PL |
LU |
PT |
SL |
EE |
CR |
|
|---|---|---|---|---|---|---|---|---|---|---|---|---|---|---|---|---|---|---|
Tau-b |
10.8 |
3.3 |
10.3 |
14.1 |
12.3 |
6.5 |
8.1 |
8.2 |
10.2 |
15.2 |
5.5 |
8.8 |
11.1 |
9.9 |
10.5 |
14.3 |
4.4 |
|
AT |
14.0 |
0.09 |
0.00 |
0.04 |
0.95 |
0.38 |
0.00 |
0.00 |
0.01 |
0.03 |
0.61 |
0.00 |
0.02 |
0.25 |
0.09 |
0.06 |
0.85 |
0.25 |
DE |
10.8 |
X |
0.00 |
0.75 |
0.04 |
0.40 |
0.02 |
0.11 |
0.19 |
0.73 |
0.05 |
0.00 |
0.36 |
0.90 |
0.69 |
0.87 |
0.03 |
0.25 |
S |
3.3 |
X |
0.00 |
0.00 |
0.00 |
0.11 |
0.01 |
0.02 |
0.00 |
0.00 |
0.25 |
0.01 |
0.00 |
0.01 |
0.00 |
0.00 |
0.01 |
|
ES |
10.3 |
X |
0.01 |
0.24 |
0.03 |
0.17 |
0.28 |
0.97 |
0.03 |
0.00 |
0.48 |
0.73 |
0.85 |
0.89 |
0.01 |
0.36 |
||
IT |
14.1 |
X |
0.29 |
0.00 |
0.00 |
0.00 |
0.01 |
0.62 |
0.00 |
0.01 |
0.20 |
0.06 |
0.03 |
0.89 |
0.00 |
|||
FR |
12.3 |
X |
0.00 |
0.02 |
0.05 |
0.22 |
0.22 |
0.00 |
0.11 |
0.62 |
0.31 |
0.32 |
0.24 |
0.06 |
||||
DK |
6.5 |
X |
0.37 |
0.40 |
0.03 |
0.00 |
0.59 |
0.29 |
0.06 |
0.16 |
0.03 |
0.00 |
0.30 |
|||||
GR |
8.1 |
X |
0.95 |
0.18 |
0.00 |
0.13 |
0.72 |
0.21 |
0.44 |
0.15 |
0.00 |
0.80 |
||||||
CH |
8.2 |
X |
0.29 |
0.00 |
0.17 |
0.79 |
0.27 |
0.51 |
0.25 |
0.00 |
0.87 |
|||||||
BE |
10.2 |
X |
0.02 |
0.00 |
0.50 |
0.72 |
0.87 |
0.86 |
0.01 |
0.37 |
||||||||
IS |
15.2 |
X |
0.00 |
0.01 |
0.15 |
0.06 |
0.04 |
0.69 |
0.01 |
|||||||||
CZ |
5.5 |
X |
0.12 |
0.02 |
0.06 |
0.00 |
0.00 |
0.12 |
||||||||||
PL |
8.8 |
X |
0.41 |
0.70 |
0.43 |
0.01 |
0.91 |
|||||||||||
LU |
11.1 |
X |
0.67 |
0.81 |
0.17 |
0.33 |
||||||||||||
PT |
9.9 |
X |
0.78 |
0.05 |
0.61 |
|||||||||||||
SL |
10.5 |
X |
0.02 |
0.32 |
||||||||||||||
EE |
14.3 |
X |
0.00 |
Table 7 Kendall’s tau-b correlation coefficients for dimensions of CASP and volunteering

Self-realization |
Pleasure |
Autonomy |
Control |
|
|---|---|---|---|---|
AT |
0.18 |
0.12 |
0.04 |
0.09 |
DE |
0.15 |
0.11 |
0.04 |
0.04 |
S |
0.07 |
0.06 |
− 0.01 |
− 0.01 |
ES |
0.11 |
0.10 |
0.05 |
0.07 |
IT |
0.14 |
0.13 |
0.08 |
0.09 |
FR |
0.17 |
0.13 |
0.03 |
0.07 |
DK |
0.12 |
0.09 |
− 0.01 |
0.02 |
GR |
0.08 |
0.08 |
0.04 |
0.05 |
CH |
0.09 |
0.06 |
0.03 |
0.06 |
BE |
0.15 |
0.10 |
0.03 |
0.04 |
IS |
0.13 |
0.10 |
0.11 |
0.11 |
CZ |
0.07 |
0.07 |
0.03 |
0.01 |
PL |
0.10 |
0.07 |
0.05 |
0.07 |
LU |
0.17 |
0.09 |
0.06 |
0.03 |
PT |
0.11 |
0.08 |
0.05 |
0.06 |
SL |
0.13 |
0.14 |
0.03 |
0.05 |
EE |
0.16 |
0.13 |
0.03 |
0.08 |
Average |
0.13 |
0.10 |
0.04 |
0.05 |
Table 8 Regression results

Tau-b |
Tau-b (w/o S) |
Pearson |
Pearson (w/o S) |
|
|---|---|---|---|---|
Coef. |
Coef. |
Coef. |
Coef. |
|
A. Relationship between CASP and volunteering |
||||
Volunteering rate |
0.01** |
0.01*** |
0.01** |
0.01*** |
Volunteering rate (squared) |
− 0.00** |
− 0.00*** |
− 0.00** |
− 0.00*** |
Constant |
0.04+ |
0.04* |
0.05+ |
0.06** |
R 2 |
0.486 |
0.697 |
0.480 |
0.713 |
Internal |
External |
Pleasure |
Self-realization |
Autonomy |
Control |
|
|---|---|---|---|---|---|---|
Coef. |
Coef. |
Coef. |
Coef. |
Coef. |
Coef. |
|
B. Relationship between dimensions of CASP and volunteering |
||||||
Volunteering rate |
0.01828*** |
0.01211+ |
0.01005** |
0.00823** |
0.00703+ |
0.00508 |
Volunteering rate (squared) |
− 0.00049** |
− 0.00040* |
− 0.00025* |
− 0.00024** |
− 0.00023* |
− 0.00017+ |
Constant |
0.10217** |
0.04208 |
0.05428* |
0.04789** |
0.00747 |
0.03461+ |
R 2 |
0.414 |
0.374 |
0.392 |
0.367 |
0.373 |
0.244 |
Sweden is excluded
+p < 0.10, *p < 0.05, **p < 0.01, ***p < 0.001


 Open access