


Introduction
Undernutrition (from here on, malnutrition) is defined as a condition resulting from an inadequate intake, assimilation or utilisation of nutrients, which leads to altered body composition (notably, the loss of fat-free mass and decreased physical and mental functions), negatively impacting on clinical outcomes and quality of life(Reference Cederholm, Barazzoni, Austin, Ballmer, Biolo and Bischoff1). Malnutrition can be caused or aggravated by inflammatory states or metabolic disturbances related to acute or chronic diseases(Reference Cederholm, Barazzoni, Austin, Ballmer, Biolo and Bischoff1–Reference Cederholm, Jensen, Correia, Gonzalez, Fukushima and Higashiguchi3). Conversely, psychiatric conditions such as anorexia nervosa (AN) and depression, malabsorption and advanced age might be responsible for non-inflammation-driven malnutrition.
Regardless of the cause, malnutrition is associated with increased morbidity, mortality and healthcare costs. The initial step in evaluating nutritional status involves malnutrition risk screening to rapidly identify people ‘at risk’ by the use of any validated screening tool(Reference van Bokhorst-de van der Schueren, Guaitoli, Jansma and de Vet4), for instance, the malnutrition universal screening tool (MUST) and the nutritional risk index (NRI). Other tools, such as the subjective global assessment (SGA), the mini-nutritional assessment (MNA) and the Global Leadership Initiative on Malnutrition (GLIM) criteria, combine data on nutritional status with clinical observations for a more detailed assessment and diagnosis of malnutrition(Reference van Bokhorst-de van der Schueren, Guaitoli, Jansma and de Vet4). Notably, malnutrition risk is itself associated with longer hospital stays, poor prognosis and mortality(Reference Cederholm, Barazzoni, Austin, Ballmer, Biolo and Bischoff1,Reference Di Vincenzo, D’Elia, Ballarin, Pasanisi and Scalfi5,Reference Cioffi, Scialò, Di Vincenzo, Gelzo, Marra and Testa6) .
Malnourished patients are highly susceptible to infection and postoperative complications due to impaired intestinal and systemic immune functions(Reference Zhao, Wang, Yang, Pan, Liu and Ge7,Reference Welsh, Farmery, MacLennan, Sheridan, Barclay and Guillou8) . In this perspective, intestinal permeability (IP), which is a critical facet of intestinal health as an expression of the functional barrier between the gut lumen and the circulatory system, plays a key role both in controlling the passage of various nutrients, electrolytes and water, and limiting the exposure of potentially harmful substances to the host(Reference Chelakkot, Ghim and Ryu9). An intact barrier prevents the penetration of pathogens, toxins, antigens and pro-inflammatory agents(Reference Vancamelbeke and Vermeire10).
The exchanges between the lumen and the gastrointestinal wall are mostly regulated by tight junctions (TJ), with specific proteins (e.g. claudin, occludin) sealing the paracellular spaces between epithelial cells to maintain the gastrointestinal barrier(Reference Zihni, Mills, Matter and Balda11). TJ dysfunctions and any disruption of the barrier system result in a ‘leaky’ intestine and increased IP, with the passage of several substances (including pro-inflammatory luminal molecules) from the mucosal layer to the bloodstream, promoting mucosal immune activation, inflammation and tissue damage, as well as possible systemic adverse effects(Reference Schoultz and Keita12). Although of interest for both research and clinical purposes, the measurement of IP does not represent an easy task and may be carried out with several methods, such as the multi-sugar test (urinary excretion of sucrose, lactulose, l-rhamnose, erythritol and sucralose), the expression of TJ protein, and the analysis of circulating and faecal inflammatory molecules (e.g. zonulin, fatty acid binding proteins (FABP), lipopolysaccharides (LPS), LPS-binding protein, calprotectin, and soluble CD14 (sCD14) and soluble CD163 (sCD163)), which represent indirect indicators of microbial translocation and monocyte/macrophage activation)(Reference Schoultz and Keita12–Reference Mishra and Makharia15).
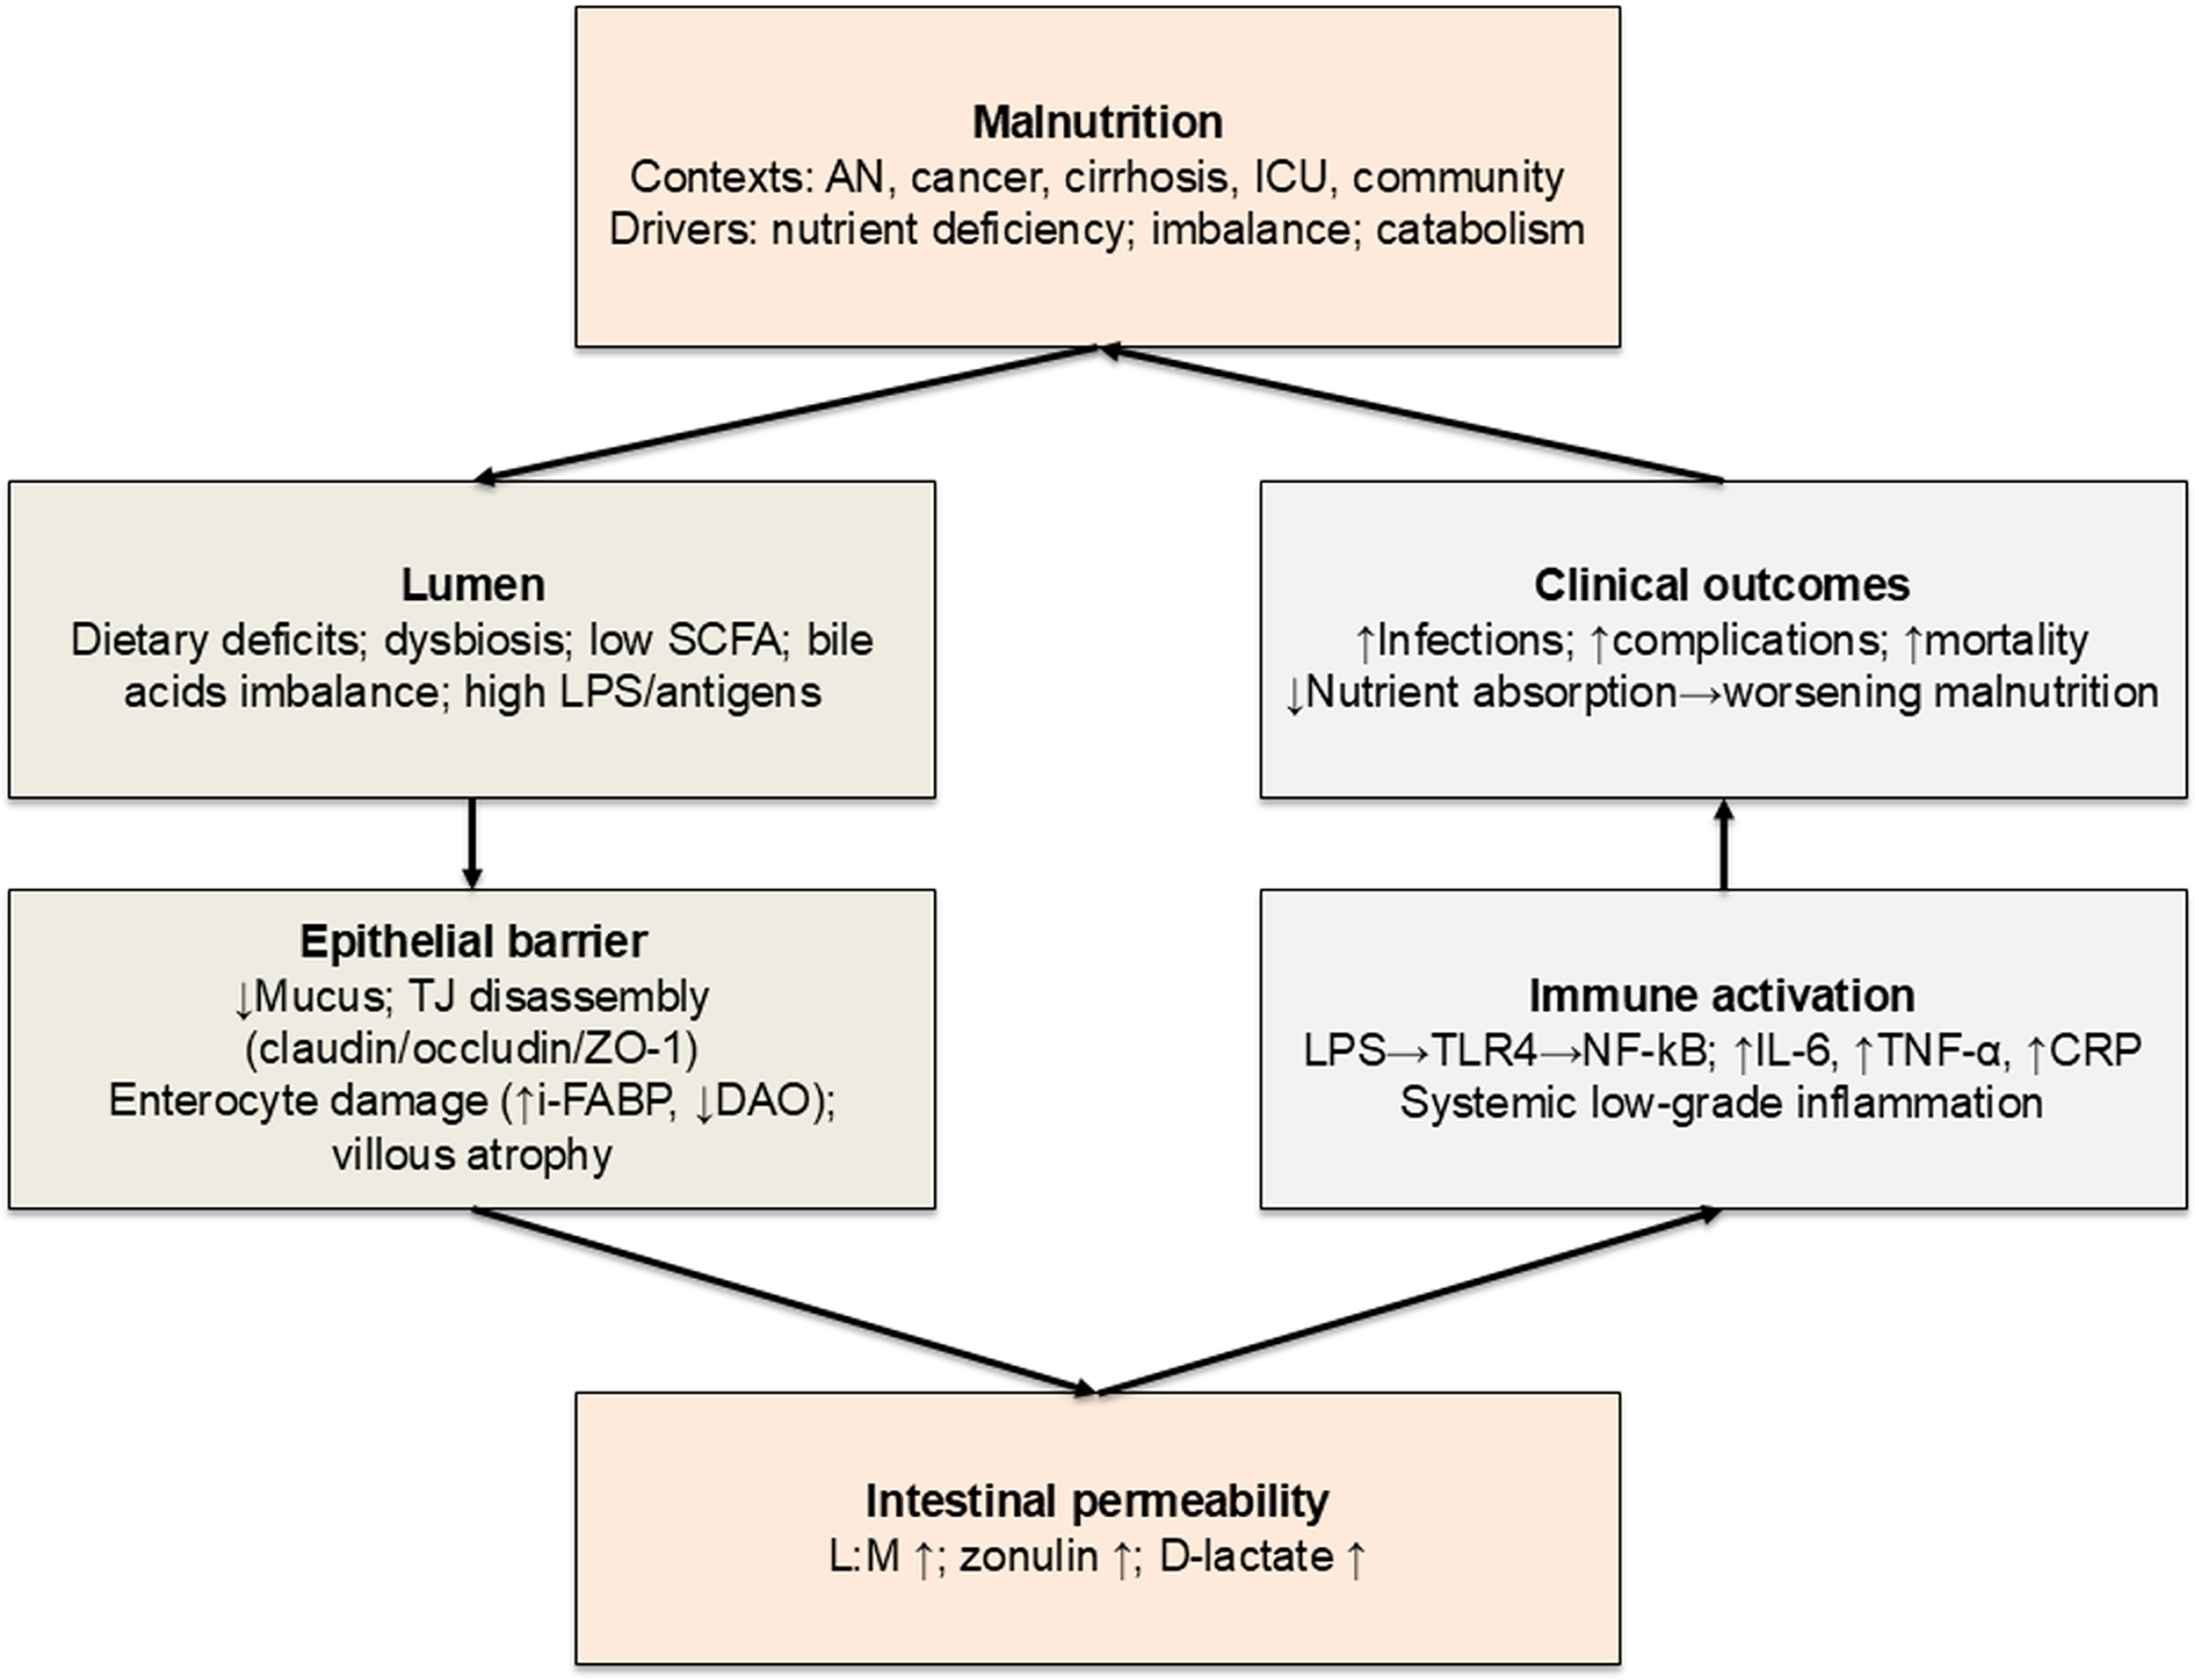
Diet may influence IP through direct mechanisms (regulating TJ protein expression and function) and indirect pathways (modulating gut microbiota composition and metabolic activity)(Reference Del Bo’, Bernardi, Cherubini, Porrini, Gargari and Hidalgo-Liberona16–Reference Bischoff, Barbara, Buurman, Ockhuizen, Schulzke and Serino19). Malnutrition is likely to impair the gut barrier integrity (i.e., greater IP), interfering with nutrient absorption and increasing susceptibility to infections and inflammation(Reference Welsh, Farmery, MacLennan, Sheridan, Barclay and Guillou8,Reference Saracino, Spisni, Imbesi, Ricci, Dussias and Alvisi20) . Mechanisms include diminished mucus production, disrupted TJ protein architecture and functionality, and significant gut microbiota alterations(Reference Alemao, Budden, Gomez, Rehman, Marshall and Shukla21–Reference Inczefi, Bacsur, Resál, Keresztes and Molnár25). Increased IP may also promote systemic inflammatory responses, further worsening nutritional status and overall health status(Reference Al Bander, Nitert, Mousa and Naderpoor26,Reference Patterson, Osorio, Peniche, Dann, Cordova and Preidis27) . An integrated overview of these mechanisms is provided in Fig. 1.

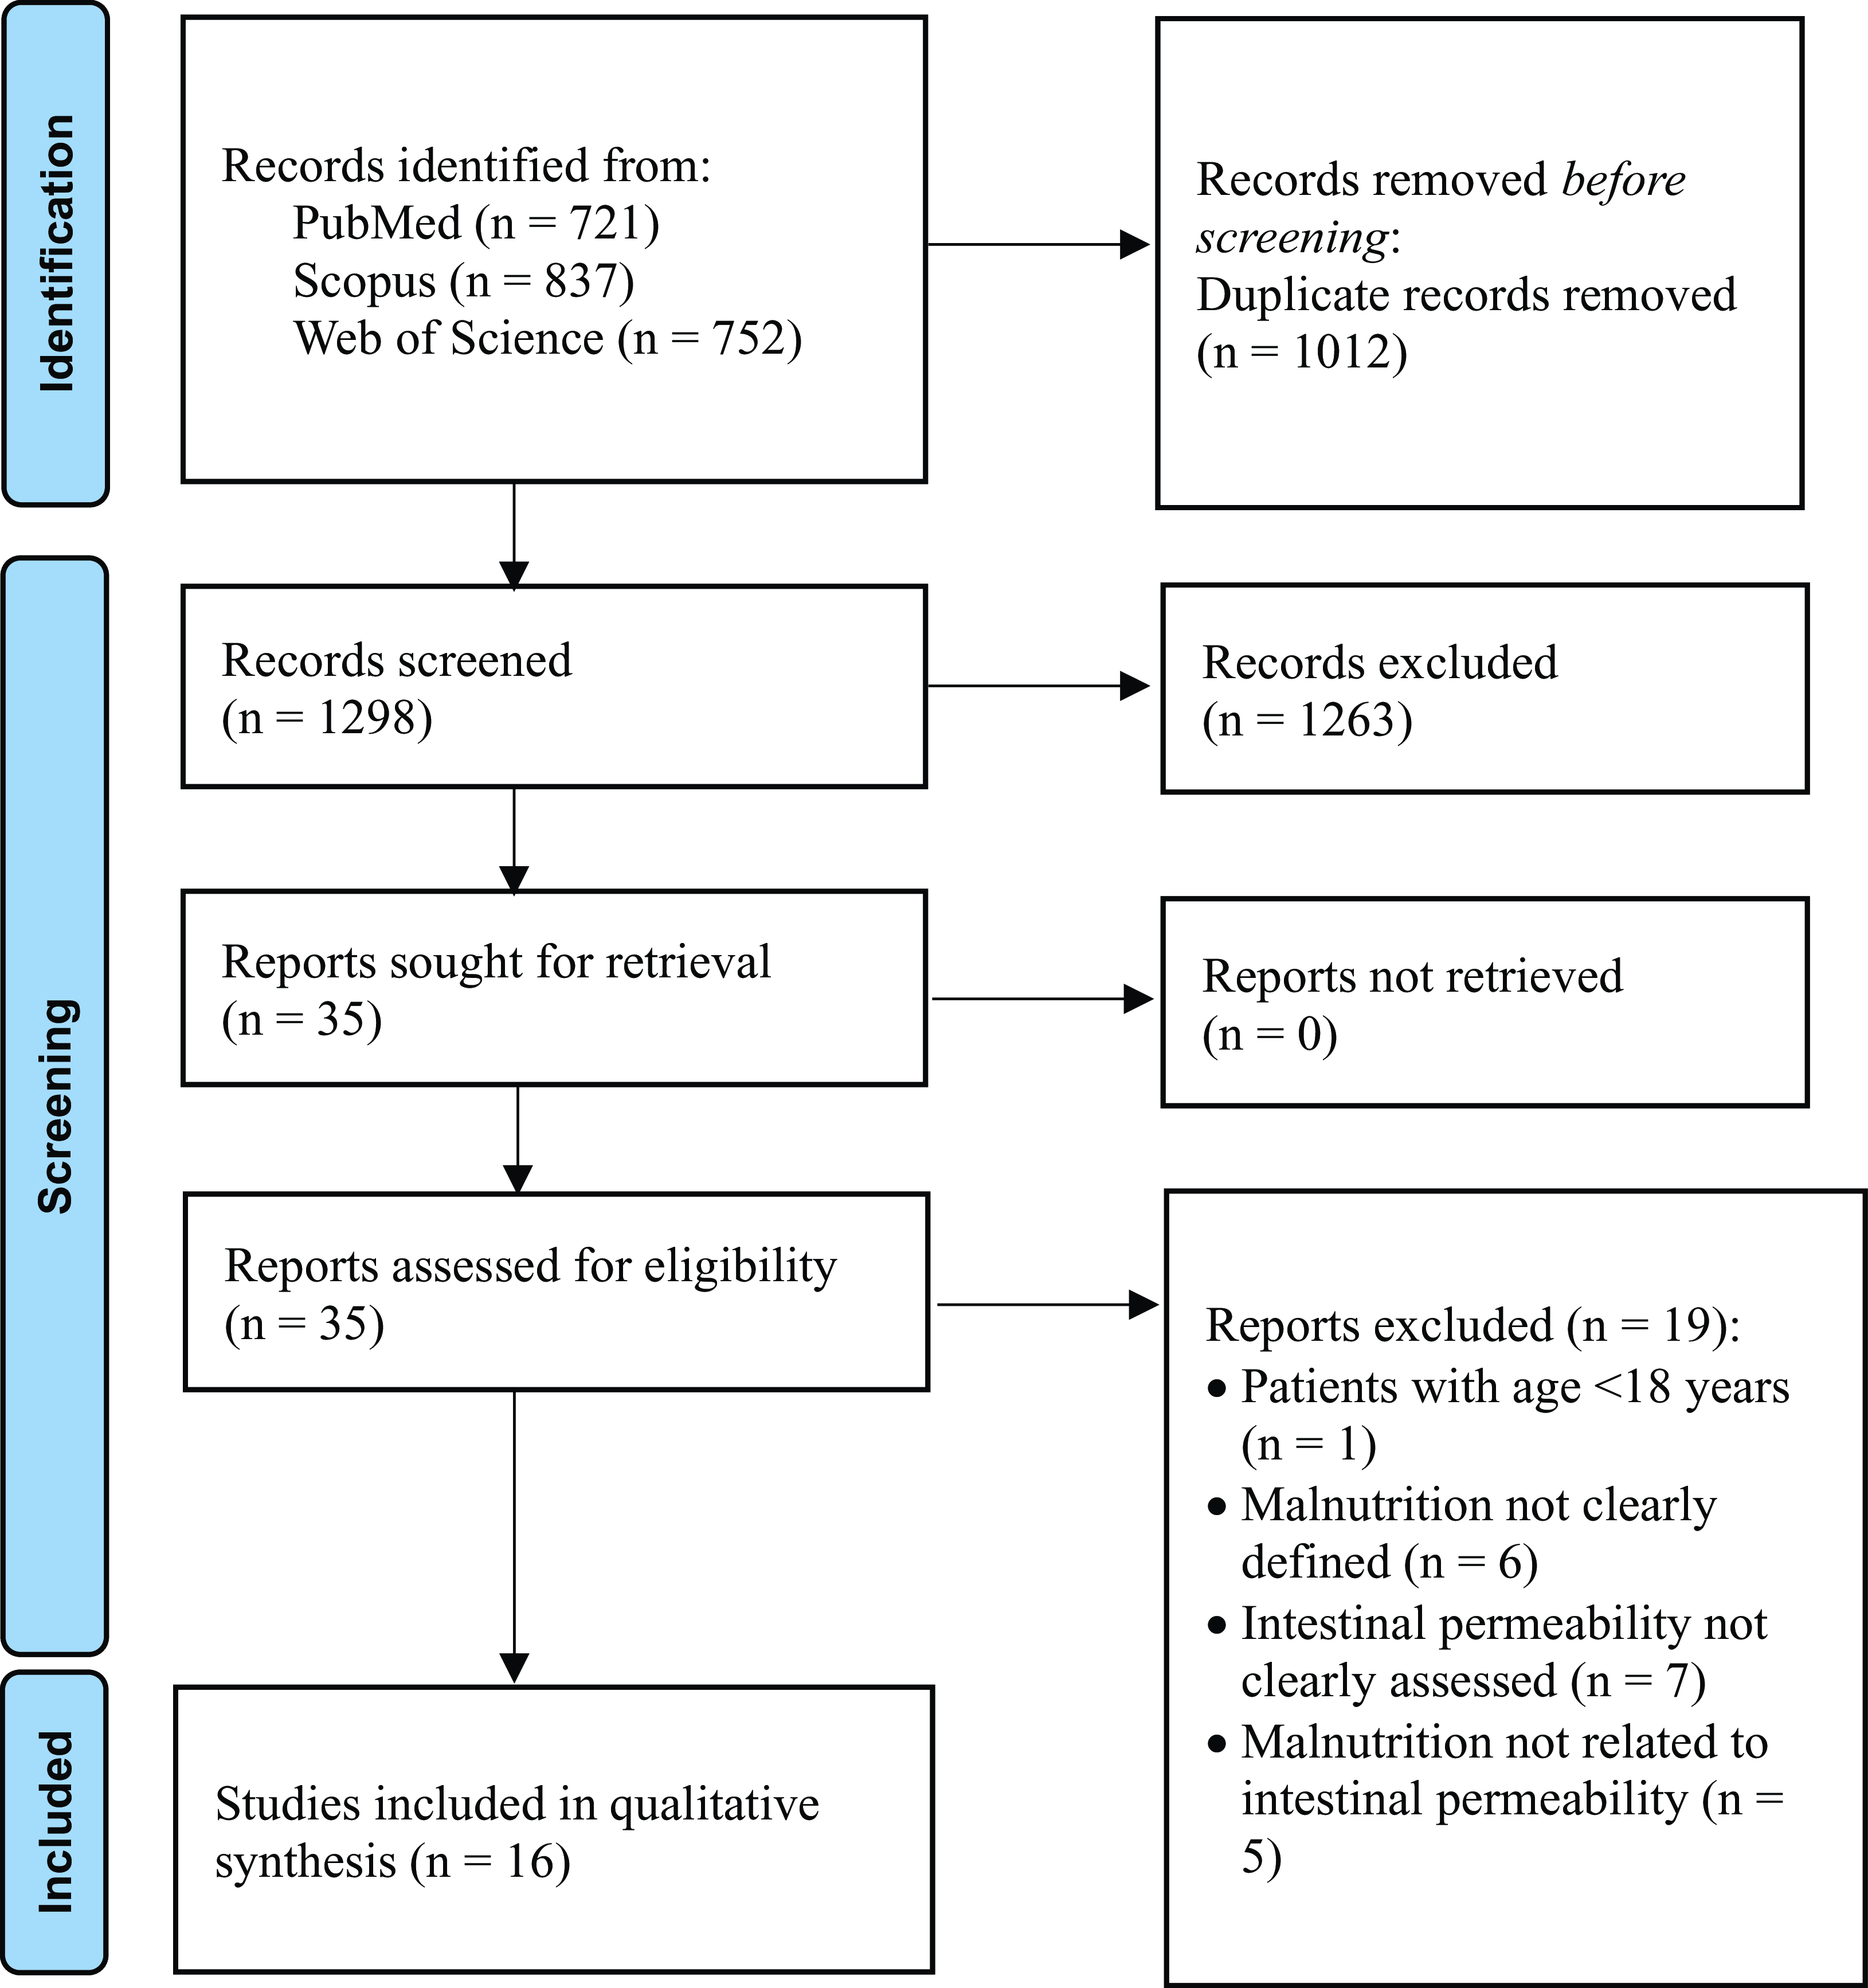
Fig. 1 PRISMA flow diagram on the search and selection of articles included in the systematic review.
Considering the interest in the mutual relationship between nutritional status and gut barrier function, and the lack of a comprehensive evaluation of the available evidence, this systematic review aims to explore the association between nutritional risk or malnutrition and altered IP, highlighting existing research gaps.
Material and methods
Data sources and search strategy
Two authors (O.D.V. and I.C.) independently performed a systematic literature search up to 26 June 2024 on PubMed, Scopus and Web of Science. The following terms were used as search strategy string on full texts in each database: (‘malnutrition’[MeSH Terms] OR ‘malnutrition’[All Fields] OR ‘nutritional risk’[All Fields] OR ‘undernourishment’[All Fields] OR ‘malnourishment’[All Fields] OR ‘undernutrition’[All Fields] OR ‘undernourished’[All Fields] OR ‘poor nutrition’[All Fields] OR ‘Underfeeding’[All Fields] OR ‘risk of malnutrition’[All Fields]) AND (‘intestinal permeability’[All Fields] OR ‘intestinal barrier’[All Fields] OR ‘gut barrier’[All Fields] OR ‘gut mucosa’[All Fields] OR ‘enteric dysfunction’[All Fields] OR ‘dysbiosis’[All Fields] OR ‘leaky gut’[All Fields] OR ‘gut permeability’[All Fields] OR ‘tight junction’[All Fields] OR ‘intestinal mucosal barrier’[All Fields] OR ‘gut mucosal barrier’[All Fields] OR ‘intestinal integrity’[All Fields] OR ‘gut integrity’[All Fields] OR ‘gut junction’[All Fields]).
This study followed the Preferred Reporting Items for Systematic Reviews and Meta-Analyses (PRISMA) guidelines(Reference Page, McKenzie, Bossuyt, Boutron, Hoffmann and Mulrow28). The search was limited to reports written in English without any limitation regarding the year of publication. The study protocol was registered in the international Prospective Register of Systematic Reviews (PROSPERO) (registration no. CRD42023482662).
The PECOS framework(Reference Morgan, Whaley, Thayer and Schünemann29) was used to define the study selection criteria as follows: ‘P’ (patients) corresponded to individuals/patients of any age, gender or ethnicity diagnosed with or at risk of malnutrition (undernutrition) and assessed for intestinal permeability; ‘E’ (exposure) designated diagnosis or risk of malnutrition (undernutrition); ‘C’ (comparison) indicated subjects without malnutrition or not at risk; ‘O’ (outcome) corresponded to increased intestinal permeability/leaky gut; and ‘S’ (study design) selected all study types.
Eligibility criteria were (a) individuals/patients aged ≥18 years at risk of malnutrition or diagnosed with malnutrition as determined by recognised screening or diagnostic criteria, (b) assessment of IP/leaky gut using any recognised markers/methods and (c) full papers published in peer-reviewed journals.
Articles without full-text availability, opinion pieces, conference abstracts, review articles and editorials were excluded.
Study selection and data extraction
Titles and abstracts from the searches were independently screened by two authors (O.D.V. and I.C.). Full texts of selected articles were checked against eligibility criteria by the same two authors, with a third reviewer (M.M.) resolving any disagreements in opinion to make a final decision. An electronic database was designed to store all relevant data. Data were extracted separately by two investigators (O.D.V. and I.C.), with disagreement cross-examined by L.S. The selection process is shown in Fig. 2. The following data were extracted: first author, year of publication, country of origin, type of study, participants, sample size, age, BMI, duration of the study/treatment, tool/method for the assessment of malnutrition and marker/method for the assessment of intestinal permeability.

Fig. 2 Proposed mechanisms linking malnutrition and intestinal permeability. AN, anorexia nervosa; CRP, C-reactive protein; DAO, diamine oxidase; I-FABP, intestinal fatty acid-binding protein; ICU, intensive care unit; IL-6, interleukin-6; IP, intestinal permeability; L:M, lactulose:mannitol; LPS, lipopolysaccharides; MUC2, mucin-2; NF-κB, nuclear factor kappa-B; SCFA, short-chain fatty acids; TJ, tight junctions; TLR4, Toll-like receptor 4; TNF-α, tumour necrosis factor-α; ZO-1, zonula occludens-1.
Study quality assessment
The quality of the sixteen included studies was assessed using the NIH National Heart, Lung, and Blood Institute’s Study Quality Assessment Tool(30). This tool is a set of customised quality appraisal instruments designed to aid reviewers in directing attention towards fundamental concepts crucial to the internal validity of a study. These tools were tailored to specific research designs and evaluated for potential deficiencies in study methodologies or execution. The tool comprises twelve or fourteen items, each with three potential response categories: ‘yes’, ‘no’ or ‘cannot determine/not reported/not applicable’. Studies were stratified into ‘good’ quality if they addressed 70% or more of the stipulated items, ‘fair’ quality if they encompassed between 40% and 70% of the items and ‘poor’ quality if they addressed less than 40% of the required items.
Two independent reviewers (C.D.B. and M.M.) conducted the quality assessments. Consistent with NIH guidelines, studies were evaluated for risk of bias, methodological rigour and reporting transparency. Any discrepancies between the reviewing co-authors were resolved by a third reviewer (P.R.).
Results
Study selection
A total of 2310 articles were identified through the initial literature search. After removing duplicates (n = 1012), 1263 studies were then excluded by screening titles and abstracts for not meeting the inclusion criteria. The full texts of the remaining thirty-five potentially relevant studies were examined. Then, nineteen articles were excluded for reasons such as participants not being adults, malnutrition risk or malnutrition diagnosis not clearly defined, IP not clearly assessed and malnutrition not related to IP. Finally, sixteen studies were included in the present systematic review. The selection process is shown in Fig. 2.
Study characteristics
The main characteristics of the selected studies (n = 16) are summarised in Table 1. The studies (nine case–control, three cross-sectional, two prospective, one clinical trial and one randomised controlled trial) were all single-centre and published from 1996 to 2022. Ten studies were carried out in Europe, five in Asia and one in South America. Overall, data on 1169 subjects were taken into consideration (age range 21–81 years, BMI range 13·5–26·5 kg/m2).
Table 1. Descriptive characteristics of the studies included in the systematic review
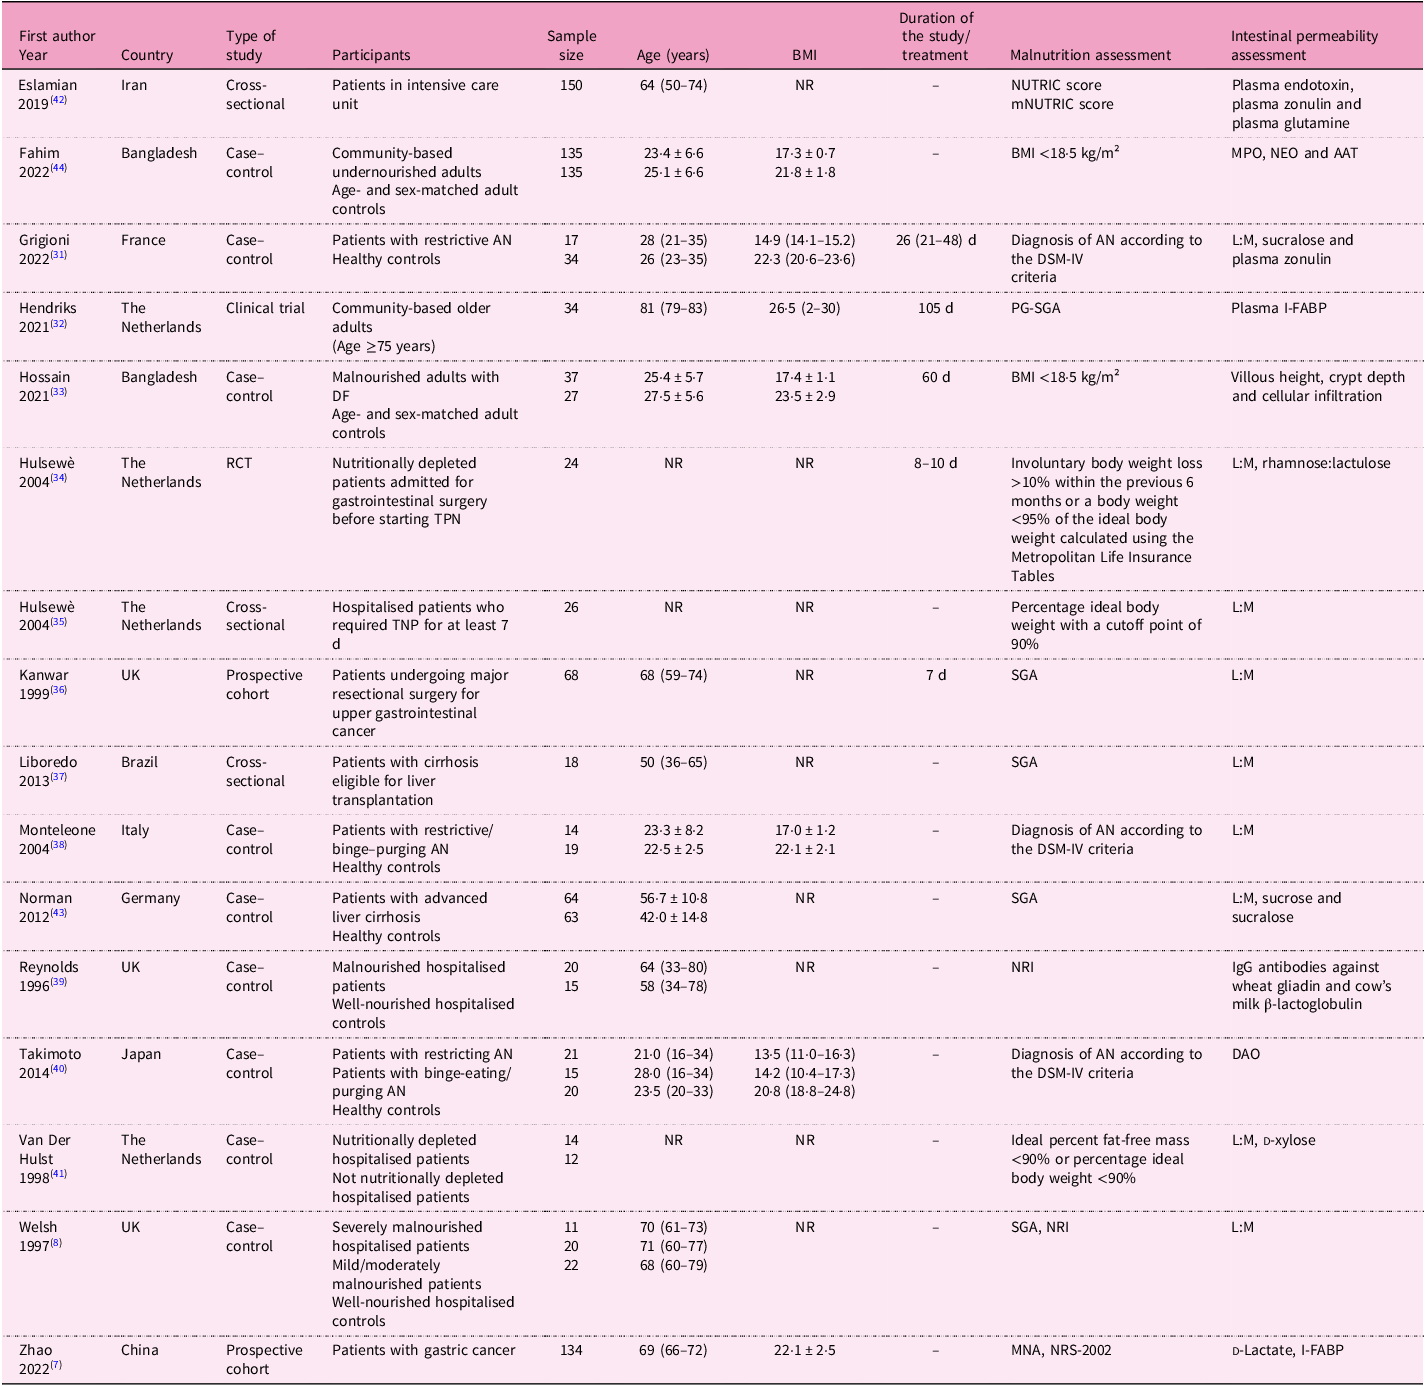
AAT, alpha-1 anti-trypsin; AN, anorexia nervosa; BMI, body mass index; DAO, diamine oxidase; DF, functional dyspepsia; DSM-IV, Diagnostic and Statistical Manual of Mental Disorders; I-FABP, intestinal fatty acid-binding protein; IgG, immunoglobulin G; L:M, lactulose:mannitol; MNA, mini nutritional assessment; mNUTRIC, modified nutrition risk; MPO; faecal myeloperoxidase; NEO, neopterin; NR, not reported; NRI, nutritional risk index; NRS-2002; Nutritional Risk Screening 2002; NUTRIC, nutrition risk; PG-SGA, Patient-Generated Subjective Global Assessment; RCT, randomised controlled trial; SGA, Subjective Global Assessment; TPN, total parenteral nutrition.
Studies included community-based (free-living) individuals (n = 2); hospitalised patients, including one in intensive care unit (ICU) (n = 6); and those with AN (n = 3), with liver cirrhosis (n = 2), with cancer (n = 2) and with functional dyspepsia (n = 1). Nine studies also included control subjects (i.e. well-nourished individuals, overall n = 347, age 22·5–68·0 years, BMI 20·8–23·5 kg/m²). The sample size was below 100 subjects in twelve studies(Reference Welsh, Farmery, MacLennan, Sheridan, Barclay and Guillou8,Reference Grigioni, Achamrah, Chan, Guérin, Bôle-Feysot and Delay31–Reference Van Der Hulst, Von Meyenfeldt, Van Kreel, Thunnissen, Brummer and Arends41) , between 100 and 200 subjects in three studies(Reference Zhao, Wang, Yang, Pan, Liu and Ge7,Reference Eslamian, Ardehali and Vahdat Shariatpanahi42,Reference Norman, Pirlich, Schulzke, Smoliner, Lochs and Valentini43) and above 200 subjects in one study(Reference Fahim, Gazi, Alam, Hasan, Das and Mahfuz44).
Nutritional status was assessed as malnutrition risk or diagnosis of malnutrition (Table 1). Risk of malnutrition was assessed with (1) the Nutrition Risk (NUTRIC) score and the modified Nutrition Risk score (mNUTRIC)(Reference Eslamian, Ardehali and Vahdat Shariatpanahi42), (2) NRI(Reference Welsh, Farmery, MacLennan, Sheridan, Barclay and Guillou8,Reference Reynolds, O’Farrelly, Feighery, Murchan, Leonard and Fulton39) and (3) the Nutritional Risk Screening 2002 (NRS-2002)(Reference Zhao, Wang, Yang, Pan, Liu and Ge7).
Diagnosis of malnutrition was made as follows: (1) BMI <18·5 kg/m²(Reference Hossain, Begum, Rahman, Mazumder, Parvez and Gazi33,Reference Fahim, Gazi, Alam, Hasan, Das and Mahfuz44) ; (2) diagnosis of AN according to the Diagnostic and Statistical Manual of Mental Disorders-IV (DSM-IV) criteria, including significantly low body weight, intense fear of weight gain and body image disturbance(Reference Grigioni, Achamrah, Chan, Guérin, Bôle-Feysot and Delay31,Reference Monteleone, Carratù, Cartenì, Generoso, Lamberti and Magistris38,Reference Takimoto, Yoshiuchi, Shimodaira and Akabayashi40) ; (3) SGA(Reference Welsh, Farmery, MacLennan, Sheridan, Barclay and Guillou8,Reference Kanwar, Windsor, Welsh, Barclay, Guillou and Reynolds36,Reference Liboredo, Vilela, Ferrari, Lima and Correia37,Reference Norman, Pirlich, Schulzke, Smoliner, Lochs and Valentini43) and patient-generated SGA (PG-SGA)(Reference Hendriks, Stokmans, Plas, Buurman, Spoorenberg and Wynia32), classifying patients as A (well-nourished), B (moderately malnourished) or C (severely malnourished), on the basis of medical history and physical examination; and (4) MNA, with scores <17 indicating malnutrition, 17–23·5 indicating risk of malnutrition and ≥24 indicating normal nutritional status, considering anthropometry, general evaluation, dietary assessment and patients’ self-perception of health and nutritional status(Reference Zhao, Wang, Yang, Pan, Liu and Ge7) (Tables 1 and 2).
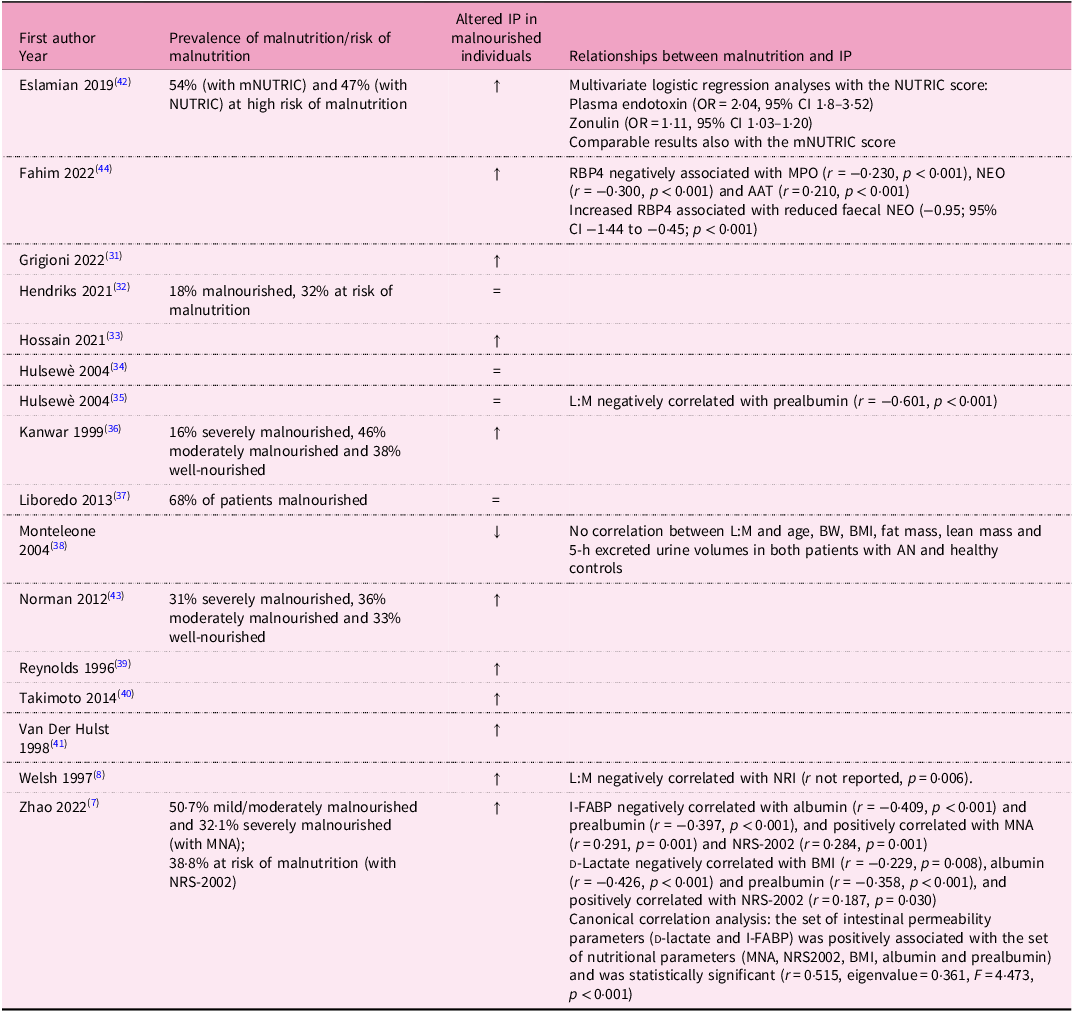
Table 2. Main results of the studies included in the systematic review

↑ Significant increase in intestinal permeability.
AAT, alpha-1 anti-trypsin; AN, anorexia nervosa; BMI, body mass index; BW, body weight; CI, confidence interval; I-FABP, intestinal fatty acid-binding protein; IP, intestinal permeability; L:M, lactulose:mannitol; MNA, mini nutritional assessment; mNUTRIC, nutrition risk; MPO, faecal myeloperoxidase; NEO, neopterin; NRI, Nutritional Risk Index; NRS-2002, Nutritional Risk Screening 2002; NUTRIC, nutrition risk; OR, odds ratio; RBP4, retinol binding protein 4.
In addition, other studies identified the ‘nutritional depletion’ by (1) involuntary body weight loss >10% body weight within the previous 6 months or body weight <95% of the ideal body weight calculated using the Metropolitan Life Insurance Tables(Reference Hulsewe34) (2) percentage ideal body weight with a cutoff point of 90%(Reference Hulsewe35) and (3) ideal percent fat-free mass <90% or percentage ideal body weight <90%(Reference Van Der Hulst, Von Meyenfeldt, Van Kreel, Thunnissen, Brummer and Arends41) (Table 1).
As for IP, it was mostly assessed with the lactulose:mannitol ratio (L:M ratio)(Reference Welsh, Farmery, MacLennan, Sheridan, Barclay and Guillou8,Reference Grigioni, Achamrah, Chan, Guérin, Bôle-Feysot and Delay31,Reference Hulsewe34–Reference Monteleone, Carratù, Cartenì, Generoso, Lamberti and Magistris38,Reference Van Der Hulst, Von Meyenfeldt, Van Kreel, Thunnissen, Brummer and Arends41,Reference Norman, Pirlich, Schulzke, Smoliner, Lochs and Valentini43) , sucralose(Reference Grigioni, Achamrah, Chan, Guérin, Bôle-Feysot and Delay31,Reference Norman, Pirlich, Schulzke, Smoliner, Lochs and Valentini43) , plasma zonulin(Reference Grigioni, Achamrah, Chan, Guérin, Bôle-Feysot and Delay31,Reference Eslamian, Ardehali and Vahdat Shariatpanahi42) , plasma intestinal fatty acid-binding protein (I-FABP)(Reference Zhao, Wang, Yang, Pan, Liu and Ge7,Reference Hendriks, Stokmans, Plas, Buurman, Spoorenberg and Wynia32) and several other markers/methods, as reported in Table 1.
Reporting quality
The quality assessment for each included study is summarised in the Supplementary Material (Table S1). Using a three-category scale, ten studies were categorised as fair and six as poor, while no studies met the criteria for a good rating. Remarkably, there was complete concordance between the evaluations conducted independently by the two assessors. None of the cohort studies provided a sufficient duration to plausibly detect an association between exposure and outcome if present. However, all cohort studies exhibited clearly defined, valid and reliably implemented outcome measures across all participants. Conversely, for case–control studies, it remained indeterminate whether cases and/or controls were randomly selected from eligible candidates. Moreover, no explicit descriptions regarding the validity of case and control definitions or the processes/tools used to identify participants were present in the studies. Nonetheless, the majority of these studies did articulate clear definitions, inclusion/exclusion criteria and processes for identifying/selecting cases and controls, which were implemented consistently and reliably. On the contrary, most studies failed to address key potential confounding variables through statistical adjustment in their analyses. In addition, the majority lacked sample size justifications or descriptions of statistical power considerations.
Intestinal permeability in malnourished community-based (free living) individuals
Two studies(Reference Hendriks, Stokmans, Plas, Buurman, Spoorenberg and Wynia32,Reference Fahim, Gazi, Alam, Hasan, Das and Mahfuz44) assessed IP in malnourished community-based (free-living) individuals (Table 1). In one study(Reference Fahim, Gazi, Alam, Hasan, Das and Mahfuz44), IP was compared between malnourished (mean age 23·4 ± 6·6 years, mean BMI 17·3 ± 0·7 kg/m²) and well-nourished individuals (mean age 25·1 ± 6·6 years, mean BMI 21·8 ± 1·8 kg/m²). They found higher levels of faecal biomarkers of gut health and lower retinol-binding protein 4 concentrations in malnourished individuals compared with healthy controls. In addition, negative correlations were observed between retinol binding protein 4 and the analysed faecal biomarkers of gut health (Table 2).
Another study(Reference Hendriks, Stokmans, Plas, Buurman, Spoorenberg and Wynia32) involved older adults (median age 81 years, BMI 26·5 kg/m²) and assessed intestinal integrity by measuring plasma I-FABP levels at baseline, after a walking test (median distance 660 m in 12 min) and following a mixed meal. The number of malnourished participants did not differ between those with a loss of intestinal integrity (I-FABP increase ≥50%) and those with non-compromised intestinal integrity (I-FABP <50%), as reported in Table 2.
Intestinal permeability in patients with anorexia nervosa
IP was assessed in three studies(Reference Grigioni, Achamrah, Chan, Guérin, Bôle-Feysot and Delay31,Reference Monteleone, Carratù, Cartenì, Generoso, Lamberti and Magistris38,Reference Takimoto, Yoshiuchi, Shimodaira and Akabayashi40) involving patients with different AN types (median age 21–28 years, median BMI 13·5–17 kg/m²) compared with healthy control subjects (median age 22–26 years, median BMI 20·8–22·3 kg/m²) (Table 1).
In one paper(Reference Monteleone, Carratù, Cartenì, Generoso, Lamberti and Magistris38), patients with restrictive (n = 10) and binge-purging type (n = 4) AN exhibited a decreased L:M excretion after 5 h and an altered timing of lactulose excretion compared with controls. However, no significant correlations were found between IP and age, body weight, BMI, fat mass, lean mass and 5-h excreted urine volumes in both patients and controls (Table 2).
However, opposing results were recently reported(Reference Grigioni, Achamrah, Chan, Guérin, Bôle-Feysot and Delay31), with greater urinary L:M ratios (0–5 h and 5–24 h samples) in patients with restrictive AN compared with controls, but no differences in plasma zonulin and urinary excretion of sucralose were found. Furthermore, after a short-term refeeding recovery of 26 d (interquartile range (IQR) 21–48 d), no variations for gut barrier markers were observed in the seven (out of seventeen) patients examined.
Lastly, in another study(Reference Takimoto, Yoshiuchi, Shimodaira and Akabayashi40), IP was assessed by diamine oxidase (DAO) plasma levels, which were significantly lower in inpatients with restricting AN than in both those with binge-eating/purging disorder and healthy controls.
Intestinal permeability in malnourished/nutritionally depleted hospitalised patients
Six studies(Reference Welsh, Farmery, MacLennan, Sheridan, Barclay and Guillou8,Reference Hulsewe34,Reference Hulsewe35,Reference Reynolds, O’Farrelly, Feighery, Murchan, Leonard and Fulton39,Reference Van Der Hulst, Von Meyenfeldt, Van Kreel, Thunnissen, Brummer and Arends41,Reference Eslamian, Ardehali and Vahdat Shariatpanahi42) evaluated IP in hospitalised patients with different conditions (median age 64–70 years, BMI not reported), including patients in the ICU(Reference Eslamian, Ardehali and Vahdat Shariatpanahi42) (Table 1). Two of them(Reference Reynolds, O’Farrelly, Feighery, Murchan, Leonard and Fulton39,Reference Van Der Hulst, Von Meyenfeldt, Van Kreel, Thunnissen, Brummer and Arends41) compared malnourished/nutritionally depleted to well-nourished/not nutritionally depleted patients, and one(Reference Welsh, Farmery, MacLennan, Sheridan, Barclay and Guillou8) mild/moderately malnourished patient was also identified.
A significantly increased L:M ratio(Reference Welsh, Farmery, MacLennan, Sheridan, Barclay and Guillou8) was found in both mild/moderately malnourished and severely malnourished patients (assessed by SGA) compared with controls (Table 2).
Similarly(Reference Van Der Hulst, Von Meyenfeldt, Van Kreel, Thunnissen, Brummer and Arends41), nutritionally depleted patients (Table 1) exhibited a greater L:M than those who were not nutritionally depleted (p < 0.05). However, the amount of lactulose, mannitol and xylose excreted was similar between the two groups.
In another study(Reference Reynolds, O’Farrelly, Feighery, Murchan, Leonard and Fulton39), IP was assessed through serum IgG antibodies to gliadin and to β-lactoglobulin. Gliadin antibodies were detected in 50% of patients at risk of malnutrition, β-lactoglobulin antibodies in 75%, and both in 50%, whereas all controls tested negative. Patients with severe malnutrition risk were more likely to present both antibodies than those with mild or moderate risk. Interestingly, antibody-positive patients exhibited a better nutritional status, as indicated by higher NRI scores and serum albumin levels, compared with antibody-negative individuals. In contrast, nutritional depletion, assessed by serum albumin levels, weight loss or fat-free mass index (Table 1), was not found to be associated with altered L:M ratios in hospitalised patients prior to administration of total parenteral nutrition (TPN)(Reference Hulsewe35) (Table 2). In addition, neither L:M ratio nor rhamnose:lactulose ratio changed in nutritionally depleted patients treated with two different TPN solutions (with and without glycyl-glutamine) for 8–10 d(Reference Hulsewe34); also, no changes were detected for villus height, crypt depth and mucosal thickness.
Finally, a study(Reference Eslamian, Ardehali and Vahdat Shariatpanahi42) assessed IP in ICU patients (Table 1). Among participants, 33% were glutamine deficient (age 60 (IQR 50–74) years, BMI not reported) and 67% had normal glutamine levels (age 66 (IQR 53–73) years, BMI not reported). The prevalence of high malnutrition risk was similar in the two subgroups; however, compared with patients with normal glutamine levels, the glutamine-deficient ones had lower serum albumin. Furthermore, median values of plasma zonulin and plasma endotoxin increased with increasing malnutrition risk in the overall study population as well as in the glutamine-deficient subgroup. In addition, plasma endotoxin and zonulin were identified as logistic regression predictors of high nutritional risk in the overall population and in the glutamine-deficient subgroup (Table 2).
Intestinal permeability in malnourished/at risk of malnutrition patients with other diseases
One study(Reference Hossain, Begum, Rahman, Mazumder, Parvez and Gazi33) explored the histological features of the intestinal mucosa in a group of outpatients suffering from functional dyspepsia, observing significant differences between malnourished individuals and age- and sex-matched adult controls in terms of villous height, crypt depth and inflammatory infiltration. Specifically, 24% of the malnourished participants had subtotal villous atrophy, 68% had crypt hyperplasia and 29% had marked cellular infiltration in the lamina propria.
Two studies(Reference Zhao, Wang, Yang, Pan, Liu and Ge7,Reference Kanwar, Windsor, Welsh, Barclay, Guillou and Reynolds36) assessed IP in patients with cancer (Table 1). In patients undergoing major resectional surgery for upper gastrointestinal cancer(Reference Kanwar, Windsor, Welsh, Barclay, Guillou and Reynolds36), no significant differences were observed in the preoperative IP according to their nutritional status (Table 2), as well as during the study period (7 d). After 7 d from surgery, the L:M ratio was significantly increased in the severely malnourished group compared with the others (Table 2).
Similarly, in elderly patients before gastrectomy for gastric cancer(Reference Zhao, Wang, Yang, Pan, Liu and Ge7), I-FABP levels increased progressively from well-nourished to mildly/moderately malnourished and severely malnourished participants. In addition, preoperative IP markers were also significantly correlated with some nutritional indicators, as detailed in Table 2.
Lastly, two studies(Reference Liboredo, Vilela, Ferrari, Lima and Correia37,Reference Norman, Pirlich, Schulzke, Smoliner, Lochs and Valentini43) assessed IP by L:M ratio and malnutrition by SGA in patients with liver cirrhosis (median age 50–57 years, BMI not reported), as presented in Table 1. One study(Reference Kanwar, Windsor, Welsh, Barclay, Guillou and Reynolds36) found no significant differences in IP between malnourished and well-nourished patients (Table 2). Conversely, Norman et al. (Reference Norman, Pirlich, Schulzke, Smoliner, Lochs and Valentini43) reported an increased L:M ratio in all patients, with even higher levels observed in malnourished individuals compared with well-nourished ones. In addition, sucrose and sucralose levels were greater in patients compared with controls, but similar between malnourished patients and those who were well-nourished (Table 2).
Discussion
This systematic review examined the relationship between nutritional status and IP across diverse populations and clinical settings. Overall, individuals with severe malnutrition exhibited increased IP, regardless of the underlying condition (e.g. AN, cancer or liver cirrhosis) or setting (hospital or community-based). These findings highlight the need for a comprehensive approach to the early prevention and management of malnutrition, addressing not only its direct consequences but also its associated complications, such as increased IP, which may negatively impact clinical outcomes and quality of life.
Malnutrition is common in patients affected by numerous diseases and older adults(Reference Dent, Wright, Woo and Hoogendijk45). Its prevalence in hospitalised patients varied from 20% to 50%, reaching 78% in critically ill individuals(Reference Eslamian, Ardehali and Vahdat Shariatpanahi42), mostly depending on the diagnostic criteria and screening tools used(Reference Bellanti, lo Buglio, Quiete and Vendemiale46,Reference Di Vincenzo, Pagano, Cervone, Natale, Morena and Esposito47) . The intestinal barrier plays a crucial role in maintaining homeostasis, acting as a selective interface between the external and internal environments(Reference Covello, Becherucci, Di Vincenzo, Del Gaudio, Pizzoferrato and Cammarota48). Comprising epithelial and immune components, this barrier regulates nutrient absorption and protects against damaging agents. Malnutrition, characterised by prolonged energy and nutrient deficiencies, malabsorption and chronic inflammation, can impair the integrity and functionality of the gut barrier by reducing TJ proteins such as claudins and occludins(Reference Suzuki22). These disruptions facilitate the translocation of antigens and endotoxins into circulation, activating Toll-like receptor 4 on immune cells and triggering inflammatory responses(Reference Suzuki22). The association between malnutrition, or its risk, and increased IP is therefore not unexpected(Reference Welsh, Farmery, MacLennan, Sheridan, Barclay and Guillou8,Reference Saracino, Spisni, Imbesi, Ricci, Dussias and Alvisi20) ; however, there is still much debate around whether an independent association exists.
In the studies retrieved for the present systematic review, several methods were adopted to screen or diagnose malnutrition, considering different parameters such as BMI, body weight loss, food intake or inflammation, making it difficult to retrieve comparable results among the current studies. Likewise, IP was measured using different methodologies and biomarkers, including direct and indirect approaches, further complicating study comparisons and limiting the establishment of standardised clinical thresholds.
Despite these issues, most studies(Reference Zhao, Wang, Yang, Pan, Liu and Ge7,Reference Welsh, Farmery, MacLennan, Sheridan, Barclay and Guillou8,Reference Grigioni, Achamrah, Chan, Guérin, Bôle-Feysot and Delay31,Reference Hossain, Begum, Rahman, Mazumder, Parvez and Gazi33,Reference Kanwar, Windsor, Welsh, Barclay, Guillou and Reynolds36,Reference Reynolds, O’Farrelly, Feighery, Murchan, Leonard and Fulton39,Reference Van Der Hulst, Von Meyenfeldt, Van Kreel, Thunnissen, Brummer and Arends41,Reference Norman, Pirlich, Schulzke, Smoliner, Lochs and Valentini43,Reference Fahim, Gazi, Alam, Hasan, Das and Mahfuz44) reported higher IP in malnourished or nutritionally depleted patients than in well-nourished controls, supporting the role of malnutrition in gut barrier dysfunctions and plausibly vice versa. However, the specific mechanisms linking malnutrition and IP likely vary by the specific conditions and remain to be fully delineated.
Findings in community-dwelling malnourished individuals were contrasting. Some studies reported compromised IP, as indicated by alterations in faecal biomarkers of gut health(Reference Fahim, Gazi, Alam, Hasan, Das and Mahfuz44) and changes in villous height, crypt depth and inflammatory infiltration(Reference Hossain, Begum, Rahman, Mazumder, Parvez and Gazi33) compared with well-nourished individuals. Malnutrition may lead to histological modifications in the intestinal mucosa, such as crypt hyperplasia, villous atrophy and increased inflammatory cell infiltration. When the gut barrier is impaired, bacterial components such as LPS can enter the systemic circulation, triggering inflammatory pathways and contributing to chronic low-grade inflammation(Reference Ghosh, Wang, Yannie and Ghosh49). However, another study(Reference Hendriks, Stokmans, Plas, Buurman, Spoorenberg and Wynia32) found no significant differences in IP between groups with different nutritional statuses when assessed using plasma I-FABP levels. This discrepancy may be due to differences in assessment methods, malnutrition severity and the age of participants. Notably, severely malnourished older patients with gastric cancer had higher I-FABP levels than well-nourished individuals(Reference Zhao, Wang, Yang, Pan, Liu and Ge7). I-FABP, a cytosolic protein expressed specifically in enterocytes and rapidly released following enterocyte injury, is a sensitive marker for gut barrier integrity(Reference March, Marchbank, Playford, Jones, Thatcher and Davison50). In addition, d-lactate levels were reported as an independent risk factor for postoperative complications, though they had no predictive value for septic outcomes(Reference Kanwar, Windsor, Welsh, Barclay, Guillou and Reynolds36). These findings suggest preoperative gut barrier dysfunction, combined with malnutrition, may negatively affect recovery in older surgical patients(Reference Covello, Becherucci, Di Vincenzo, Del Gaudio, Pizzoferrato and Cammarota48).
The relationship between AN and IP remains controversial. One study(Reference Grigioni, Achamrah, Chan, Guérin, Bôle-Feysot and Delay31) reported an increased urinary L:M ratio in patients compared with controls, with no significant differences in plasma zonulin levels. In contrast, Monteleone and colleagues(Reference Monteleone, Carratù, Cartenì, Generoso, Lamberti and Magistris38) found a decreased L:M ratio in a similar population. These discrepancies might be attributed to differences in BMI and AN subtypes (restrictive v. binge/purging).
The L:M test evaluates IP by measuring the absorption of two non-metabolizable sugar molecules(Reference Musa, Kabir, Hossain, Ahmed, Siddique and Rashid51). Mannitol, a small monosaccharide, reflects transcellular absorption owing to its ability to easily pass through intact epithelial cells, while lactulose, a larger disaccharide, serves as a marker for paracellular transport, as it is absorbed only minimally through tight junctions(Reference Musa, Kabir, Hossain, Ahmed, Siddique and Rashid51). An increased L:M ratio indicates compromised intestinal barrier integrity, reflecting dysfunction in mucosal permeability(Reference Musa, Kabir, Hossain, Ahmed, Siddique and Rashid51). Another IP marker widely used within dietary intervention and clinical trials is zonulin. Zonulin includes a family of structurally and functionally related proteins able to control IP by decreasing the stability of TJ(Reference Fasano, Not, Wang, Uzzau, Berti and Tommasini52). The applicability of zonulin (serum or faecal) in the context of IP is largely debated from both methodological and clinical sides, and the results have been inconsistent across different populations and conditions(Reference Sturgeon and Fasano53). A fairly recent study reported that faecal zonulin may be a biomarker of IP for overweight and obese adults in particular(Reference Seethaler, Basrai, Neyrinck, Nazare, Walter and Delzenne13).
Takimoto et al. (Reference Takimoto, Yoshiuchi, Shimodaira and Akabayashi40) found that restrictive AN patients had lower DAO levels, a proxy marker of mucosa integrity, compared with patients with binge–purging disorder and controls, suggesting a link between nutrient intake and gut health. Prolonged energy deprivation in restrictive AN(Reference Chiurazzi, Cioffi, De Caprio, De Filippo, Marra and Sammarco54) may lead to mucosal atrophy, impairing gut function. Interestingly, patients with binge–purging AN preserved the integrity of the small-intestinal villi and mucosa, possibly owing to continued use of the gastrointestinal tract. Notably, even after weight gain following targeted nutritional rehabilitation, no significant improvements in gut permeability markers were reported(Reference Grigioni, Achamrah, Chan, Guérin, Bôle-Feysot and Delay31). Therefore, the potential for re-feeding to reverse gut function after malnutrition-induced damage remains uncertain.
In hospitalised patients, increased L:M ratios indicated compromised intestinal barriers in malnourished individuals compared with controls(Reference Welsh, Farmery, MacLennan, Sheridan, Barclay and Guillou8,Reference Van Der Hulst, Von Meyenfeldt, Van Kreel, Thunnissen, Brummer and Arends41) . However, the same marker did not change after TPN treatment(Reference Hulsewe34). Among patients in ICU, higher endotoxin and zonulin plasma levels were associated with a progressively higher risk of nutrition-related complications, particularly in glutamine-deficient individuals(Reference Eslamian, Ardehali and Vahdat Shariatpanahi42). Glutamine is essential for intestinal barrier maintenance, as its depletion reduces the expression of TJ proteins (such as claudin-1 and occludin), and disrupts their localisation, thereby impairing IP.(Reference Li, Lewis, Samuelson, Liboni and Neu55) However, Hulsewe et al. (Reference Hulsewe34) found no significant changes in IP in nutritionally depleted patients with gastrointestinal carcinoma; glutamine supplementation also did not affect permeability. Interestingly, plasma glutamine levels correlated with markers of systemic inflammation and nutritional status, such as erythrocyte sedimentation rate and albumin(Reference Hulsewe35,Reference Kim and Kim56) .
Not surprisingly, malnourished individuals with increased IP often exhibit elevated systemic inflammatory markers, such as C-reactive protein (CRP), interleukin-6 (IL-6) and tumour necrosis factor-alpha (TNF-α)(Reference Hulsewe35,Reference Eslamian, Ardehali and Vahdat Shariatpanahi42) . These markers are generally associated with disease severity, prolonged hospitalisation, increased risk of infections and higher mortality rates in chronic conditions(Reference Cioffi, Scialò, Di Vincenzo, Gelzo, Marra and Testa6,Reference Cioffi, Di Vincenzo, Imperatore, Fisco, Testa and Scialò57) .
Strengths and limitations
This review summarised current evidence on the association between malnutrition and increased IP. Nevertheless, several gaps in literature remain. First, the substantial heterogeneity in the method used to diagnose malnutrition and malnutrition risk, as well as in the criteria applied to assess IP, precluded a quantitative synthesis. Instead, a qualitative analysis was performed to summarise the findings while reflecting the distinct methodologies and outcomes of each study. Yet, this variability in assessment approaches for both malnutrition and IP complicates comparisons and limits conclusions about the strength of their relationship. Second, establishing standardised methodologies would improve comparability across studies and support the development of clinical guidelines for managing IP in patients at nutritional risk or with malnutrition.
Conclusions
This systematic review provides valuable insights into the relationship between malnutrition and impaired IP. While the current evidence supports this association, the heterogeneity of study populations and methodologies underscores the need for standardised research approaches. Future studies should integrate comprehensive biomarker panels, incorporating analyses of microbiota composition, to better understand the underlying mechanisms. Adopting this integrated approach could facilitate the development of targeted interventions aimed at preventing malnutrition and effectively managing its complications.
Supplementary material
The supplementary material for this paper can be found at https://doi.org/10.1017/S0954422425100255
Data availability statement
All data analysed in this study are included in this manuscript. Further inquiries can be directed to the corresponding author.
Acknowledgments
O.D.V., I.C., M.M., P.R. and C.D.B. acknowledge the OnFoods project funded under the National Recovery and Resilience Plan (NRRP), Mission 4 Component 2 Investment 1.3 – Call for proposals no. 341 of 15 March 2022 of the Italian Ministry of University and Research funded by the European Union – NextGenerationEU (award no. project code PE00000003, Concession Decree no. 1550 of 11 October 2022 adopted by the Italian Ministry of University and Research, CUP D93C22000890001, Project title ‘ON Foods - Research and innovation network on food and nutrition sustainability, safety and security – working ON Foods’.
Authorship
O.D.V., L.S. and C.D.B. designed the review. O.D.V., I.C. and M.M. performed the literature search. O.D.V., I.C., M.M. and C.D.B. undertook the study selection and the data extraction. C.D.B. and M.M. performed the quality assessment. L.S. and P.R. served as third independent reviewers. O.D.V., I.C., C.D.B. and M.M. wrote the first draft of the manuscript. O.D.V. and I.C. revised the manuscript. L.S. and P.R. supervised and critically revised the manuscript. All authors have read and approved the final manuscript.
Financial support
This research did not receive any specific grant from funding agencies in the public, commercial or not-for-profit sectors.
Competing interests
The authors have no competing interest to declare.
Ethical standards
No ethical approval was required as the systematic review was conducted from already published data.


 Open access