


1. Introduction
Depression is one of the most common co-occurring psychiatric conditions in autism (Lever & Geurts, Reference Lever and Geurts2016; Lugo-Marín et al., Reference Lugo-Marín, Magán-Maganto, Rivero-Santana, Cuellar-Pompa, Alviani, Jenaro-Rio, Díez and Canal-Bedia2019), occurring at significantly elevated rates, estimated to be ∼23–65% depending on the study sample (Hollocks et al., Reference Hollocks, Lerh, Magiati, Meiser-Stedman and Brugha2019; Jadav & Bal, Reference Jadav and Bal2022; Micai et al., Reference Micai, Fatta, Gila, Caruso, Salvitti, Fulceri, Ciaramella, D’Amico, Del Giovane, Bertelli, Romano, Schünemann and Scattoni2023; Zheng et al., Reference Zheng, Adams, Taylor, Pezzimenti and Bishop2021), compared to general population estimates (Hedley et al., Reference Hedley, Uljarević, Wilmot, Richdale and Dissanayake2017; Hollocks et al., Reference Hollocks, Lerh, Magiati, Meiser-Stedman and Brugha2019; Hudson et al., Reference Hudson, Hall and Harkness2019; Lugo-Marín et al., Reference Lugo-Marín, Magán-Maganto, Rivero-Santana, Cuellar-Pompa, Alviani, Jenaro-Rio, Díez and Canal-Bedia2019). For instance, estimates from a systematic review and meta-analysis by Hollocks and colleagues (Reference Hollocks, Lerh, Magiati, Meiser-Stedman and Brugha2019) examined prevalence of current co-occurring and lifetime prevalence of depression, where depression was operationalized as either a clinical diagnosis or clinically-elevated symptoms (based on established cutoffs of validated measures). Results indicated a 23% prevalence rate of current co-occurring depression diagnosis or clinically-elevated depressive symptoms among autistic adults, and a lifetime prevalence of depression of 37%, which Hollocks et al. (Reference Hollocks, Lerh, Magiati, Meiser-Stedman and Brugha2019) indicate is substantially higher than general population estimates, which range from 1 to 12% (Hollocks et al., Reference Hollocks, Lerh, Magiati, Meiser-Stedman and Brugha2019; Kessler et al., Reference Kessler, Berglund, Demler, Jin, Koretz, Merikangas, Rush, Walters and Wang2003, Reference Kessler, Petukhova, Sampson, Zaslavsky and Wittchen2012). These elevated rates of depression are in turn associated with enhanced vulnerability to suicidality in autistic people (Cassidy et al., Reference Cassidy, Bradley, Robinson, Allison, McHugh and Baron-Cohen2014; Hedley et al., Reference Hedley, Uljarević, Wilmot, Richdale and Dissanayake2018). Reasons for increased rates of this disabling mental health condition in autism are unclear. To inform interventions that will reduce the burden of depression in autistic people, there is a critical need to identify factors central to this elevated risk (Gotham et al., Reference Gotham, Cassidy and Weiss2020).
In the general population, depression is a leading cause of disability worldwide and is associated not only with death by suicide but with mortality risk more broadly, including deaths related to cardiovascular disease and cancer (World Health Organization, 2021). Thus, understanding factors related to the development, maintenance, and recurrence of depression is an urgent need in public health research (World Health Organization, 2021). A central feature of major depressive disorder is the presence of sustained disordered affect (American Psychiatric Association, 2013), including negative affect, which is featured in theoretical conceptualizations of depression (Joormann & Siemer, Reference Joormann, Siemer and Gross2013). Factors related to negative affect and the regulation of negative affect are important to identify in order to understand depression and to improve outcomes in this disabling condition. Thus, understanding emotion regulation, or how individuals regulate their emotional states, including negative emotional states, has been identified as an important factor in understanding vulnerability to depression (Joormann & Siemer, Reference Joormann, Siemer and Gross2013). Emotion regulation (ER), a component of executive functioning, refers to the contextually-appropriate direction and modulation of emotional responsivity to facilitate goal pursuit and achievement (J. J. Gross & Thompson, Reference Gross, Thompson and Gross2007). ER challenges are implicated in depression and vulnerability for depression in the general population (Berking et al., Reference Berking, Wirtz, Svaldi and Hofmann2014; Hofmann et al., Reference Hofmann, Sawyer, Fang and Asnaani2012; Joormann & Stanton, Reference Joormann and Stanton2016; Joormann & Tanovic, Reference Joormann and Tanovic2015). For example, in the general population depression is associated with less implementation of ER strategies such as cognitive reappraisal, which includes reframing how one interprets a situation, and more implementation of strategies such as emotion suppression (Joormann & Gotlib, Reference Joormann and Gotlib2010), which includes the avoidance of outwardly expressing one’s negative emotions (Joormann & Gotlib, Reference Joormann and Gotlib2010). For reviews on emotion regulation and its associations with depression see Joormann and Siemer (Reference Joormann, Siemer and Gross2013) and Joorman and Stanton (Reference Joormann and Stanton2016).
The interplay of ER and depressive symptoms undergirds theoretical conceptualizations of depression (Joormann & Stanton, Reference Joormann and Stanton2016) and is supported by empirical work, which includes investigations of ER strategy use in persons with major depressive disorder, as well as brain-based and intervention-based studies. Studies of ER strategy use indicate that major depressive disorder is associated with less use of adaptive ER strategies and more use of maladaptive ER strategies (Joormann & Siemer, Reference Joormann, Siemer and Gross2013). As evidenced in studies examining brain structure and function, brain regions and systems that are implicated in ER processes differ between depressed and non-depressed individuals (Park et al., Reference Park, Rosenblat, Lee, Pan, Cao, Iacobucci and McIntyre2019). Evidence-based psychotherapeutic approaches such as the unified protocol for transdiagnostic treatment of emotional disorders (Barlow et al., Reference Barlow, Farchione, Fairholme, Ellard, Boisseau, Allen and Ehrenreich May2010), which directly targets emotion regulation (Lincoln et al., Reference Lincoln, Schulze and Renneberg2022), contributes to increased use of adaptive ER strategies and decreased use of maladaptive ER strategies, as well as improvement in internalizing symptomatology, including depressive symptoms (Sakiris & Berle, Reference Sakiris and Berle2019), consistent with the argument that psychotherapeutic interventions that directly target ER (or indirectly provide support in the development of ER strategies or the implementation of such strategies) positively impact ER and contribute to depression symptom improvements (Gratz et al., Reference Gratz, Weiss and Tull2015).
Given the broader literature demonstrating associations of ER strategy use and challenges in implementing ER strategies in the development, maintenance, and recurrence of depression, one key factor in elevated rates of depression among autistic people may be ER and ER challenges. ER challenges are prominent in autism (Conner et al., Reference Conner, Golt, Shaffer, Righi, Siegel and Mazefsky2021; Mazefsky et al., Reference Mazefsky, Borue, Day and Minshew2014; Mazefsky & White, Reference Mazefsky and White2014; Samson et al., Reference Samson, Phillips, Parker, Shah, Gross and Hardan2014) and are more common in autistic relative to neurotypical populations (Conner et al., Reference Conner, Golt, Shaffer, Righi, Siegel and Mazefsky2021). Further, ER challenges in autistic people appear to be related to core autistic traits, including uncertainty intolerance (Vasa et al., Reference Vasa, Kreiser, Keefer, Singh and Mostofsky2018), difficulties with changes in routine, and sensory overstimulation (Nason, Reference Nason2020). In autistic people, ER challenges are associated with poorer mental health, while better ER is associated with improved well-being (Cai et al., Reference Cai, Richdale, Uljarević, Dissanayake and Samson2018). ER challenges, like depression, are a risk factor for suicidality in autistic people (Brown et al., Reference Brown, Newell, Sahin and Hedley2024; Conner et al., Reference Conner, Golt, Righi, Shaffer, Siegel and Mazefsky2020; Cook et al., Reference Cook, Tomaszewski, Lamarche, Bowman, Klein, Stahl and Klinger2024).
Understanding the subcomponents of ER has also been identified as one way to better understand associations between ER and co-occurring psychiatric conditions like depression in autism (Cai et al., Reference Cai, Hardan, Phillips, Frazier and Uljarević2021). Understanding facets of ER challenges is important in and of itself (i.e., even without relating these to outcomes such as depressive symptomatology) as autistic adults who experience ER challenges report how these challenges negatively impact their day-to-day lives, including within healthcare settings, the workplace, and in relationships (Beck et al., Reference Beck, MacKenzie, Kumar, Breitenfeldt, Chang, Conner, Mandell, White and Mazefsky2024). While extant research investigating the role of ER challenges in depression in autism has examined associations between composite or total scores from measures of each construct, there may be great utility in examining the potential role(s) of specific symptoms or traits and/or their interplay (Borsboom, Reference Borsboom2017; Borsboom et al., Reference Borsboom, Deserno, Rhemtulla, Epskamp, Fried, McNally, Robinaugh, Perugini, Dalege, Costantini, Isvoranu, Wysocki, van Borkulo, van Bork and Waldorp2021; Borsboom & Cramer, Reference Borsboom and Cramer2013). Within conditions like depression, the understanding of individual symptoms may yield powerful insights into which symptoms predict poorer outcomes and which symptoms are promising therapeutic targets to impact depression. Not all depressive symptoms, for instance, equally contribute to or are predictive of a depression diagnosis (Fried & Nesse, Reference Fried and Nesse2015), for instance. Instead, some symptoms appear to exert more influence than others (Fried et al., Reference Fried, Epskamp, Nesse, Tuerlinckx and Borsboom2016), and a single symptom may be more predictive than an additive score of symptoms. Additionally, depression is a disjunctive diagnostic category, with heterogeneous symptom presentation, wherein different patterns of symptom severity, symptom presentations over time, and within-person variability in symptoms are attested (van Eeden et al., Reference van Eeden, van Hemert, Carlier, Penninx and Giltay2019).
Conventional approaches used to conceptualize cognitive constructs (e.g., ER) or psychiatric conditions (e.g., depression) consider them to be unitary constructs that are comprised of independent traits or symptoms. Under such approaches, these traits or symptoms are assumed to reflect a common “cause” or etiology of the broader construct or condition (Borsboom, Reference Borsboom2008). In contrast, network analysis approaches posit that constructs or conditions are not simply indicators of an underlying cause or etiology, but instead, these constructs or conditions exist by virtue of the dynamic, causal interplay of such traits or symptoms (Schmittmann et al., Reference Schmittmann, Cramer, Waldorp, Epskamp, Kievit and Borsboom2013). Consideration of the diversity in depression symptoms and the varied facets of ER promises to advance understanding of the connection between depression and ER, including in ways that might be missed if these were only examined with respect to one another as unitary or disorder-level constructs (Everaert et al., Reference Everaert, Benisty, Gadassi Polack, Joormann and Mishne2022). Thus, unique insights into interrelatedness between ER challenges and depressive symptoms may be achieved through a network analysis approach.
Because of associations of ER with depression and because of the prevalence of ER challenges in autism, co-occurring psychiatric conditions like depression in autism may be better understood and addressed as an intersection of emotion dysregulation with autism (Mazefsky et al., Reference Mazefsky, Herrington, Siegel, Scarpa, Maddox, Scahill and White2013; Mazefsky & White, Reference Mazefsky and White2014; White et al., Reference White, Mazefsky, Dichter, Chiu, Richey and Ollendick2014). Accordingly and perhaps unsurprisingly, ER has been identified as a therapeutic target in reducing the burden of depression in autistic individuals (Cai & Uljarević, Reference Cai, Uljarević, Papaneophytou and Das2021). The study of ER challenges in autism is still relatively new, however, and most research has examined ER challenges among samples of youth or samples including youth and some young adults. However, the consequences of ER challenges for autistic adults may be very different from the consequences for autistic youth. For example, since developmental expectations about ER skills increase as one transitions to adulthood, the potential negative consequences of ER challenges are likely to be more significant for autistic adults relative to autistic children and adolescents. In addition, everyday settings differ for autistic youth versus autistic adults (e.g., school versus employment settings) and these differences may also impact how ER challenges manifest and how they relate to depressive symptomatology.
To date, and primarily in non-autistic people, research has utilized network analysis to examine the structure of various psychiatric disorders and symptoms as well as interrelatedness between such disorders and symptoms (Beard et al., Reference Beard, Millner, Forgeard, Fried, Hsu, Treadway, Leonard, Kertz and Björgvinsson2016; Fried et al., Reference Fried, Eidhof, Palic, Costantini, Huisman-van Dijk, Bockting, Engelhard, Armour, Nielsen and Karstoft2018). In non-autistic samples, a comparatively small body of research has examined associations between ER and psychopathology (Aloi et al., Reference Aloi, Rania, Carbone, Caroleo, Calabrò, Zaffino, Nicolò, Carcione, Coco, Cosentino and Segura-Garcia2021), including depression/depressive symptoms (Depoorter et al., Reference Depoorter, De Raedt, Berking and Hoorelbeke2024; Liang et al., Reference Liang, Liu, Rotaru, Li, Wei, Yuan, Yang, Ren and Liu2022), revealing potentially transdiagnostic as well as condition-specific associations between ER and depression/depressive symptoms (Trautmann et al., Reference Trautmann, Muehlhan, Berking, Miethe, Wigger and Dragan2024).
Given (i) the paucity of research examining ER among autistic adults and its associations with mental health, (ii) known elevated rates of depression among autistic adults relative to general population adults, and (iii) connections posited between ER and mental health in literature with autistic youth samples and in the broader literature on ER and depression, we focus here on ER challenges and depressive symptoms in a large sample of autistic adults. Specifically, the current study sought to examine the network topology of (1) ER challenges, (2) depressive symptomatology, and (3) the interplay of ER challenges and depressive symptomatology, in a sample of autistic adults.
2. Methods
2.1 Participants
Autistic adults aged 18 years and older were recruited via Simons Powering Autism Research (SPARK; The SPARK Consortium, 2018), Research Match service as part of a broader study of autistic adult outcomes (Project Number: RM0045Wallace). The sample in the current study included participants with complete item-level data on both the BDEFS-SRE and the Patient Health Questionnaire (PHQ)-9. This sample was comprised of 775 autistic adults (59.5% assigned female sex at birth) aged 18.2 to 83.3 years (M = 40.2, SD = 13.9).
2.2 Measures
2.2.1 Barkley deficits in executive functioning scale, self-regulation of emotions subscale
The Barkley Deficits in Executive Function Scale (BDEFS) is a self-report measure used to evaluate different aspects of executive functioning in the daily lives of adults (Barkley, Reference Barkley2011).
The BDEFS was developed and validated for use with adults with ADHD (Barkley, Reference Barkley2011, Reference Barkley, Goldstein and Naglieri2014) and has been used with autistic adults (Mihailescu et al., Reference Mihailescu, Andrei, Frunza, Manea and Rad2022).
ER challenges were probed via the BDEFS Self-Regulation of Emotions subscale (BDEFS-SRE), which corresponds to items 77–89 of the BDEFS. The BDEFS-SRE conceptualizes emotion (dys)regulation as a two-stage process, and thus includes items that probe the initial inhibition of emotional responses and the regulation of these responses (Barkley, Reference Barkley2011). The BDEFS-SRE subscale is composed of 13 items and participants respond to each item using a 4-point Likert scale (ranging from 1 = never or rarely to 4 = very often). Higher BDEFS-SRE scores reflect greater challenges in inhibition and self-regulation of emotion. The BDEFS-SRE has demonstrated good internal consistency reliability (Cronbach’s α = 0.95) and acceptable test-retest reliability (r = 0.78) (Barkley, Reference Barkley2011). In the current study sample, internal consistency reliability for the BDEFS-SRE was excellent (Cronbach’s α = 0.94). Item-level data for the BDEFS-SRE served as input to network analyses.
2.2.2 Patient Health Questionnaire
Depressive symptomatology was queried using the 9-item PHQ (Kroenke et al., Reference Kroenke, Spitzer and Williams2001). Participants rated the presence/frequency of depressive symptoms over the preceding two-week period on a 4-point Likert scale (ranging from 0 = not at all to 3 = nearly every day). Higher scores reflect more self-reported depressive symptoms. This instrument demonstrates solid psychometric properties (e.g., high internal consistency reliability across two samples (Cronbach’s α = 0.86 and 0.89) and strong test-retest reliability (r = 0.84)) (Kroenke et al., Reference Kroenke, Spitzer and Williams2001). Further, and of particular relevance to the current study, the PHQ-9 has shown excellent internal validity (Cronbach’s α = 0.91) and good convergent validity in a large sample of autistic adults (Arnold et al., Reference Arnold, Uljarević, Hwang, Richdale, Trollor and Lawson2020).
In the current study sample, internal consistency reliability for the PHQ-9 was good (Cronbach’s α = 0.90). PHQ-9 item-level data served as input to network analyses.
2.2.3 Demographic characteristics and autistic traits
Sociodemographic information was collected, including gender identity, sex assigned at birth, age, ethno-racial identity, and educational attainment.
Participants completed the Autism-Spectrum Quotient (AQ-28) (Hoekstra et al., Reference Hoekstra, Vinkhuyzen, Wheelwright, Bartels, Boomsma, Baron-Cohen, Posthuma and van der Sluis2011). The AQ-28 queries autistic traits using a 4-point Likert scale (1 = definitely agree, 4 = definitely disagree). Total scores range from 28 to 112, where higher scores reflect higher levels of autistic traits. The AQ-28 total score has shown acceptable to good internal consistency, and good validity and reliability within clinical samples (Hoekstra et al., Reference Hoekstra, Vinkhuyzen, Wheelwright, Bartels, Boomsma, Baron-Cohen, Posthuma and van der Sluis2011). In the current study, internal consistency reliability of the AQ-28 was good (Cronbach’s α = 0.83). For the purposes of sample characterization, we determined the number of participants scoring above the AQ-28 cutoff (>65).
2.3 Statistical analyses
We implemented psychological network approaches (Robinaugh et al., Reference Robinaugh, Hoekstra, Toner and Borsboom2020), with all analyses conducted in R (v 4.4.0). We used item-level data from the BDEFS-SRE and the PHQ-9 to estimate three networks: i) ER challenges network (BDEFS-SRE); ii) depressive symptomatology network (PHQ-9); and iii) combined ER challenges-depressive symptomatology network (BDEFS-SRE and PHQ-9).
2.3.1 Identification of redundant nodes
Prior to network estimation, we identified redundant items in the BDEFS-SRE, PHQ-9 and across these two measures. Potentially redundant items increase the likelihood of latent confounding and therefore potentially limit the usefulness of and ability to interpret results for network analyses (Christensen et al., Reference Christensen, Golino and Silvia2020; Hallquist et al., Reference Hallquist, Wright and Molenaar2021), which assume that each node in a psychometric network represents a unique symptom or trait (Borsboom, Reference Borsboom2017). To identify item overlap we followed the procedure in Williams et al. (Reference Williams, McKenney and Gotham2021), which has also been implemented in subsequent work (Waldren et al., Reference Waldren, Leung, Hargitai, Burgoyne, Liceralde, Livingston and Shah2024). In this approach, redundant items were defined based on partial correlation values r p > 0.40. As in Williams et al. (Reference Williams, McKenney and Gotham2021), we also computed a network-based metric of weighted topological overlap (wTO). This metric quantifies the amount of redundancy between pairs of nodes based on shared connections within a given network (Zhang & Horvath, Reference Zhang and Horvath2005). To derive wTO metrics, we used the UVA function in the EGAnet package in R (Golino & Christensen, Reference Golino and Christensen2024). Redundant items were identified as those with a partial correlation >.40 and a wTO ≥.30 – these redundant items were summed. For items with a partial correlation >.40 but a wTO <.30, the item with the lower centrality, based on the sum of all partial pairwise correlations, was removed (Williams et al., Reference Williams, McKenney and Gotham2021).
2.3.2 Network estimation
Non-regularized weighted undirected networks were estimated using the ggmModselect function implemented in the qgraph package (Isvoranu & Epskamp, Reference Isvoranu and Epskamp2023). The ggmModselect function searches for an optimal Gaussian graphical model (GGM). More specifically, the ggmModselect algorithm performs network estimation using unregularized model search. By default, 100 models are generated and then refit without regularization. Model search was implemented in a stepwise fashion, where edges were added or removed until the extended Bayesian information criterion (EBIC) was optimized. The starting point in the stepwise search was the graphical least absolute shrinkage and selection operator or GLASSO. As a means of controlling for spurious edges, we set the tuning parameter γ to 0.5 (where higher values of γ lead to sparser networks (i.e., fewer edges), and where 0.25 and .5 are considered more conservative values) (Foygel & Drton, Reference Foygel and Drton2010). There is an inevitable tradeoff between sensitivity or the ability to detect true edges in a network and specificity and precision, or the ability to ensure that false edges are not included in a network (Isvoranu & Epskamp, Reference Isvoranu and Epskamp2023). Here, however, conservative approaches were pursued in favor of generating networks that excluded potentially false edges, although this also meant potentially sparser networks that did not include some true edges (Isvoranu & Epskamp, Reference Isvoranu and Epskamp2023). Data were treated as ordinal, and polychoric correlation matrices served as inputs to estimation (Epskamp, Reference Epskamp2016; Epskamp et al., Reference Epskamp, Borsboom and Fried2018).
2.3.3 Community detection
We identified communities, or groups of nodes, within each network using the spinglass algorithm (Reichardt & Bornholdt, Reference Reichardt and Bornholdt2006). Specifically, we used the cluster_spinglass function in the R igraph package (Csárdi G et al., Reference Csárdi2024; Csardi & Nepusz, Reference Csardi and Nepusz2006) with the following parameters: spins = 20, start temperature = 1, stop temperature = 0.01, cooling factor = 0.99, gamma = 0.5. To ensure the stability of the communities identified, the algorithm was repeated 1,000 times, and the modal number of communities for each network was selected as the final community structure.
2.3.4 Network visualization
The estimated networks and their community structures were visualized using the MDSnet function in the networktools R package (P. J. Jones et al., Reference Jones, Mair and McNally2018). This function plots networks using multidimensional scaling, where the distance between nodes reflects the associations between nodes, with nodes relatively proximal to one another indicating close associations and nodes relatively distal from one another indicating that nodes are not associated or are negatively associated.
2.3.5 Node centrality and bridge nodes
We characterized the position and role of important nodes within each of the three networks. The importance of a node can be quantified by estimating its centrality in the network. Two node centrality metrics were calculated: one-step expected influence (EI1), and two-step expected influence (EI2) (Robinaugh et al., Reference Robinaugh, Millner and McNally2016). These reflect the importance of a node by examining the number of direct connections between one node and other nodes and the number of indirect connections between one node and others via an intermediate node, respectively. EI1 and EI2 were computed using the expectedInf function in the networktools package in R.
We also computed one-step and two-step bridge expected influence (BEI1 and BEI2, respectively), to understand important nodes that connect different communities of nodes within each of the three networks (P. J. Jones et al., Reference Jones, Ma and McNally2021). Unlike expected influence (EI), bridge expected influence (BEI) considers only those nodes that “bridge” different communities, ignoring the role of nodes within communities. Nodes that bridge communities within a network or that bridge communities between networks may help illuminate features that are important in the development and maintenance of emotion regulation challenges and/or depressive symptomatology (Cramer et al., Reference Cramer, Waldorp, van der Maas and Borsboom2010). BEI1 and BEI2 were computed using the bridge function in the networktools package in R. For EI and BEI, important nodes were identified as those nodes with one-step and/or two-step EI or BEI values greater than 1 standard deviation above the mean.
2.3.6 Network stability
Networks based on psychological datasets (like the dataset in the current study) are susceptible to sampling variability. Thus, we assessed the accuracy of edge weights and the stability of centrality estimates in the three networks (i.e., the ER challenges network, the depressive symptomatology network, and the combined ER challenges-depressive symptomatology network). Specifically, we used the bootnet package in R to assess the accuracy of edges via a case-dropping bootstrap procedure (Epskamp et al., Reference Epskamp, Borsboom and Fried2018). This procedure creates 95% bootstrap confidence intervals for each edge weight using non-parametric bootstrapping with 1,000 replications. Case-drop bootstrapping was used to correlate the centrality indices for each network derived from the full study sample with subsets of the sample.
2.3.7 Network comparisons across subgroups: assigned sex at birth, age, and autistic traits
We additionally evaluated whether the overall underlying network generating models differed for subgroups within the sample of autistic adults. We specifically investigated potential differences based on assigned sex at birth (assigned male sex at birth vs. assigned female sex at birth), age (“younger” vs. “older”), and level of autistic traits (“higher” vs. “lower”). For age and autistic traits, groups were determined based on a median split of the data for the relevant variables. Because of known sex differences in depression in autistic (Mandy et al., Reference Mandy, Chilvers, Chowdhury, Salter, Seigal and Skuse2012; Solomon et al., Reference Solomon, Miller, Taylor, Hinshaw and Carter2012) as well as general population (Altemus et al., Reference Altemus, Sarvaiya and Neill Epperson2014; Kessler et al., Reference Kessler, Petukhova, Sampson, Zaslavsky and Wittchen2012) samples, and consistent with prior work in autistic samples using network analysis (Williams et al., Reference Williams, McKenney and Gotham2021), we compared samples based on assigned sex at birth. Given the wide age range (18-83 years) of the current study’s sample, we compared networks based on age. This comparison based on age is also consistent with research that has examined associations with age at autism diagnosis (Williams et al., Reference Williams, McKenney and Gotham2021), which is highly correlated with age in our sample: r = .77, p < .001. Because of literature suggesting that mental health challenges in autistic persons may best be understood as the intersection of autistic traits with ER challenges (Mazefsky et al., Reference Mazefsky, Herrington, Siegel, Scarpa, Maddox, Scahill and White2013; Mazefsky & White, Reference Mazefsky and White2014; White et al., Reference White, Mazefsky, Dichter, Chiu, Richey and Ollendick2014), we also compared networks based on level of autistic traits.
Using the NCT function in the NetworkComparisonTest package (Van Borkulo et al., Reference Van Borkulo, Epskamp, Jones, Haslbeck and Millner2019), we used resampling-based permutations with 1,000 iterations (van Borkulo et al., Reference van Borkulo, van Bork, Boschloo, Kossakowski, Tio, Schoevers, Borsboom and Waldorp2022) to compare each network for persons assigned female sex at birth relative to those assigned male sex at birth, age group and autistic traits group. Because we did not have a priori hypotheses concerning specific edge(s) and whether and how they might differ across the relevant subsamples, for each comparison we focused on a global test of network structure (Fried et al., Reference Fried, Epskamp, Veenman, van Borkulo, Isvoranu, Epskamp, Waldorp and Borsboom2022).
3. Results
3.1 Participant characteristics
Table 1 presents descriptive statistics for the sample, including demographic characteristics.
Table 1. Participant characteristics

*Age at autism diagnosis, N = 774; AQ-28, N = 774.
Note: AQ-28 = 28-item Autism-Spectrum Quotient; BDEFS-SRE = Barkley Deficits in Executive Function Scale, Self-Regulation of Emotions subscale; PHQ-9 = 9-item Patient Health Questionnaire.
3.2 Emotion regulation challenges and depressive symptomatology: descriptive characterization
For the purposes of better understanding self-reported ER challenges and depressive symptomatology among autistic adults in the current study, Table 1 presents descriptive statistics for the total score on the BDEFS-SRE and PHQ-9 characterization. (Supplemental Table 1 presents descriptive statistics for the item-level data for the BDEFS-SRE and PHQ-9, as used as input to the network analyses.) Figure 1A and 1B, respectively, provide visualization of the item-level scores for these measures. Those assigned male sex at birth and those assigned female sex at birth show similarly variable profiles across items for the BDEFS-SRE, with those assigned female sex at birth reporting more ER challenges across all items. Descriptively, and in terms of total item scores on the PHQ-9, persons assigned female sex at birth reported more depressive symptoms relative to those assigned male sex at birth (Figure 2). Overall, ∼75 of the sample reported depressive symptoms (falling into the “mild” to “severe” range per the PHQ-9), with 50.3% of reporting at least a moderate level of depressive symptoms based on the cut-points provided by the PHQ-9 authors (Kroenke et al., Reference Kroenke, Spitzer and Williams2001). Further, 32.5% of autistic adults in the sample reported that they experienced suicidal ideation in the preceding two weeks (i.e., they endorsed the item “Thoughts that you would be better off dead, or of hurting yourself”).

Figure 1. Mean item-level scores on the (A) BDEFS-SRE and (B) PHQ-9 by assigned sex at birth (male, female). Error bars represent standard error of the mean.

Figure 2. Relative frequencies of severity levels, by assigned sex at birth (male, female), based on PHQ-9 total scores: None = 0; Minimal = 1–4; Mild = 5–9; Moderate = 10–14; Moderately severe = 15–19; Severe = 20–27 (Kroenke et al., Reference Kroenke, Spitzer and Williams2001).
3.3 Identification and elimination of redundant nodes
Three pairs of nodes in the BDEFS-SRE met the criteria for redundancy: items 77 (“Quick to get angry or become upset.”) and 78 (“Overreact emotionally.”) (r p = 0.49, wTO = 0.59); items 81 (“Have trouble calming myself down once I am emotionally upset.”) and 82 (“Cannot seem to regain emotional control and become more reasonable once I am emotional.”) (r p = 0.48, wTO = 0.57), and items 88 (“I am not able to evaluate an emotionally upsetting event more objectively.”) and 89 (“I cannot redefine negative events into more positive viewpoints when I feel strong emotions.”) (r p = 0.47, wTO = 0.54). Each of these three pairs of nodes was summed and redundancy was reexamined. A single pair of nodes was identified as meeting criteria for redundancy: the combined items 88&89 and item 87 (“I cannot rechannel or redirect my emotion into more positive ways or outlets when I get upset.”) (r p = 0.44, wTO = 0.54). Once again items including the combined items were examined for any overlap, and the sum of items 81 and 82 were identified as overlapping with item 83 (“Cannot seem to distract myself away from whatever is upsetting me emotionally to help calm me down. I can’t refocus my mind to a more positive framework.”) (r p = 0.41, wTO = 0.50). After summing these items, examination did not identify any additional items with r p > 0.40; thus, in total eight “items” (including 3 sets of combined items) were used as input to network analysis of the ER network.
Two pairs of nodes in the PHQ-9 met criteria for redundancy: items 1 (“Little interest or pleasure in doing things.”) and 2 (“Feeling down, depressed, or hopeless.”) (r p = 0.48, wTO = 0.57) and items 3 and 4 (r p = 0.49, wTO = 0.59). Each pair was summed and after summing no additional items were identified with r p > 0.40. Input to network estimation for the PHQ-9 network was comprised of a total of seven” “items,” including two that were comprised of two items each.
Examination of the BDEFS-SRE and PHQ-9 items together revealed no overlap beyond that discussed above, and, importantly, no overlap between BDEFS-SRE and PHQ-9 items. Thus, the seven PHQ-9 items and eight items from the BDEFS-SRE served as input to the combined ER-depression network estimation.
3.4 Network estimation and community detection results: ER challenges network
The estimated ER challenges network is visualized in Figure 3A. Network nodes and communities are summarized in Table 2. Edges refer to connections between nodes, and edge weights include information about the strength and the sign of associations between nodes. The sign indicates the direction of an association (positive or negative), while the weight indicates the strength of a conditional association between nodes after controlling for all other variables in the network.

Figure 3. Visualization of the ER challenges (BDEFS-SRE) network (A). Graph created using multidimensional scaling. Edge thickness (i.e., lines) reflects partial correlation strength between items or nodes. See Table 2 for correspondence of node names with items. Nodes are grouped into two ER challenges communities: initial emotion reactivity (shown in orange) and regulation of emotions (shown in blue). (B) One-step EI and (C) One-step Bridge EI.
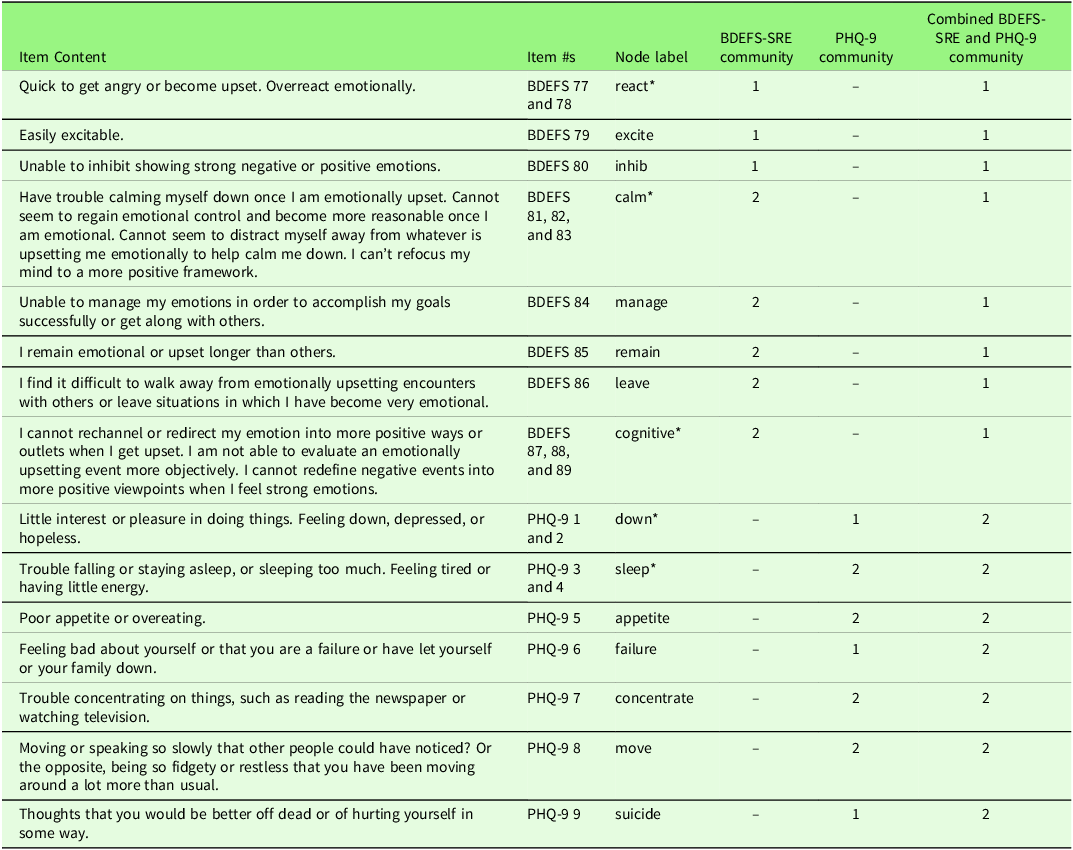
Table 2. Network nodes, item content, and community structure of ER challenges, depressive symptomatology, and combined ER challenges and depressive symptomatology networks

*=Nodes comprised of more than one BDEFS-SRE or PHQ-9 item. Such items were combined to eliminate potential redundancy in items, based on partial correlation >.40 and weighted topological overlap (wTO) >.30.
Out of 28 possible edges in the ER challenges network, 17 were detected. All edges were positive (rs 0.10–0.33). The strongest edges were between the following nodes: calm (summed BDEFS items 81, 82, 83) and cognitive (summed BDEFS items 87, 88, 89) (r = 0.33); excite (BDEFS item 79) and inhib (BDEFS item 80) (r = 0.29); and react (summed BDEFS items 77 and 78) and inhib (BDEFS item 80) (r = 0.27).
Two communities were found. One is comprised of three nodes: react, excite, and inhib. We labeled this community initial emotion reactivity. The second is comprised of five nodes: calm, manage, remain, leave, and cognitive. We labeled this community regulation of emotions.
3.5 Network estimation and community detection results: depression network
The estimated depression network is visualized in Figure 4A. Out of 21 possible edges, 13 were detected. Twelve edges were positive (rs = 0.14–0.42). The strongest connections were as follows: between down (summed PHQ-9 items 1 and 2) and suicide (PHQ-9 item 9) (r = 0.42); between sleep (summed PHQ-9 items 3 and 4) and appetite (PHQ-9 item 5) (r = 0.37); and between failure (PHQ-9 item 6) and suicide (PHQ-9 item 9) (r = 0.39). One negative edge was found between sleep (summed PHQ-9 items 3 and 4) and suicide (PHQ-9 item 9) (r = −0.14).

Figure 4. Visualization of the depressive symptomatology (PHQ-9) network (A). Graph created using multidimensional scaling. Edge thickness (i.e., lines) reflects partial correlation strength between items or nodes. See Table 2 for correspondence of node names with items. Nodes are grouped into two depressive symptoms communities: psychological symptoms (shown in orange) and somatic symptoms (shown in blue). (B) One-step EI and (C) One-step Bridge EI.
Two communities were found for the depression network. The first community is comprised of down, failure, and suicide. We labeled this community psychological symptoms. The second community is comprised of sleep, appetite, concentrate, and move. We labeled this second community somatic symptoms.
3.6 Network estimation results and community detection: combined ER challenges and depression network
The estimated combined ER challenges and depression network is visualized in Figure 5A. Out of a total of 105 possible edges, 32 were detected, 31 of which were positive (rs 0.11-0.41). The single negative edge, as in the PHQ-9 network, was between the PHQ-9 item sleep (summed PHQ-9 items 3 and 4) and suicide (PHQ-9 item 9) (r = −0.14). The strongest connections overall were among PHQ-9 nodes down (summed PHQ-9 items 1 and 2) and suicide (PHQ-9 item 9) (r = 0.41), failure and suicide (0.39), followed by the connections between BDEFS-SRE nodes cognitive (summed BDEFS items 87, 88, 89) and calm (summed BDEFS items 81, 82, 83) (r = 0.33).
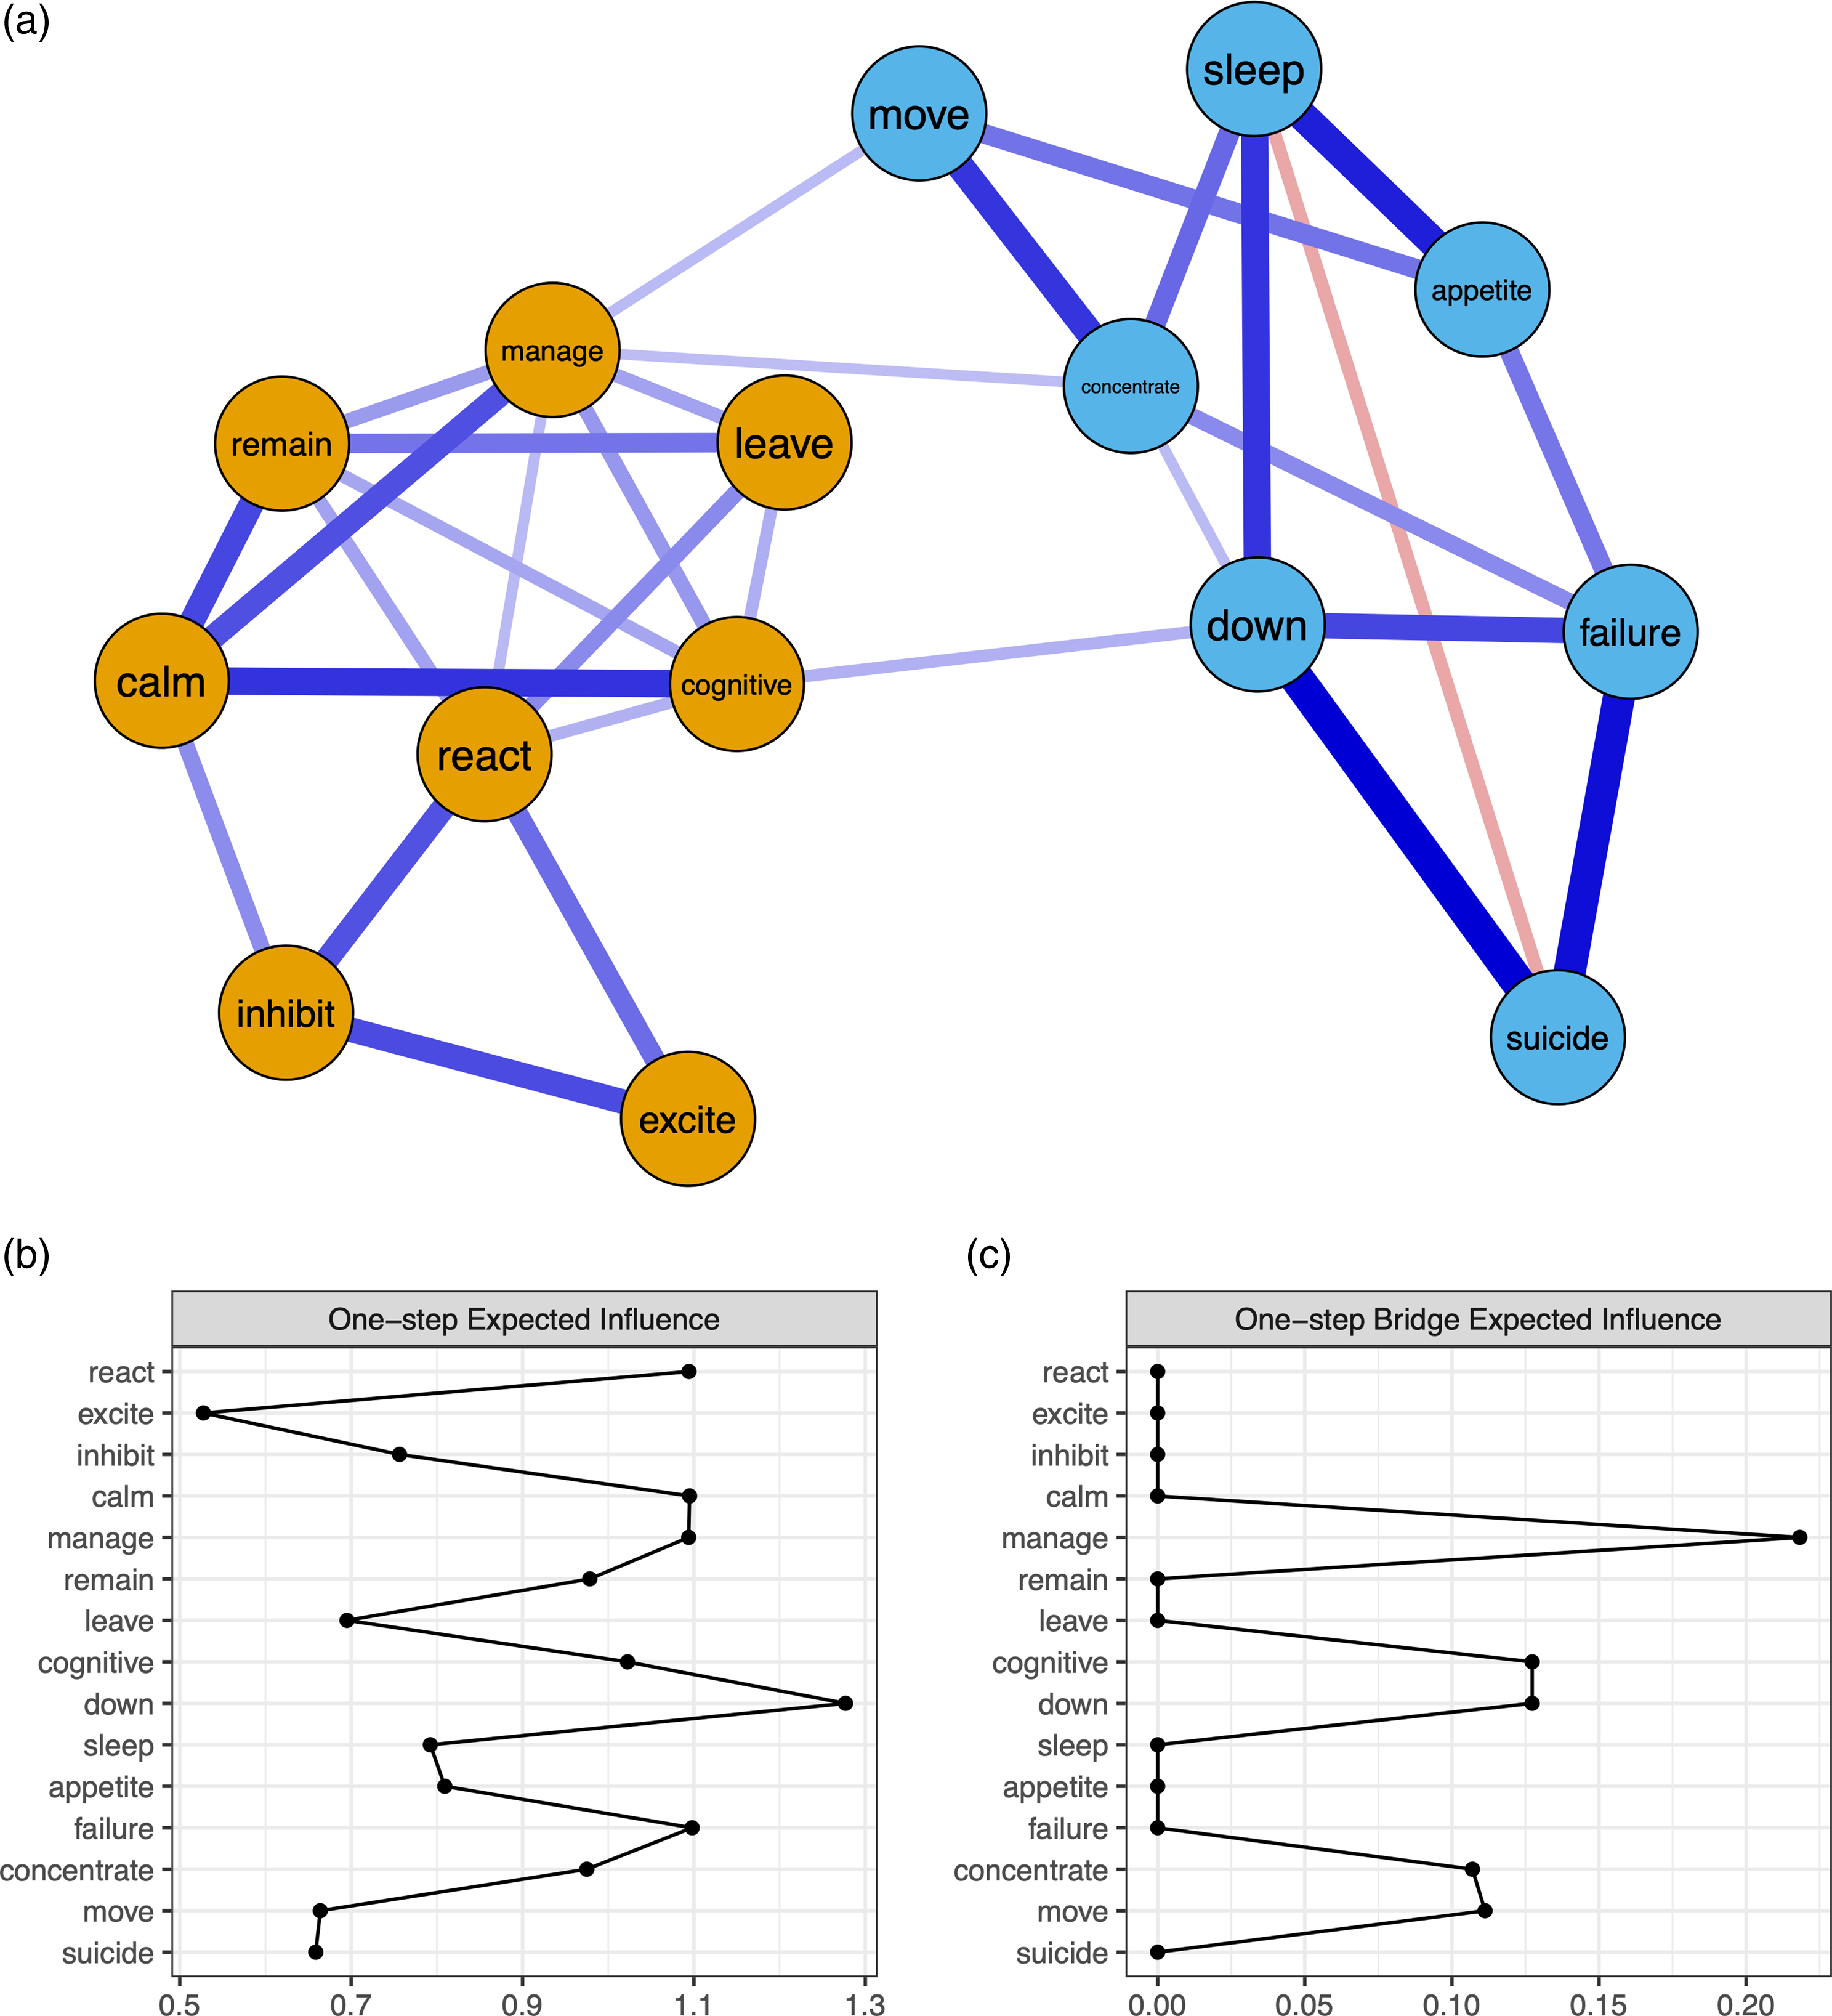
Figure 5. Visualization of the combined ER challenges (BDEFS-SRE) and depressive symptomatology (PHQ-9) network (A). Graph created using multidimensional scaling. Edge thickness (i.e., lines) reflects partial correlation strength between items or nodes. See Table 2 for correspondence of node names with items. Nodes are grouped into two communities corresponding to the BDEFS-SRE items and PHQ-9 items. Accordingly, we labeled these the ER challenges (shown in orange) and depressive symptoms communities (shown in blue), respectively. (B) One-step raw EI and (C) One-step raw Bridge EI.
Between the BDEFS-SRE and PHQ-9 nodes, out of a total of 56 possible edges three edges were detected. These edges were between the following nodes: a) cognitive (summed BDEFS Item 87, 88, 89) and down (summed PHQ-9 items 1 and 2) (r = 0.13); b) manage (BDEFS Item 84) and concentrate (PHQ-9 item 7) (r = 0.11); c) manage (BDEFS Item 84) and move (PHQ-9 item 8) (r = 0.11).
Two communities were identified, which corresponded to the BDEFS-SRE items and PHQ-9 items. Thus, we labeled these the ER challenges and depressive symptoms communities, respectively.
3.7 Node centrality and bridge nodes results
One-step and two-step EI metrics were used to determine the most influential nodes within each network. Figures 3B, 4B, and 5B show one-step EI for the three networks. Supplemental Figures S1A, S2A, and S3A show two-step EI for the networks. Within the ER challenges network, the most influential nodes were determined to be calm (EI1=1.11; EI2=2.14) and react (EI1 = 1.10; EI2 = 1.95). Within the depressive symptomatology network, the most influential nodes were down (EI1 = 1.21; EI2 = 2.24) and failure (EI1 = 1.16; EI2 = 2.15). In the combined ER challenges and depressive symptomatology network, the most influential nodes were down (EI1 = 1.28; EI2=2.38), calm (EI1 = 1.10; EI2 = 2.17), failure (EI1 = 1.10; EI2 = 2.10), and manage (EI1 = 1.09; EI2 = 2.14).
Important bridge nodes, or nodes identified as important in connecting different communities, were identified for each of the three networks. Figure 3B, 4B, and 5B visualize the one-step BEI for each of the three networks. Supplemental Figures S1B, S2B, and S3B visualize the two-step BEI for the networks.
In the ER challenges network, react was identified as a bridge node (BEI1 = 0.59; BEI2 = 1.06). In the depressive symptomatology network, bridge nodes were down (BEI1 = 0.48; BEI2 = 0.86) and failure (BEI1 = 0.47; BEI2 = 0.83). In the combined ER challenges and depressive symptomatology network, bridge nodes were manage (BEI1 = 0.22; BEI2 = 0.39), cognitive (BEI1 = 0.13; BEI2 = 0.31), down (BEI1 = 0.13; BEI2 = 0.25, move (BEI1 = 0.11; BEI2 = 0.24), and concentrate (BEI1 = 0.11; BEI2 = 0.25).
3.8 Network stability results
Sensitivity analyses revealed that node centrality estimates in the ER challenges, depressive symptomatology, and combined ER challenges-depressive symptomatology networks were not confounded by differential variance (Supplemental Figures S4-S6).
The case-dropping bootstrap procedure also supported the validity of the centrality estimates for the ER challenges (CSEI1 = 0.595), depressive symptomatology (CSEI1 = 0.672), and combined ER challenges-depressive symptomatology (CSEI1 = 0.672) networks (Supplemental Figures S7-S9).
3.8.1 Network comparison: sex assigned at birth
For the ER challenges network, the omnibus NCT indicated that the networks generated for persons assigned male sex at birth (n = 461) and persons assigned female sex (n = 313) at did not significantly differ in terms of overall network structure (M = 0.31, p = .44). For the depressive symptoms network, the test indicated that the overall network structure did differ based on assigned sex at birth (M = 0.42, p = .04). The global strength did not differ between networks (S = 0.02, p = .97). Scrutiny of the edge invariance tests (without corrections for multiple comparisons, given the post-hoc nature of these examinations) showed that that the edge that differed was that connecting nodes move and suicide (E = 0.42, p = .001). Examining this edge in the two subsamples revealed that in persons assigned female sex at birth the relevant edge is positive (r = 0.20, suggesting psychomotor symptoms and suicidal ideation are positively associated (i.e., more of one symptom is associated with more of the other). In those assigned male sex at birth this edge is instead negative (r = −0.22), suggesting an inverse association between the two symptoms (i.e., higher levels of one symptom associated with lower levels of the other symptom).
The omnibus network invariance test indicated that the combined ER challenges and depressive symptoms network did not significantly differ by assigned sex in the overall network structures (M = 0.30, p =.62).
3.8.2 Network comparison: age
For the ER challenges network, the omnibus NCT indicated that the networks generated based on age (“younger” (< median of 38.33): n = 386); “older” (≥ median of 38.33): n = 389) of autistic adults did not significantly differ in terms of overall network structure (M = 0.25, p = .80). For the depressive symptoms network, the test indicated that the overall network structure did not differ by age as well (M = 0.31, p = .20). The omnibus network invariance test indicated that the combined ER challenges and depressive symptoms network did not significantly differ by age group (i.e., “younger” versus “older”: M = 0.29, p = .66).
3.8.3 Network comparison: autistic traits
For the ER challenges network, the omnibus NCT indicated that the networks generated based on level of autistic traits (“higher” (≥ median of 85): n = 401; “lower” (< median of 85): n = 375) did not significantly differ in terms of overall network structure (M = 0.32, p = .34). For the depressive symptoms network, the test indicated that the overall network structure did not differ based on autistic traits (M = 0.31, p = .19). The omnibus network invariance test indicated that the combined ER challenges and depressive symptoms network did not significantly differ by autistic traits (i.e., relatively “higher” versus “lower” trait levels: M = 0.31, p =.54).
4. Discussion
To our knowledge, the current study is the first to use network analysis to examine i) ER challenges and ii) associations of these challenges with depressive symptomatology in autistic adults. We discuss interpretations of the ER challenges, depressive symptomatology, and combined ER challenges-depressive symptomatology networks below, including how these results fit within the broader literature. We also discuss how the current study, which serves as an important first step in understanding cross-sectional associations of specific ER challenges with individual depressive symptoms in autistic adults, identifies key directions for future research.
4.1 ER challenges network: community structure, central nodes, and potential interpretations
The ER challenges network was comprised of two communities. One community was made up of BDEFS-SRE items that probe emotional reactivity challenges, or challenges concerning aspects of an initial (or relatively early) stage in emotion processing. Such challenges include becoming easily or quickly upset or having strong emotional reactions, as well as challenges in inhibiting the outward expression of strong emotional reactions. The second community was comprised of BDEFS-SRE items that probe the regulation of emotion after strong emotions have arisen, including challenges in regaining emotional control after an upsetting event; challenges in physically (e.g., leaving an upsetting situation) or mentally (e.g., using distraction or cognitive reappraisal) distancing oneself from such an event; and remaining emotional for a protracted time. This delineation of BDEFS-SRE items into two clusters of items – one that describes challenges in initial emotion reactivity and another that describes challenges in regulating strong emotions once they have arisen – aligns with theoretical models that posit ER is made up of subprocesses or stages. Prominent among them are the process model of emotion regulation (J. J. Gross, Reference Gross2015), on which the BDEFS-SRE is based, as well as the as the adaptive coping with emotions model (Berking & Whitley, Reference Berking and Whitley2014).
Within the ER challenges network, the most influential nodes were calm, from the regulation of emotions community (“Have trouble calming myself down once I am emotionally upset.”, “Cannot seem to regain emotional control and become more reasonable once I am emotional.”, “Cannot seem to distract myself away from whatever is upsetting me emotionally to help calm me down. I can’t refocus my mind to a more positive framework.”), and react, from the initial emotion reactivity community (“Quick to get angry or become upset.”, “Overreact emotionally”). The centrality of calm, which captures challenges in down-regulating emotions and regaining emotional equilibrium, may reflect difficulties disengaging from strong emotional responses once these responses have arisen. These difficulties are suggestive of challenges in cognitive control as these relate to the deployment of emotion regulation strategies, which in turn point to potential broader underlying challenges in executive functioning, which includes aspects not only of emotion regulation but also of inhibitory control and attentional shifting.
Cognitive control, including inhibitory control and attentional shifting are broadly implicated in emotion regulation challenges (Joormann & Stanton, Reference Joormann and Stanton2016; Joormann & Tanovic, Reference Joormann and Tanovic2015; Koster et al., Reference Koster, De Lissnyder, Derakshan and De Raedt2011; LeMoult & Gotlib, Reference LeMoult and Gotlib2019). Research suggests that it is not simply the use of conventionally-labeled “adaptive” versus “maladaptive” strategies, but rather ER flexibility (i.e., one’s ability to shift between or among a repertoire of ER strategies in response to situational demands) that is associated with psychopathology (Aldao et al., Reference Aldao, Sheppes and Gross2015; Battaglini et al., Reference Battaglini, Rnic, Jameson, Jopling, Albert and LeMoult2022; Bonanno & Burton, Reference Bonanno and Burton2013). Further, relative to non-autistic adults, many autistic adults show broad challenges (i.e., beyond ER) in executive functioning (Ghanouni et al., Reference Ghanouni, Quirke, Blok and Casey2021; Johnston et al., Reference Johnston, Murray, Spain, Walker and Russell2019; St. John et al., Reference St. John, Woods, Bode, Ritter and Estes2022). ER challenges are a risk factor for suicidal thoughts and behavior in autistic people (Brown et al., Reference Brown, Newell, Sahin and Hedley2024; Conner et al., Reference Conner, Golt, Righi, Shaffer, Siegel and Mazefsky2020; Cook et al., Reference Cook, Tomaszewski, Lamarche, Bowman, Klein, Stahl and Klinger2024), and ER can be targeted for intervention in autistic people (Lee & Lee, Reference Lee and Lee2024). Indeed, ER challenges and depressive symptoms may serve as separate intervention targets in risk for suicidality in autistic people (Cook et al., Reference Cook, Tomaszewski, Lamarche, Bowman, Klein, Stahl and Klinger2024).
React, from the initial emotion reactivity community, was also identified as a central node in the ER challenges network. The centrality of react implies the influence in ER challenges of strong emotional responses that are difficult to inhibit. As pointed out, the examination of ER challenges among autistic adult samples is lacking. However, themes identified as part of a recent qualitative study centering the lived experiences of emotion dysregulation among autistic adults are conceptually aligned with some of the findings here. Autistic adults with ER challenges describe strong emotional responses. Importantly, they describe how being unaware of their emotional responses until the responses are already “out of control” plays a role in their ER challenges (Beck et al., Reference Beck, MacKenzie, Kumar, Breitenfeldt, Chang, Conner, Mandell, White and Mazefsky2024).
We did not measure emotional awareness in the current study. However, centrality of the react node suggests possibilities for a role of alexithymia, or challenges in identifying bodily sensations as emotions and in mapping emotion labels onto these sensations (Nemiah et al., Reference Nemiah, Freyberger and Sifneos1976), in associations between ER challenges and depression. The current study’s findings are also consistent with reports of autistic adults and their lived experiences of ER challenges and alexithymia (Beck et al., Reference Beck, MacKenzie, Kumar, Breitenfeldt, Chang, Conner, Mandell, White and Mazefsky2024). Alexithymia is elevated in autistic persons relative to the general population (Kinnaird et al., Reference Kinnaird, Stewart and Tchanturia2019). In the general population, higher levels of alexithymia are associated with lower use of adaptive ER strategies and higher use of maladaptive ER strategies (Preece et al., Reference Preece, Mehta, Petrova, Sikka, Bjureberg, Becerra and Gross2023). In autistic people, alexithymia is associated with emotion dysregulation (Cai et al., Reference Cai, Richdale, Uljarević, Dissanayake and Samson2018) and interferes with adaptive ER strategies (Mazefsky et al., Reference Mazefsky, Borue, Day and Minshew2014).
A comparison of ER challenges network structures based on assigned sex at birth, age, and autistic traits showed no significant differences for any of these contrasts. These results suggest similar network structures for ER challenges across these subsamples of autistic adults.
4.2 Depressive symptomatology network: community structure, central nodes, and potential interpretations
Consistent with rates of depression reported in the literature (Hollocks et al., Reference Hollocks, Lerh, Magiati, Meiser-Stedman and Brugha2019), autistic adults in the current study reported high levels of depressive symptomatology, with 50.3% of the sample reporting at least a moderate level of depressive symptoms based on the cut-off recommended by the PHQ-9 authors (Kroenke et al., Reference Kroenke, Spitzer and Williams2001). Also consistent with the literature indicating elevated risk for suicidality and completed suicide among autistic people (Cassidy et al., Reference Cassidy, Bradley, Robinson, Allison, McHugh and Baron-Cohen2014, Reference Cassidy, Bradley, Shaw and Baron-Cohen2018; Costa et al., Reference Costa, Loor and Steffgen2020; Kõlves et al., Reference Kõlves, Fitzgerald, Nordentoft, Wood and Erlangsen2021), an alarming number of autistic adults – roughly a third of the sample – reported suicidal ideation in the preceding two-week period.
Concordant with theoretical models of depression, the community structure of depressive symptoms identified in the sample of autistic adults here maps onto conceptualization of depressive symptoms as comprised of more psychological symptoms versus more somatic or neurovegetative symptoms (Chaudhry et al., Reference Chaudhry, Arshad, Javed and Asif2010; Zauszniewski & Ahmad, Reference Zauszniewski and Ahmad2000). Within the depressive symptomatology network, down (“Little interest or pleasure in doing things,” “Feeling down, depressed, or hopeless.”) was identified as the most central node. This node captures nosological conceptualizations of depression. For instance, the two core symptoms defined by the Diagnostic and Statistical Manual of Mental Disorders, 5 th Edition (DSM-5) criteria for a diagnosis of major depression: depressed mood and anhedonia (American Psychiatric Association, 2013, p. 160). Findings from the current network analysis are also consistent with work indicating that among depression symptoms, sad mood is highly predictive of a depression diagnosis, and this single symptom may in fact be more predictive than the sum of all items from a depression measure (Rosenström et al., Reference Rosenström, Elovainio, Jokela, Pirkola, Koskinen, Lindfors and Keltikangas-Järvinen2015). Findings here are also consistent with research using network analysis of depressive symptoms among adults with major depression, which have identified sad mood and anhedonia as central nodes (Fried et al., Reference Fried, Epskamp, Nesse, Tuerlinckx and Borsboom2016). The similarity of the findings for autistic adults in the current study to existing work using network analysis of depressive symptoms for non-autistic adults with depression suggests similar associations among depressive symptoms in autistic and non-autistic samples, though it remains for future research including both autistic and non-autistic samples to directly examine similarities and/or differences in such associations for autistic and non-autistic adults.
Failure (“Feeling bad about yourself or that you are a failure or have let yourself or your family down.”) was also identified as a central node in the depressive symptomatology network. Feeling like a failure suggests the importance of ruminative negative thoughts. Although rumination was not queried in the current study, this finding would be consistent with work indicating self-directed negative cognitions were central nodes in a network of ruminative traits among autistic adults (Williams et al., Reference Williams, McKenney and Gotham2021). A network comparison revealed no differences for the depressive symptomatology network based on age or autistic traits, suggesting similar network structures across these subsamples of autistic adults. Unlike age and autistic traits, however, the networks significantly differed based on assigned sex. Specifically, the edge between the suicidality and psychomotor symptoms nodes was positive for those assigned female sex at birth but negative for those assigned male sex at birth. The finding of a positive edge is broadly consistent with findings of associations (regardless of assigned sex) between suicidality and psychomotor symptoms (Chu et al., Reference Chu, Klein, Buchman-Schmitt, Hom, Hagan and Joiner2015; Popovic et al., Reference Popovic, Vieta, Azorin, Angst, Bowden, Mosolov, Young and Perugi2015; Rogers et al., Reference Rogers, Ringer and Joiner2016). The positive edge between suicidality and psychomotor symptoms in autistic adults assigned female sex at birth is also consistent with prior network analyses in samples of female nursing students in China and of female Filipino domestic workers in Macao (Garabiles et al., Reference Garabiles, Lao, Xiong and Hall2019; Ren et al., Reference Ren, Wang, Wu, Wei, Cui, Wei, Hu, Peng, Jin, Li, Yang and Liu2021). However, we emphasize that any interpretation of this edge difference between those assigned female at birth and those assigned male at birth should be made with caution, due in part to the preliminary nature of the analysis conducted in comparing networks. As indicated in section 2-3-7, we did not have a priori hypotheses concerning particular edges, and therefore focused on a global test of differences in network structure (Fried et al., Reference Fried, Epskamp, Veenman, van Borkulo, Isvoranu, Epskamp, Waldorp and Borsboom2022). Particular edges were only scrutinized after finding a significant effect in the global test, and because of the post hoc nature of the examination of specific edges, we did not implement comparisons for multiple corrections structure (Fried et al., Reference Fried, Epskamp, Veenman, van Borkulo, Isvoranu, Epskamp, Waldorp and Borsboom2022). Thus, the differences concerning specific edges should be understood as exploratory findings that would need to be replicated and more closely examined in future work.
4.3 Combined ER challenges-depressive symptomatology network: community structure, central nodes, and potential interpretations
In the combined ER challenges-depressive symptomatology network, two communities were identified, comprised of items from the BDEFS-SRE and PHQ-9, respectively. This separate clustering of items from these two measures indicates that ER challenges and depressive symptomatology are interrelated yet distinct constructs. This finding is consistent with other studies in non-autistic samples that have indicated that ER difficulties are not merely symptomatic of a psychiatric condition, such as depression, but instead are a distinct, transdiagnostic construct that points to a potential vulnerability to psychopathology (Trautmann et al., Reference Trautmann, Muehlhan, Berking, Miethe, Wigger and Dragan2024).
Bridge nodes, or nodes connecting the depressive symptomatology and ER challenges communities within the combined BDEFS-SRE and PHQ-9 networks, were manage (“Unable to manage my emotions in order to accomplish my goals successfully or get along with others”) and cognitive (“I cannot rechannel or redirect my emotion into more positive ways or outlets when I get upset.”; “I am not able to evaluate an emotionally upsetting event more objectively.”; “I cannot redefine negative events into more positive viewpoints when I feel strong emotions.”) within the ER challenges community and move (“Moving or speaking so slowly that other people could have noticed? Or the opposite, being so fidgety or restless that you have been moving around a lot more than usual.”), concentrate (“Trouble concentrating on things, such as reading the newspaper or watching television.”), and down (“Little interest or pleasure in doing things.”; “Feeling down, depressed, or hopeless.”) within the depressive symptoms community.
In the combined ER challenges and depression network, the node with the highest one-step and two-step bridge EI was manage, which is part of the ER challenges community, and refers to the ability to manage one’s emotions to accomplish desired goals. Manage showed connections specifically with the move and concentrate nodes in the depressive symptoms community, nodes which belonged in the somatic symptoms community within the depression network. Cognitive (“I cannot rechannel or redirect my emotion into more positive ways or outlets when I get upset. I am not able to evaluate an emotionally upsetting event more objectively. I cannot redefine negative events into more positive viewpoints when I feel strong emotions.”) was another important node in the ER challenges community, showing a connection with down which was part of the psychological symptoms community of the depression network and which was further identified as both an important node within that community as well as a bridge node between that community and the somatic symptoms community of the depression network. As bridge nodes within the depression community were derived from both the somatic symptoms and psychological symptoms, this suggests that ER challenges are associated with both cognitive and psychological symptoms as well as more somatic symptoms of depression. This is consistent with a finding from a network analysis of ruminative thinking, which is an ER strategy (Joormann & Siemer, Reference Joormann, Siemer and Gross2013), and depressive symptoms in autistic adults, which identified bridge nodes from both cognitive-affective and neurovegetative symptoms (Williams et al., Reference Williams, McKenney and Gotham2021).
More broadly, studies using network analysis, including one examining adolescents in clinical settings (Ruan et al., Reference Ruan, Chen and Yan2023) and another examining a community-based sample of adults (Sardella et al., Reference Sardella, Varallo, Agus, Lenzo, Zagaria, Terrone, Musetti, Castelnuovo, Quattropani and Franceschini2023), have indicated the importance of access to ER strategies in influencing depressive symptoms. These studies found a subscale on the Difficulties in Emotion Regulation Scale (DERS) that captures a lack of access to ER strategies and is intended to index the flexible use of ER strategies (Gratz & Roemer, Reference Gratz and Roemer2004), was an important node not only in an ER network but also served as an important node bridging ER and depression symptoms (Ruan et al., Reference Ruan, Chen and Yan2023; Sardella et al., Reference Sardella, Varallo, Agus, Lenzo, Zagaria, Terrone, Musetti, Castelnuovo, Quattropani and Franceschini2023). In a sample of adults seeking outpatient psychotherapy, a network analysis of ER skills and psychiatric symptoms, including but not limited to depressive symptoms, indicated that among all symptoms queried, depressive symptoms showed the strongest associations with all ER skills (Trautmann et al., Reference Trautmann, Muehlhan, Berking, Miethe, Wigger and Dragan2024). More specifically, depression showed the strongest association with the ability to manage one’s negative feelings, consistent with challenges in cognitive reappraisal being associated with depressive symptoms (Trautmann et al., Reference Trautmann, Muehlhan, Berking, Miethe, Wigger and Dragan2024).
It is important to note as well that there may be bidirectional influences between ER and depression (Joormann & Siemer, Reference Joormann, Siemer and Gross2013). Network analysis approaches like those used here estimate undirected weighted networks, meaning that we cannot determine directionality of influence(s), including bidirectional influences. Such bidirectionality has been suggested in the literature (Chan et al., Reference Chan, Hong, Ong and Cheung2023; Dawel et al., Reference Dawel, Shou, Gulliver, Cherbuin, Banfield, Murray, Calear, Morse, Farrer and Smithson2021). For instance, behavioral activation can help to decrease depression symptoms and increase access to ER strategies (Farchione et al., Reference Farchione, Boswell and Wilner2017). It could therefore be that intervening on particular symptoms within the depression symptom network (e.g., psychomotor agitation or difficulties in concentrating) could enhance access to ER strategies and the flexible use of such strategies, thereby impacting depressive symptoms more broadly. However, we follow prior literature on ER and psychopathology using network analysis (Depoorter et al., Reference Depoorter, De Raedt, Berking and Hoorelbeke2024), and broader guidance that cautions using particular centrality indices as definitively recommending particular intervention targets (Bringmann et al., Reference Bringmann, Elmer, Epskamp, Krause, Schoch, Wichers, Wigman and Snippe2019), in not drawing strong conclusions concerning particular targets for intervention based solely on the results reported here.
Comparisons of network structures did not indicate significant differences based on assigned sex at birth, age, or autistic traits. This suggests similar network structures for the combined ER challenges-depressive symptomatology networks across these three subsamples of autistic adults.
4.4 Limitations and future directions
Despite its strengths, the current study has limitations. The sample here is largely comprised of persons who are White and non-Latina/o/e. The lack of representativeness in the sample limits the generalizability of the current study’s findings and more broadly underscores the need for autism research to recruit persons who are underrepresented in autism research and in research in general (Giwa Onaiwu, Reference Giwa Onaiwu2020; Hamad, Reference Hamad2023; Jones et al., Reference Jones, Nicolaidis, Ellwood, Garcia, Johnson, Lopez and Waisman2020; Malone et al., Reference Malone, Pearson, Palazzo, Manns, Rivera and Mason Martin2022). Further, the current study did not include autistic adults with co-occurring intellectual disability, and so results here may not generalize to all autistic adults. Thus, future studies are needed that will use network analysis to understand associations between ER challenges and depressive symptomatology among autistic adults with intellectual disability.
The current study is the first, to our knowledge, to examine ER challenges and depressive symptomatology in autistic adults using network analysis, and thus replication in an independent study sample using the same measures is needed. Additionally, while the findings presented here are conceptually consistent with network analyses that have examined ER strategy use or ER challenges and associations with depressive symptoms (in non-autistic samples) using different measures than those used in the current study (Depoorter et al., Reference Depoorter, De Raedt, Berking and Hoorelbeke2024), future work should examine whether similar network topologies are obtained using measures of ER challenges and depressive symptomology other than those used here. This study focused on ER challenges and associations with depressive symptoms among autistic adults. While the current study did not find a difference in global network structures based on levels of autistic traits (i.e., higher vs. lower), research that includes a non-autistic adult sample is needed to directly compare network generating models for autistic and non-autistic populations. Future work should also examine the potential associations with broader challenges in executive functioning that autistic people experience, and other cognitive constructs, such as alexithymia, which is likely to play a particularly important role in ER challenges among autistic people. However, it is also critical to interrogate external factors that may drive ER challenges among autistic people. Lifelong experiences of social rejection or invalidation, including discrimination, may mean autistic adults are particularly vulnerable to emotion dysregulation in response to negative social experiences (Keenan et al., Reference Keenan, Gotham and Lerner2018). Among non-autistic adults, rejection sensitivity is associated with depression (Gao et al., Reference Gao, Assink, Cipriani and Lin2017), and autistic adults who self-report ER challenges have described the role that social experiences play in these challenges, including lifelong experiences of social invalidation, marginalization, and discrimination and the burden of masking in high-stakes social contexts, including in employment and health care settings (Beck et al., Reference Beck, MacKenzie, Kumar, Breitenfeldt, Chang, Conner, Mandell, White and Mazefsky2024). Longitudinal studies and studies that use experience sampling methods promise to help us understand temporal associations and interactions between and among these internal and external factors. Whether cross-sectional or longitudinal, future studies may help identify not only ways to modify internal factors but importantly external factors, creating social and sensory environments that will promote the success and well-being of autistic people.
Supplementary material
The supplementary material for this article can be found at https://doi.org/10.1017/pen.2025.10006.
Data availability statement
Qualified researchers approved by SPARK can obtain the broader demographic and phenotypic data described in this study by applying through SFARI Base at https://base.sfari.org/.
Acknowledgements
We wish to warmly thank all of the autistic adults who generously gave their time to participate in this study through SPARK. We would also like to express our gratitude to the SPARK clinical sites and SPARK staff. We appreciate obtaining access to recruit participants through SPARK Research Match on SFARI Base.
Author Contributions
Conceptualization: GAM, NRL, GLW
Methodology: GAM, GLW
Formal Analysis: GAM
Data curation: GLW
Project administration: GLW
Writing original draft: GAM
Writing - review and editing: GLW, NRL
Financial Support
This work was directly supported by start-up funds from The George Washington University to Gregory L. Wallace. Authors were supported in this work by the National Institutes of Health as follows: Goldie A. McQuaid (under Grant K01MH129622); Nancy Raitano Lee (under Grant R21HD106164); Gregory L. Wallace (under Grant R21HD106164). The content is solely the responsibility of the authors and does not necessarily represent the official views of the National Institutes of Health.
Competing interests
The author(s) declared no potential conflicts of interest with respect to the research, authorship, and/or publication of this article.
Research Transparency and Reproducibility
n/a


 Open access