


1. Introduction
Cardiovascular flows are pulsatile by nature and feature elastic vessels, non-Newtonian blood behaviour and complex geometries. In the physiological context, the presence of turbulent or irregular flow patterns is particularly important, as regions of altering wall shear stresses are often linked to the onset of cardiovascular diseases (Malek, Alper & Izumo Reference Malek, Alper and Izumo1999; Davies Reference Davies2009). Despite the relevance of turbulence in the cardiovascular system, however, the processes and conditions by which the flow transitions to turbulence are not understood in detail. In order to isolate the influence of different features of the cardiovascular system, it is useful to study them individually. Specifically, we here assess the influence of finite-amplitude perturbations in pulsatile pipe flow and their role in the transition to turbulence. In addition to the Reynolds number ${\textit{Re}}=D\bar {U}/\nu$
, pulsatile flow in straight, smooth and rigid pipes is governed by the pulsation amplitude
${\textit{Re}}=D\bar {U}/\nu$
, pulsatile flow in straight, smooth and rigid pipes is governed by the pulsation amplitude $A=U_{\textit{max}}/\bar {U}-1$
and the Womersley number
$A=U_{\textit{max}}/\bar {U}-1$
and the Womersley number ${\textit{Wo}}=D/2\sqrt {2\pi f /\nu }$
(Womersley Reference Womersley1955). Here,
${\textit{Wo}}=D/2\sqrt {2\pi f /\nu }$
(Womersley Reference Womersley1955). Here, $D$
is the pipe diameter,
$D$
is the pipe diameter, $\bar {U}$
the mean bulk velocity,
$\bar {U}$
the mean bulk velocity, $U_{\textit{max}}$
the maximum bulk velocity,
$U_{\textit{max}}$
the maximum bulk velocity, $f$
the frequency of the pulsation and
$f$
the frequency of the pulsation and $\nu$
the kinematic viscosity.
$\nu$
the kinematic viscosity.
In the limiting case of steady pipe flow ( $A=0$
), the laminar flow is known to be linearly stable up to at least
$A=0$
), the laminar flow is known to be linearly stable up to at least ${\textit{Re}}\gt 10^7$
(Meseguer & Trefethen Reference Meseguer and Trefethen2003). Pulsatile flows are linearly (Floquet) unstable already at lower
${\textit{Re}}\gt 10^7$
(Meseguer & Trefethen Reference Meseguer and Trefethen2003). Pulsatile flows are linearly (Floquet) unstable already at lower ${\textit{Re}}$
(Thomas et al. Reference Thomas, Bassom, Blennerhassett and Davies2011), depending on the pulsation amplitude
${\textit{Re}}$
(Thomas et al. Reference Thomas, Bassom, Blennerhassett and Davies2011), depending on the pulsation amplitude $A$
and frequency
$A$
and frequency ${\textit{Wo}}$
. However, in experiments, transition to turbulence is observed well before the linear stability threshold is crossed (Trip et al. Reference Trip, Kuik, Westerweel and Peolma2012; Xu et al. Reference Xu, Warnecke, Song, Ma and Hof2017, Reference Xu, Varshney, Ma, Song, Riedl, Avila and Hof2020; Elkhader & Brindise Reference Elkhader and Brindise2024). The mechanisms by which perturbations can transiently extract energy from the laminar flow to grow have been widely studied in steady pipe flow and other shear flows (Schmid & Henningson Reference Schmid and Henningson2001). Generally, transient growth originates from the non-normality of the system and depends on the initial energy,
${\textit{Wo}}$
. However, in experiments, transition to turbulence is observed well before the linear stability threshold is crossed (Trip et al. Reference Trip, Kuik, Westerweel and Peolma2012; Xu et al. Reference Xu, Warnecke, Song, Ma and Hof2017, Reference Xu, Varshney, Ma, Song, Riedl, Avila and Hof2020; Elkhader & Brindise Reference Elkhader and Brindise2024). The mechanisms by which perturbations can transiently extract energy from the laminar flow to grow have been widely studied in steady pipe flow and other shear flows (Schmid & Henningson Reference Schmid and Henningson2001). Generally, transient growth originates from the non-normality of the system and depends on the initial energy, $E_0$
, and shape of the perturbation (Trefethen et al. Reference Trefethen, Trefethen, Reddy and Driscoll1993; Schmid & Henningson Reference Schmid and Henningson2001). In the linear regime,
$E_0$
, and shape of the perturbation (Trefethen et al. Reference Trefethen, Trefethen, Reddy and Driscoll1993; Schmid & Henningson Reference Schmid and Henningson2001). In the linear regime, $E_0\rightarrow 0$
, Schmid & Henningson (Reference Schmid and Henningson1994) show that the optimal perturbation to steady pipe flow consists of a pair of streamwise vortices. These vortices generate streamwise streaks due to the lift-up effect (Brandt Reference Brandt2014). Although these streaks are not able to cause turbulence by themselves (Waleffe Reference Waleffe1995), secondary instabilities can lead to streak breakdown and trigger transition (Reddy et al. Reference Reddy, Schmid, Baggett and Henningson1998; Meseguer Reference Meseguer2003).
$E_0\rightarrow 0$
, Schmid & Henningson (Reference Schmid and Henningson1994) show that the optimal perturbation to steady pipe flow consists of a pair of streamwise vortices. These vortices generate streamwise streaks due to the lift-up effect (Brandt Reference Brandt2014). Although these streaks are not able to cause turbulence by themselves (Waleffe Reference Waleffe1995), secondary instabilities can lead to streak breakdown and trigger transition (Reddy et al. Reference Reddy, Schmid, Baggett and Henningson1998; Meseguer Reference Meseguer2003).
The dynamics of pulsatile flows is much richer, because the laminar flow evolves on the viscous time scale, $D/\nu ^2$
, whereas the perturbation dynamics evolves on the convective time scales
$D/\nu ^2$
, whereas the perturbation dynamics evolves on the convective time scales $D/\bar {U}$
. At low Womersley numbers, the laminar profile is parabolic and the pulsation period is long in terms of convective time units,
$D/\bar {U}$
. At low Womersley numbers, the laminar profile is parabolic and the pulsation period is long in terms of convective time units, $T=\pi \textit{Re} /(2\textit{Wo}^2)$
. In this quasi-steady limit
$T=\pi \textit{Re} /(2\textit{Wo}^2)$
. In this quasi-steady limit $T\gt \gt 1$
, optimal perturbations are as in steady pipe flow and their growth is mainly governed by the maximum Reynolds number. At high Womersley numbers, perturbations cannot react to the fast pulsation and the steady case is also recovered, but with the growth controlled by the mean Reynolds number
$T\gt \gt 1$
, optimal perturbations are as in steady pipe flow and their growth is mainly governed by the maximum Reynolds number. At high Womersley numbers, perturbations cannot react to the fast pulsation and the steady case is also recovered, but with the growth controlled by the mean Reynolds number ${\textit{Re}}$
(Xu et al. Reference Xu, Warnecke, Song, Ma and Hof2017). For intermediate Womersley numbers
${\textit{Re}}$
(Xu et al. Reference Xu, Warnecke, Song, Ma and Hof2017). For intermediate Womersley numbers $4 \lesssim \textit{Wo} \lesssim 18$
and sufficiently large amplitudes
$4 \lesssim \textit{Wo} \lesssim 18$
and sufficiently large amplitudes $A \gtrsim 0.4$
, the laminar profile features inflection points during the deceleration phase of the period and is instantaneously linearly unstable (Morón et al. Reference Morón, Feldmann and Avila2022). The instantaneously most unstable mode has a helical shape and is attached to the unstable inflection point that locally fulfils the Fjørtoft criterion. After an initial energy boost via the Orr mechanism, the linear optimal perturbation leverages this modal mechanism and subsequently follows the radial motion of the inflection point (Morón et al. Reference Morón, Feldmann and Avila2022). Its energy growth scales exponentially with
$A \gtrsim 0.4$
, the laminar profile features inflection points during the deceleration phase of the period and is instantaneously linearly unstable (Morón et al. Reference Morón, Feldmann and Avila2022). The instantaneously most unstable mode has a helical shape and is attached to the unstable inflection point that locally fulfils the Fjørtoft criterion. After an initial energy boost via the Orr mechanism, the linear optimal perturbation leverages this modal mechanism and subsequently follows the radial motion of the inflection point (Morón et al. Reference Morón, Feldmann and Avila2022). Its energy growth scales exponentially with ${\textit{Re}}$
(Xu, Song & Avila Reference Xu, Song and Avila2021), because the lifetime of the unstable inflection point scales linearly with
${\textit{Re}}$
(Xu, Song & Avila Reference Xu, Song and Avila2021), because the lifetime of the unstable inflection point scales linearly with ${\textit{Re}}$
in convective time units (Morón et al. Reference Morón, Feldmann and Avila2022).
${\textit{Re}}$
in convective time units (Morón et al. Reference Morón, Feldmann and Avila2022).
These three distinct regimes of linear optimal perturbation dynamics according to the Womersley number result in three corresponding nonlinear regimes. At low ${\textit{Wo}}$
(quasi-steady case), transition to turbulence occurs when the instantaneous Reynolds number exceeds the natural transition number of the experiments in the steady case (Stettler & Hussain Reference Stettler and Hussain1986; Xu & Avila Reference Xu and Avila2018). Subsequently, the flow stays turbulent, if the minimum Reynolds number is sufficiently large, or relaminarises resulting in a cyclic trigger-decay sequence. Xu et al. (Reference Xu, Warnecke, Song, Ma and Hof2017) showed that this decay of turbulence is stochastic and a critical Reynolds number for sustained turbulence, which depends on
${\textit{Wo}}$
(quasi-steady case), transition to turbulence occurs when the instantaneous Reynolds number exceeds the natural transition number of the experiments in the steady case (Stettler & Hussain Reference Stettler and Hussain1986; Xu & Avila Reference Xu and Avila2018). Subsequently, the flow stays turbulent, if the minimum Reynolds number is sufficiently large, or relaminarises resulting in a cyclic trigger-decay sequence. Xu et al. (Reference Xu, Warnecke, Song, Ma and Hof2017) showed that this decay of turbulence is stochastic and a critical Reynolds number for sustained turbulence, which depends on ${\textit{Wo}}$
and
${\textit{Wo}}$
and $A$
, can only be defined in a statistical sense, exactly as in steady pipe flow (Avila et al. Reference Avila, Moxey, Lozar, Avila, Barkley and Hof2011). The high Womersley regime is again essentially as steady pipe flow and is controlled by the mean Reynolds number, because turbulence does not have time to react to the fast pulsation (Trip et al. Reference Trip, Kuik, Westerweel and Peolma2012; Xu et al. Reference Xu, Warnecke, Song, Ma and Hof2017; Xu & Avila Reference Xu and Avila2018). In the intermediate Womersley regime, a smooth transition between the two cases is observed at low
$A$
, can only be defined in a statistical sense, exactly as in steady pipe flow (Avila et al. Reference Avila, Moxey, Lozar, Avila, Barkley and Hof2011). The high Womersley regime is again essentially as steady pipe flow and is controlled by the mean Reynolds number, because turbulence does not have time to react to the fast pulsation (Trip et al. Reference Trip, Kuik, Westerweel and Peolma2012; Xu et al. Reference Xu, Warnecke, Song, Ma and Hof2017; Xu & Avila Reference Xu and Avila2018). In the intermediate Womersley regime, a smooth transition between the two cases is observed at low $A\lesssim 0.4$
(Xu et al. Reference Xu, Warnecke, Song, Ma and Hof2017; Xu & Avila Reference Xu and Avila2018).
$A\lesssim 0.4$
(Xu et al. Reference Xu, Warnecke, Song, Ma and Hof2017; Xu & Avila Reference Xu and Avila2018).
At high $A \gtrsim 0.4$
the nonlinear dynamics is entirely different and Xu et al. (Reference Xu, Varshney, Ma, Song, Riedl, Avila and Hof2020) observed that small geometric imperfections can trigger helical flow patterns during the deceleration phase that break down into turbulence before relaminarising during the acceleration phase. This process repeated itself cyclically in the experiments. Additionally they performed direct numerical simulations (DNS) of linearly optimal helical waves superimposed to the laminar flow at finite amplitude. The helical waves were found to be strongly amplified and, in the presence of background noise and a sufficient initial amplitude, to break down to turbulence. The effect of small geometric imperfections was further investigated numerically by Feldmann, Morón & Avila (Reference Feldmann, Morón and Avila2020), who perturbed the pulsatile flow with small axisymmetric, mirror symmetric and tilted bumps. Axisymmetric bumps were unable to trigger turbulence, whereas non-axisymmetric bumps triggered vigorous vortical structures during the deceleration phase. Specifically, helical flow patterns were observed in the presence of the tilted bump and oblique patterns for the symmetric one.
$A \gtrsim 0.4$
the nonlinear dynamics is entirely different and Xu et al. (Reference Xu, Varshney, Ma, Song, Riedl, Avila and Hof2020) observed that small geometric imperfections can trigger helical flow patterns during the deceleration phase that break down into turbulence before relaminarising during the acceleration phase. This process repeated itself cyclically in the experiments. Additionally they performed direct numerical simulations (DNS) of linearly optimal helical waves superimposed to the laminar flow at finite amplitude. The helical waves were found to be strongly amplified and, in the presence of background noise and a sufficient initial amplitude, to break down to turbulence. The effect of small geometric imperfections was further investigated numerically by Feldmann, Morón & Avila (Reference Feldmann, Morón and Avila2020), who perturbed the pulsatile flow with small axisymmetric, mirror symmetric and tilted bumps. Axisymmetric bumps were unable to trigger turbulence, whereas non-axisymmetric bumps triggered vigorous vortical structures during the deceleration phase. Specifically, helical flow patterns were observed in the presence of the tilted bump and oblique patterns for the symmetric one.
Although linear transient growth analyses capture the mechanism of perturbation amplification, it does not provide information on whether turbulence is triggered, nor which type of perturbation is most efficient in destabilising the laminar flow. The answer to these questions requires a fully nonlinear approach, i.e. considering also the initial energy of the perturbation (Kerswell Reference Kerswell2018).
Nonlinear optimal perturbations have been computed for different canonical systems, including steady pipe (Pringle & Kerswell Reference Pringle and Kerswell2010; Pringle et al. Reference Pringle, Willis and Kerswell2012, Reference Pringle, Willis and Kerswell2015), boundary-layer (Cherubini et al. Reference Cherubini, De Palma, Robinet and Bottaro2010, Reference Cherubini, De Palma, Robinet and Bottaro2011) and plane Couette flows (Duguet et al. Reference Duguet, Brandt and Larsson2010; Monokrousos et al. Reference Monokrousos, Bottaro, Brandt, Vita and Henningson2011; Duguet et al. Reference Duguet, Monokrousos, Brandt and Henningson2013). In all the systems, a qualitatively similar behaviour was observed. After passing a certain initial energy level, nonlinearities become substantial and modes can interact with each other. The corresponding optimal perturbations exploit nonlinearities and sequentially leverage different growth mechanisms to achieve a significantly larger growth than linear optimal perturbations. Specifically, they first leverage the Orr mechanism (Orr Reference Orr1907) to experience a quick initial energy amplification. Subsequently, they evolve into oblique waves (Schmid & Henningson Reference Schmid and Henningson1992) and then into modes that use the lift-up mechanism (Landahl Reference Landahl1980; Brandt Reference Brandt2014) to generate high- and low-speed streaks. For sufficiently low initial energies, the streaks remain stable and the perturbations decay. Above a critical energy $E_0^{\textit{crit}}$
, defining the minimal seed (Kerswell Reference Kerswell2018), the streaks become unstable and break down to turbulence.
$E_0^{\textit{crit}}$
, defining the minimal seed (Kerswell Reference Kerswell2018), the streaks become unstable and break down to turbulence.
In this paper, we investigate the competition between helical perturbations leveraging the inflection points of the laminar profile and the classical lift-up perturbations leveraging the shear of the time-averaged profile. We focus on their role in destabilising the laminar flow and eventually triggering turbulence. For this purpose, we apply nonlinear non-modal stability theory (Kerswell Reference Kerswell2018) and compute nonlinear optimal perturbations of pulsatile pipe flow. In addition to the Reynolds number ${\textit{Re}}$
and the initial energy of the perturbation
${\textit{Re}}$
and the initial energy of the perturbation $E_0$
, optimal perturbations in pulsatile flow are governed by the pulsation amplitude
$E_0$
, optimal perturbations in pulsatile flow are governed by the pulsation amplitude $A$
, Womersley number
$A$
, Womersley number ${\textit{Wo}}$
and initial perturbation time
${\textit{Wo}}$
and initial perturbation time $\tau _0$
. The latter is crucial because of the prominence of the lift-up effect in the acceleration phase and helical perturbations in the deceleration phase (Xu et al. Reference Xu, Song and Avila2021).
$\tau _0$
. The latter is crucial because of the prominence of the lift-up effect in the acceleration phase and helical perturbations in the deceleration phase (Xu et al. Reference Xu, Song and Avila2021).
The rest of the paper is structured as follows. The methodology, implementation and technical details are presented in § 2. In § 3, we quantify the role of linearly optimal helical and reflection symmetric (oblique) perturbations in the nonlinear regime. We then perform nonlinear optimisations and study the effect of the initial amplitude on the shape and growth of optimal perturbations. In combination with DNS, we quantify the role of different optimal perturbations in the transition to turbulence in pulsatile pipe flow. To do this end, in § 4 the parameters of experiments of Xu et al. (Reference Xu, Varshney, Ma, Song, Riedl, Avila and Hof2020) are considered as reference and optimal perturbations at various initial energies and different times throughout the period are computed and analysed. Finally, we explore the effect of different pulsation parameters $(\textit{Re}, \textit{Wo}, A)$
on transient amplification of optimal perturbations and the transition to turbulence at selected initial times. In § 5, the results are discussed and compared with previous linear non-modal analyses, nonlinear DNS and experimental results.
$(\textit{Re}, \textit{Wo}, A)$
on transient amplification of optimal perturbations and the transition to turbulence at selected initial times. In § 5, the results are discussed and compared with previous linear non-modal analyses, nonlinear DNS and experimental results.
2. Methods and implementation
We consider the flow of a fluid with constant density $\rho$
and kinematic viscosity
$\rho$
and kinematic viscosity $\nu$
through a cylindrical pipe driven with a pulsatile harmonic mass flux. Experimentally, this is equivalent to a pulsatile flow driven by a piston. Throughout this paper, we scale all lengths with the pipes radius
$\nu$
through a cylindrical pipe driven with a pulsatile harmonic mass flux. Experimentally, this is equivalent to a pulsatile flow driven by a piston. Throughout this paper, we scale all lengths with the pipes radius $D/2$
and velocities with twice the mean bulk velocity
$D/2$
and velocities with twice the mean bulk velocity $2\bar {U}$
. The steady component of the laminar profile then reads
$2\bar {U}$
. The steady component of the laminar profile then reads
 \begin{equation} \boldsymbol{\bar {u}}(r)=\big(1-r^2\big)\boldsymbol{e}_z \hspace {10mm} r\in [0,1] ,\end{equation}
and the enforced pulsatile bulk velocity is
 \begin{equation} u_b(t)=\frac {1}{2}\left [1+A \sin \left (2\pi \frac {t}{T}\right )\right ]\!. \end{equation}
The resulting temporally evolving laminar base flow profile $\boldsymbol{U}$
is given by the classical Sexl–Womersley solution (Sexl Reference Sexl1930; Womersley Reference Womersley1955). We aim to find the global optimal perturbation
$\boldsymbol{U}$
is given by the classical Sexl–Womersley solution (Sexl Reference Sexl1930; Womersley Reference Womersley1955). We aim to find the global optimal perturbation $\boldsymbol{u}{'}(r,\theta ,z,t=\tau _0)=\boldsymbol{u}_0{'}$
introduced at time
$\boldsymbol{u}{'}(r,\theta ,z,t=\tau _0)=\boldsymbol{u}_0{'}$
introduced at time $\tau _0$
, which maximises its energy growth
$\tau _0$
, which maximises its energy growth
 \begin{equation} G=\frac {\left \langle |\boldsymbol{u}'(t={\tau _0+\tau })|^2\right \rangle }{\left \langle |\boldsymbol{u}^{\prime}_0|^2\right \rangle } =\frac {E(t={\tau _0+\tau })}{E_0} ,\end{equation}
at a given time $\tau _0+\tau$
. Here,
$\tau _0+\tau$
. Here,
 \begin{equation} \langle \ldots \rangle =\int _0^{L_z} \int _0^{2\pi } \int _0^1 \ (\ldots )r \ {\rm d}r \ {\rm d}\theta \ {\rm d}z ,\end{equation}
with pipe length $L_z$
and
$L_z$
and $E_0$
is fixed in each optimisation, but changed across runs. To maintain the desired Reynolds number, a zero bulk velocity of is enforced for the perturbation, i.e.
$E_0$
is fixed in each optimisation, but changed across runs. To maintain the desired Reynolds number, a zero bulk velocity of is enforced for the perturbation, i.e. $ \langle \boldsymbol{u}{'}(r,\theta ,z,t)\boldsymbol{\cdot }\boldsymbol{e}_z\rangle =0$
at all times.
$ \langle \boldsymbol{u}{'}(r,\theta ,z,t)\boldsymbol{\cdot }\boldsymbol{e}_z\rangle =0$
at all times.
We follow the nonlinear variational approach of Kerswell, Pringle & Willis (Reference Kerswell, Pringle and Willis2014) and define a Lagrangian to enforce appropriate constraints. First, we constrain the optimisation to perturbations with initial energy $E_0$
through the Lagrangian multiplier
$E_0$
through the Lagrangian multiplier $\lambda$
. In addition, during their evolution, perturbations must fulfil momentum and mass conservation, and have zero bulk velocity. These constraints are applied through the Lagrangian multipliers
$\lambda$
. In addition, during their evolution, perturbations must fulfil momentum and mass conservation, and have zero bulk velocity. These constraints are applied through the Lagrangian multipliers $\boldsymbol{u}^{\dagger }=(u_r^{\dagger },u_{\theta }^{\dagger },u_z^{\dagger }), \ p^{\dagger }$
and
$\boldsymbol{u}^{\dagger }=(u_r^{\dagger },u_{\theta }^{\dagger },u_z^{\dagger }), \ p^{\dagger }$
and $\varGamma$
, respectively, known as the adjoint variables. The Lagrangian is accordingly defined as
$\varGamma$
, respectively, known as the adjoint variables. The Lagrangian is accordingly defined as
 \begin{eqnarray} \mathcal{L}&=&\left \langle \frac {1}{2} |\boldsymbol{u}'(t=\tau_0+\tau)|^2\right \rangle \nonumber \\ && +\lambda \left [ \left \langle \frac {1}{2} |\boldsymbol{u}^{\prime}_0|^2\right \rangle -E_0\right ] \nonumber \\ && +\int _{{\tau _0}}^{\tau _0+\tau } \left \langle \boldsymbol{u}^{\dagger } \boldsymbol{\cdot } \left [ \frac {\partial \boldsymbol{u}'}{\partial t}+(\boldsymbol{U}\boldsymbol{\cdot } {\boldsymbol{\nabla }})\boldsymbol{u}' +(\boldsymbol{u}'\boldsymbol{\cdot } {\boldsymbol{\nabla }})\boldsymbol{U} +(\boldsymbol{u}'\boldsymbol{\cdot } {\boldsymbol{\nabla }})\boldsymbol{u}' +\boldsymbol{\nabla }p' -\frac {1}{\textit{Re}}\boldsymbol{\nabla} ^2\boldsymbol{u}' \right ] \right \rangle {\rm d}t \nonumber \\ && +\int _{{\tau _0}}^{{\tau _0+\tau }} \left \langle p^{\dagger } \left [\boldsymbol{\nabla }\boldsymbol{\cdot }\boldsymbol{u}' \right ]\right \rangle \ {\rm d}t +\int _{{\tau _0}}^{{\tau _0+\tau }} \varGamma \left \langle \boldsymbol{u}' \boldsymbol{\cdot } \boldsymbol{e}_z\right \rangle \ {\rm d}t. \end{eqnarray}
We treat the zero flux constraint as in Pringle, Willis & Kerswell (Reference Pringle, Willis and Kerswell2012) and split the pressure field into a spatially homogeneous time-dependent pressure gradient $f_z(t)\boldsymbol{e}_z$
, which maintains the zero bulk velocity of the perturbation and a spatially periodic perturbation pressure, so the total perturbation pressure is
$f_z(t)\boldsymbol{e}_z$
, which maintains the zero bulk velocity of the perturbation and a spatially periodic perturbation pressure, so the total perturbation pressure is $p'=f_z(t)z\boldsymbol{e}_z+\hat {p}'$
.
$p'=f_z(t)z\boldsymbol{e}_z+\hat {p}'$
.
For optimal perturbation fields, i.e. constrained extrema of the functional $\mathcal{L}$
, the first variation of
$\mathcal{L}$
, the first variation of $\mathcal{L}$
must vanish. Taking the first variation with respect to
$\mathcal{L}$
must vanish. Taking the first variation with respect to $\boldsymbol{u}'$
and
$\boldsymbol{u}'$
and $p'$
, integrating by parts and considering no-slip boundary conditions at the pipe wall
$p'$
, integrating by parts and considering no-slip boundary conditions at the pipe wall $\boldsymbol{u}'(r=1,\theta ,z,t)=0$
, as well as periodicity in the axial and azimuthal directions, leads to the following set of equations (Cherubini et al. Reference Cherubini, De Palma, Robinet and Bottaro2010; Pringle & Kerswell Reference Pringle and Kerswell2010; Monokrousos et al. Reference Monokrousos, Bottaro, Brandt, Vita and Henningson2011; Kerswell et al. Reference Kerswell, Pringle and Willis2014):
$\boldsymbol{u}'(r=1,\theta ,z,t)=0$
, as well as periodicity in the axial and azimuthal directions, leads to the following set of equations (Cherubini et al. Reference Cherubini, De Palma, Robinet and Bottaro2010; Pringle & Kerswell Reference Pringle and Kerswell2010; Monokrousos et al. Reference Monokrousos, Bottaro, Brandt, Vita and Henningson2011; Kerswell et al. Reference Kerswell, Pringle and Willis2014):
-
(i) initial energy constraint
(2.6) \begin{eqnarray} \frac {\delta \mathcal{L}}{\delta \lambda }= \left [ \left \langle \frac {1}{2} |\boldsymbol{u}^{\prime}_0|^2\right \rangle -E_0\right ] =0; \end{eqnarray}
-
(ii) direct Navier–Stokes equations
(2.7)
\begin{align}& \frac {\delta \mathcal{L}}{\delta \boldsymbol{u}^{\dagger }}= \frac {\partial \boldsymbol{u}'}{\partial t}+(\boldsymbol{U}\boldsymbol{\cdot } {\boldsymbol{\nabla }})\boldsymbol{u}' +(\boldsymbol{u}'\boldsymbol{\cdot } {\boldsymbol{\nabla }})\boldsymbol{U} +(\boldsymbol{u}'\boldsymbol{\cdot } {\boldsymbol{\nabla }})\boldsymbol{u}' +\boldsymbol{\nabla }\hat {p}'+f_z \boldsymbol{e}_z -\frac {1}{\textit{Re}}\boldsymbol{\nabla} ^2\boldsymbol{u}' =\boldsymbol{0} , \end{align}
(2.8)
\begin{align}&\qquad\qquad\qquad\qquad\qquad\qquad\qquad \frac {\delta \mathcal{L}}{\delta p^{\dagger }}= \boldsymbol{\nabla }\boldsymbol{\cdot }\boldsymbol{u}' =0; \\[9pt] \nonumber \end{align}
-
(iii) zero bulk velocity of the direct field
(2.9)
\begin{equation} \frac {\delta \mathcal{L}}{\delta \varGamma }= \left \langle \boldsymbol{u}' \boldsymbol{\cdot } \boldsymbol{e}_z\right \rangle =0 ;\end{equation}
-
(iv) compatibility condition
(2.10)
\begin{eqnarray} \frac {\delta \mathcal{L}}{\delta \boldsymbol{u}'(t={\tau _0+\tau })}= \boldsymbol{u}(t={\tau _0+\tau })+\boldsymbol{u}^{\dagger }(t={\tau _0+\tau }) = \boldsymbol{0}; \end{eqnarray}
-
(v) adjoint Navier–Stokes equations
(2.11)
\begin{align}& \frac {\delta \mathcal{L}}{\delta \boldsymbol{u}'}=-\frac {\partial \boldsymbol{u}^{\dagger }}{\partial t}-\left [(\boldsymbol{U}+\boldsymbol{u}')\boldsymbol{\cdot }\boldsymbol{\nabla }\right ]\boldsymbol{u}^{\dagger }+\left [\boldsymbol{\nabla }(\boldsymbol{U}+\boldsymbol{u}')\right ]^T\boldsymbol{u}^{\dagger } -\boldsymbol{\nabla }\hat {p}^{\dagger }+f_z^{\dagger }\boldsymbol{e}_z-\frac {1}{\textit{Re}}\boldsymbol{\nabla} ^2\boldsymbol{u}^{\dagger } =\boldsymbol{0} ,\end{align}
(2.12)
\begin{align}&\qquad\qquad\qquad\qquad\qquad\qquad\qquad \frac {\delta \mathcal{L}}{\delta \hat {p}'}= \boldsymbol{\nabla }\boldsymbol{\cdot }\boldsymbol{u}^{\dagger }=0 ; \\[9pt] \nonumber \end{align}
-
(vi) zero bulk velocity of the adjoint field
(2.13)
\begin{equation} \frac {\delta \mathcal{L}}{\delta f_z}= \big \langle \boldsymbol{u}^{\dagger } \boldsymbol{\cdot } \boldsymbol{e}_z\big \rangle =0 ;\end{equation}
-
(vii) optimality condition
(2.14)
\begin{eqnarray} \frac {\delta \mathcal{L}}{\delta \boldsymbol{u}^{\prime}_0}= \lambda \boldsymbol{u}^{\prime}_0 -\boldsymbol{u}^{\dagger }_0 =\boldsymbol{0}. \end{eqnarray}


Equations (2.11)–(2.12) are the adjoint Navier–Stokes equations, subject to a zero bulk adjoint velocity (2.13). Note the negative sign of the temporal derivative, which allows us to solve these equations backwards in time from $t=\tau _0+\tau$
to
$t=\tau _0+\tau$
to $t=\tau _0$
. The initial condition for the adjoint equations is given by the compatibility condition (2.10), obtained by integrating the direct equations forward. As in the direct equations, the dual pressure field
$t=\tau _0$
. The initial condition for the adjoint equations is given by the compatibility condition (2.10), obtained by integrating the direct equations forward. As in the direct equations, the dual pressure field $p^{\dagger }$
is divided in a time-dependent pressure gradient
$p^{\dagger }$
is divided in a time-dependent pressure gradient $f_z^{\dagger }\boldsymbol{e}_z$
, which maintains the zero bulk velocity (2.13) and a spatially periodic part
$f_z^{\dagger }\boldsymbol{e}_z$
, which maintains the zero bulk velocity (2.13) and a spatially periodic part $\hat {p}^{\dagger }$
.
$\hat {p}^{\dagger }$
.
2.1. Adjoint looping procedure
As in previous studies (Cherubini et al. Reference Cherubini, De Palma, Robinet and Bottaro2010; Pringle & Kerswell Reference Pringle and Kerswell2010; Monokrousos et al. Reference Monokrousos, Bottaro, Brandt, Vita and Henningson2011; Duguet et al. Reference Duguet, Monokrousos, Brandt and Henningson2013), we solve the set of equations employing the iterative adjoint looping procedure. We initialise the first adjoint looping iteration $s=0$
with an initial guess of the optimal perturbation
$s=0$
with an initial guess of the optimal perturbation $\boldsymbol{u}^{\prime}_0{^{(s=0)}}$
scaled to energy
$\boldsymbol{u}^{\prime}_0{^{(s=0)}}$
scaled to energy $E_0$
. The Navier–Stokes equations (2.7)–(2.8), subjected to (2.9) are then integrated forward in time, to obtain the velocity field
$E_0$
. The Navier–Stokes equations (2.7)–(2.8), subjected to (2.9) are then integrated forward in time, to obtain the velocity field $\boldsymbol{u}'(t=\tau _0+\tau )$
. With the solution of the direct system at time
$\boldsymbol{u}'(t=\tau _0+\tau )$
. With the solution of the direct system at time $t=\tau _0+\tau$
, the adjoint field is initialised according to the compatibility condition (2.10). The adjoint (2.11)–(2.12), subjected to (2.13), are then solved backwards in time to obtain
$t=\tau _0+\tau$
, the adjoint field is initialised according to the compatibility condition (2.10). The adjoint (2.11)–(2.12), subjected to (2.13), are then solved backwards in time to obtain $\boldsymbol{u}^{\dagger }(t=0)$
. Since the initial guess of the optimal perturbation
$\boldsymbol{u}^{\dagger }(t=0)$
. Since the initial guess of the optimal perturbation $\boldsymbol{u}_0'{^{(s=0)}}$
is unlikely to be optimal and hence the optimality condition (2.14) is not fulfilled
$\boldsymbol{u}_0'{^{(s=0)}}$
is unlikely to be optimal and hence the optimality condition (2.14) is not fulfilled
 \begin{equation} \frac {\delta \mathcal{L}}{\delta \boldsymbol{u}^{\prime}_0}\neq 0,\end{equation}
the initial perturbation is improved as explained in the next section. With the improved initial perturbation $\boldsymbol{u}_{0}^{\prime(s)}$
, a new iteration
$\boldsymbol{u}_{0}^{\prime(s)}$
, a new iteration $s+1$
of the adjoint looping procedure is initialised and the procedure is repeated until the optimality condition is fulfilled.
$s+1$
of the adjoint looping procedure is initialised and the procedure is repeated until the optimality condition is fulfilled.
2.2. Optimisation step
There are several approaches to move the initial condition towards a maximum, such as the gradient-ascent or rotational-gradient method (Foures, Caulfield & Schmid Reference Foures, Caulfield and Schmid2013; Kerswell Reference Kerswell2018). We employ a gradient-ascent method
 \begin{align} \boldsymbol{u}_0'{^{(s+1)}}&=\boldsymbol{u}_{0}^{\prime(s)}+\alpha \left [ \frac {\delta \mathcal{L}}{\delta \boldsymbol{u}^{\prime}_0}\right ]^{(s)} \!,\end{align}
 \begin{align} & =\boldsymbol{u}_{0}^{\prime(s)}+\alpha \left [\lambda \boldsymbol{u}^{\prime}_0{^{(s)}} -\boldsymbol{u}^{\dagger }_0{^{(s)}}\right ]\!, \end{align}
where $\alpha$
is the step size. The Lagrangian multiplier
$\alpha$
is the step size. The Lagrangian multiplier $\lambda$
is chosen to enforce the initial energy constraint of the updated perturbation
$\lambda$
is chosen to enforce the initial energy constraint of the updated perturbation
 \begin{equation} E_0 =\left \langle \frac {1}{2}\left|\boldsymbol{u}^{\prime}_0{^{(s+1)}} \right|^2 \right \rangle =\left \langle \frac {1}{2}\left|(1+\lambda \alpha )\boldsymbol{u}^{\prime}_0{^{(s)}}-\alpha \boldsymbol{u}^{\dagger }_0 {^{(s)}} \right|^2 \right \rangle \! .\end{equation}
From this condition, we obtain the quadratic equation
 \begin{equation} \lambda _\pm =\frac {\alpha C_0-2E_0}{2 \alpha E_0} \pm \sqrt { \left ( \frac {-\alpha C_0 +2E_0}{2 \alpha E_0} \right )^2 -\frac {\alpha {{E}_0^{\dagger }}^{(s)} -C_0}{\alpha E_0}},\end{equation}
where $E_0$
and
$E_0$
and ${E_0^{\dagger }}^{(s)}$
are the energies of the direct and adjoint field at
${E_0^{\dagger }}^{(s)}$
are the energies of the direct and adjoint field at $t=0$
, respectively, and
$t=0$
, respectively, and $C_0= \langle \boldsymbol{u}^{\prime}_0{^{(s)}}\boldsymbol{\cdot }\boldsymbol{u}^{\dagger }_0{^{(s)}} \rangle$
. Equation (2.19) yields real solutions for step sizes provided that
$C_0= \langle \boldsymbol{u}^{\prime}_0{^{(s)}}\boldsymbol{\cdot }\boldsymbol{u}^{\dagger }_0{^{(s)}} \rangle$
. Equation (2.19) yields real solutions for step sizes provided that
 \begin{equation} \alpha _{\textit{min}}=-{\left (\frac {E_0^{\dagger }}{E_0}-\frac {C_0^2}{4E_0^2} \right )^{\! -1/2}} \leq \alpha \leq {\left (\frac {E_0^{\dagger }}{E_0}-\frac {C_0^2}{4E_0^2} \right )^{\! -1/2}} = \alpha _{\textit{max}}.\end{equation}
As we seek maxima of $\mathcal{L}$
, we must choose a positive step size of
$\mathcal{L}$
, we must choose a positive step size of $0\lt \alpha \leq \alpha _{\textit{max}}$
. We here determine the step size
$0\lt \alpha \leq \alpha _{\textit{max}}$
. We here determine the step size $\alpha$
with a backtracking line search and choose
$\alpha$
with a backtracking line search and choose $\lambda _+$
, which yields updates close to the previous perturbation (Foures et al. Reference Foures, Caulfield and Schmid2013). First, the initial perturbation is updated according to (2.17) and (2.19) and
$\lambda _+$
, which yields updates close to the previous perturbation (Foures et al. Reference Foures, Caulfield and Schmid2013). First, the initial perturbation is updated according to (2.17) and (2.19) and $\alpha =\alpha _{\textit{max}}$
. If the growth
$\alpha =\alpha _{\textit{max}}$
. If the growth $G$
of the updated perturbation is higher, we proceed with the next adjoint iteration. If it yields a lower
$G$
of the updated perturbation is higher, we proceed with the next adjoint iteration. If it yields a lower $G$
, the step size is halved, a new update is computed and
$G$
, the step size is halved, a new update is computed and $G$
is evaluated again. This procedure is repeated until
$G$
is evaluated again. This procedure is repeated until $G$
is increased or the relative change of the gain drop below a tolerance
$G$
is increased or the relative change of the gain drop below a tolerance
 \begin{equation} \left | \frac {G^{s+1}-G^{s}}{G^{s+1}} \right | \lt 10^{-8}.\end{equation}
2.3. Numerical solution of the direct and adjoint equations
The direct and adjoint equations, are discretised using a Fourier–Galerkin method in the azimuthal and axial directions and high-order finite differences of order six in the radial direction. The $N_r$
radial points are initially located at the Chebyshev collocation points with a subsequent relaxation to locate more points away from the wall. All variables are expressed as
$N_r$
radial points are initially located at the Chebyshev collocation points with a subsequent relaxation to locate more points away from the wall. All variables are expressed as
 \begin{equation} f(r,\theta ,z,t)= {\mathrm{Re}} \left [\sum _{k=-K}^{K} \sum _{m=-M}^{M} \hat {f}_{k,m}(r,t) e^{ik_0kz+im\theta }\right ] \!,\end{equation}
with complex Fourier coefficients $ \hat {f}_{k,m}$
, axial and azimuthal wavenumber
$ \hat {f}_{k,m}$
, axial and azimuthal wavenumber $k$
and
$k$
and $m$
, respectively, and fundamental axial wavenumber
$m$
, respectively, and fundamental axial wavenumber $k_0=2\pi /L_z$
. The resolutions
$k_0=2\pi /L_z$
. The resolutions $(M,K)$
used for the simulations were adapted depending on the Reynolds number and length of the pipe so that the relative energy contained in the smallest axial and azimuthal modes was sufficiently small
$(M,K)$
used for the simulations were adapted depending on the Reynolds number and length of the pipe so that the relative energy contained in the smallest axial and azimuthal modes was sufficiently small
 \begin{align} e_{M}&=\frac {L_z}{2E_0}\sum _{k=-K}^{K} \int _0^1 |\hat {\boldsymbol{u}}^{\prime}_{k,M}|^2 r \ {\rm d}r\lt 10^{-8} , \end{align}
 \begin{align} e_K&=\frac {L_{\theta }}{2E_0}\sum _{k=-M}^{M} \int _0^1 |\hat {\boldsymbol{u}}^{\prime}_{K,m}|^2 r \ {\rm d}r \lt 10^{-8}. \\[9pt] \nonumber \end{align}
A convergence study was performed to determine the necessary radial resolution at a constant Reynolds number of ${\textit{Re}}=4000$
, corresponding to the maximum instantaneous peak Reynolds number considered, and the number of radial points was set to
${\textit{Re}}=4000$
, corresponding to the maximum instantaneous peak Reynolds number considered, and the number of radial points was set to $N_r=64$
if not stated otherwise.
$N_r=64$
if not stated otherwise.
In order to achieve the adjoint looping procedure, we extend the GPU version of the open source pseudo-spectral Navier–Stokes code nsPipe-GPU (Morón et al. Reference Morón and Avila2024), based on the CPU nsPipe code (López et al. Reference López, Feldmann, Rampp, Vela-Martín, Shi and Avila2020). Time integration of the direct and adjoint system is performed using a second-order predictor corrector method with a fixed time step $\Delta t$
. During the correction, the forcing term
$\Delta t$
. During the correction, the forcing term $f_z\boldsymbol{e}_z$
(
$f_z\boldsymbol{e}_z$
( $f_z^{\dagger }\boldsymbol{e}_z$
) is adjusted to satisfy (2.9). The boundary conditions at the wall are imposed using an influence matrix method, following openpipeflow (Willis Reference Willis2017). For more details of the direct solution see López et al. (Reference López, Feldmann, Rampp, Vela-Martín, Shi and Avila2020) and Morón et al. (Reference Morón, Vela-Martín and Avila2024).
$f_z^{\dagger }\boldsymbol{e}_z$
) is adjusted to satisfy (2.9). The boundary conditions at the wall are imposed using an influence matrix method, following openpipeflow (Willis Reference Willis2017). For more details of the direct solution see López et al. (Reference López, Feldmann, Rampp, Vela-Martín, Shi and Avila2020) and Morón et al. (Reference Morón, Vela-Martín and Avila2024).
2.4. Optimal checkpointing schedule
In order to compute the convective term in the backward integration of the adjoint (2.11), the solution of the direct problem $\boldsymbol{u}{'}$
is required at every time step. Hence, from a performance point of view, it is desirable to store all direct fields in the GPU memory. However, due to the limited memory of the GPU, this is generally infeasible and the direct field must be recomputed from checkpoints. Let
$\boldsymbol{u}{'}$
is required at every time step. Hence, from a performance point of view, it is desirable to store all direct fields in the GPU memory. However, due to the limited memory of the GPU, this is generally infeasible and the direct field must be recomputed from checkpoints. Let $N_G$
denote the maximum number of checkpoints that can be stored in memory. Then, the question arises of when velocity fields should be stored in the memory as checkpoints during the forward integration. Griewank & Walther (Reference Griewank and Walther2010) showed that a logarithmic spacing of checkpoints minimises the number of forward time steps necessary to recover all direct fields during the backward integration of the adjoint system. Thereby, checkpoints that are no longer needed, are overwritten and updated during the intermediate forward integrations. Following this procedure, the minimum number of intermediate steps
$N_G$
denote the maximum number of checkpoints that can be stored in memory. Then, the question arises of when velocity fields should be stored in the memory as checkpoints during the forward integration. Griewank & Walther (Reference Griewank and Walther2010) showed that a logarithmic spacing of checkpoints minimises the number of forward time steps necessary to recover all direct fields during the backward integration of the adjoint system. Thereby, checkpoints that are no longer needed, are overwritten and updated during the intermediate forward integrations. Following this procedure, the minimum number of intermediate steps $N_{\textit{rec}}$
to recover all forward fields is
$N_{\textit{rec}}$
to recover all forward fields is
 \begin{equation} N_{\textit{rec}}=SN_{\textit{steps}}-\beta (N_{G}+1,S-1),\end{equation}
where $N_{\textit{steps}}$
is the total number of forward time steps and
$N_{\textit{steps}}$
is the total number of forward time steps and $S$
a unique integer, for which
$S$
a unique integer, for which
 \begin{equation} \beta (N_{G},S-1) \lt N_{\textit{steps}} \leq \beta (N_{G},S),\end{equation}
with
 \begin{equation} \beta (N_{G},S)=\left ( \!\!\!\begin{array}{c} N_{G}+S\\ N_{G} \end{array}\!\!\right ) =\frac {(N_{G}+S)(N_{G}+S-1)\ldots (S+1)}{N_{G}!}.\end{equation}
For large-scale and memory demanding simulations only a small number of memory checkpoints can be stored. Hence, it may become advantageous to additionally store checkpoints to disc. We developed a checkpointing procedure, which combines the optimal logarithmic spacing of memory checkpoints (Griewank & Walther Reference Griewank and Walther2010) with additional checkpoints saved to disc. In this procedure, we first save $N_F$
equispaced fields to disc during the forward integration. Additionally, in the last interval, i.e. between the last checkpoint saved to disc and the end of the forward integration,
$N_F$
equispaced fields to disc during the forward integration. Additionally, in the last interval, i.e. between the last checkpoint saved to disc and the end of the forward integration, $N_G$
memory checkpoints are saved with a logarithmic spacing. Then, during the backward integration of the adjoint equations, the logarithmically spaced memory checkpoints are updated as in Griewank & Walther (Reference Griewank and Walther2010). This procedure is repeated for each intermediate integration between disc checkpoints, until
$N_G$
memory checkpoints are saved with a logarithmic spacing. Then, during the backward integration of the adjoint equations, the logarithmically spaced memory checkpoints are updated as in Griewank & Walther (Reference Griewank and Walther2010). This procedure is repeated for each intermediate integration between disc checkpoints, until $t=0$
is reached. We find the optimal number of file checkpoints,
$t=0$
is reached. We find the optimal number of file checkpoints, $N_F$
, by minimising the total computing time to recover all direct fields
$N_F$
, by minimising the total computing time to recover all direct fields
 \begin{align} \textrm{min} ( T^{\textit{rec}}) = N_{F}T^{{i/o}}+\left \{ (N_F+1)N_{\textit{rec}}-N_{\textit{init}} \right \} T^{\Delta t}, \end{align}
where $T^{{i/o}}$
is the time it takes to read/write a field from/to file and
$T^{{i/o}}$
is the time it takes to read/write a field from/to file and $T^{\Delta t}$
the time it takes to perform a single time step of the forward integration. Here,
$T^{\Delta t}$
the time it takes to perform a single time step of the forward integration. Here, $N_{\textit{init}}$
is the number of time steps between the last file checkpoint and last memory checkpoint and takes into account that the initial set of memory checkpoints is already saved during the initial forward integration. The times
$N_{\textit{init}}$
is the number of time steps between the last file checkpoint and last memory checkpoint and takes into account that the initial set of memory checkpoints is already saved during the initial forward integration. The times $T^{{i/o}}$
and
$T^{{i/o}}$
and $T^{\Delta t}$
depend on the hardware and for a logarithmic spacing the optimal
$T^{\Delta t}$
depend on the hardware and for a logarithmic spacing the optimal $N_{\textit{rec}}$
is given by (2.25). Assuming that the space on disc and thus the number of file checkpoints is not limited, a recycling of file checkpoints, as employed for the memory checkpoints, does not provide any advantage and therefore an equidistant spacing is optimal. As we compute the number of file checkpoints that minimises the recovery time, this strategy maximises the efficiency, i.e. it automatically minimises the run time for a given computer architecture.
$N_{\textit{rec}}$
is given by (2.25). Assuming that the space on disc and thus the number of file checkpoints is not limited, a recycling of file checkpoints, as employed for the memory checkpoints, does not provide any advantage and therefore an equidistant spacing is optimal. As we compute the number of file checkpoints that minimises the recovery time, this strategy maximises the efficiency, i.e. it automatically minimises the run time for a given computer architecture.
2.5. Verifications and parameter choices
In order to validate our code, we reproduced the computations of nonlinear optimal perturbations to laminar steady pipe flow (Pringle et al. Reference Pringle, Willis and Kerswell2012) and linear optimal perturbation in pulsatile pipe flow (Xu et al. Reference Xu, Song and Avila2021). Qualitative and quantitative comparisons and the convergence behaviour of our implementation are detailed in Appendix A.
Throughout this paper, the pipe length is set to $L_z=50$
, to delay the self interaction of axially localised perturbations due to the periodic boundary conditions. We found that
$L_z=50$
, to delay the self interaction of axially localised perturbations due to the periodic boundary conditions. We found that $L_z=50$
is sufficiently long so that the maximum energy amplification of nonlinear optimal perturbations in steady pipe flow is independent of the pipe length, in agreement with Pringle, Willis & Kerswell (Reference Pringle, Willis and Kerswell2015). Given the large number of parameters governing the problem
$L_z=50$
is sufficiently long so that the maximum energy amplification of nonlinear optimal perturbations in steady pipe flow is independent of the pipe length, in agreement with Pringle, Willis & Kerswell (Reference Pringle, Willis and Kerswell2015). Given the large number of parameters governing the problem $(\textit{Re},\textit{Wo},A,\tau _0,E_0)$
and the computational cost of nonlinear optimisations, we compute optimal perturbations for selected parameter combinations and various
$(\textit{Re},\textit{Wo},A,\tau _0,E_0)$
and the computational cost of nonlinear optimisations, we compute optimal perturbations for selected parameter combinations and various $E_0$
. Based on linear transient growth analysis (Xu et al. Reference Xu, Song and Avila2021), linear optimal perturbations are either classical or helical perturbations, depending on
$E_0$
. Based on linear transient growth analysis (Xu et al. Reference Xu, Song and Avila2021), linear optimal perturbations are either classical or helical perturbations, depending on $(\textit{Wo},A,\tau _0)$
. Here, we consider representative cases from the three characteristic regimes of pulsatile pipe flow and analyse the influence of the initial perturbation energy and nonlinear effects.
$(\textit{Wo},A,\tau _0)$
. Here, we consider representative cases from the three characteristic regimes of pulsatile pipe flow and analyse the influence of the initial perturbation energy and nonlinear effects.
In addition to the pulsation and perturbation parameters $(\textit{Re},\textit{Wo},A,\tau _0,E_0)$
, one must also specify the optimisation time
$(\textit{Re},\textit{Wo},A,\tau _0,E_0)$
, one must also specify the optimisation time $\tau$
, see (2.3). In the linear regime, i.e. at small
$\tau$
, see (2.3). In the linear regime, i.e. at small $E_0$
, the time of maximum amplification
$E_0$
, the time of maximum amplification $\tau ^{(\textit{lin}.)}$
is well known (Pier & Schmid Reference Pier and Schmid2021; Xu et al. Reference Xu, Song and Avila2021) and we initially set the optimisation time to
$\tau ^{(\textit{lin}.)}$
is well known (Pier & Schmid Reference Pier and Schmid2021; Xu et al. Reference Xu, Song and Avila2021) and we initially set the optimisation time to $\tau =\tau ^{(\textit{lin}.)}$
. In the nonlinear regime we perform optimisations at selected
$\tau =\tau ^{(\textit{lin}.)}$
. In the nonlinear regime we perform optimisations at selected $\tau$
and observe that the maximum energy amplification is usually reached near
$\tau$
and observe that the maximum energy amplification is usually reached near $\tau ^{(\textit{lin}.)}$
. The structure of computed optimal perturbations is qualitatively robust in a certain range of
$\tau ^{(\textit{lin}.)}$
. The structure of computed optimal perturbations is qualitatively robust in a certain range of $\tau$
and they show only small deviations in their maximum amplification. If
$\tau$
and they show only small deviations in their maximum amplification. If $\tau$
is too short, optimal perturbations are characterised by the Orr mechanism and multiple streamwise vortices that quickly lift up fluid from the near-wall regions to form high- and low-speed streaks. These perturbations grow rapidly, but reach a smaller amplification due to their relatively large wavenumbers. For too long optimisation times, optimal perturbations decay slowly and are characterised by low wavenumbers.
$\tau$
is too short, optimal perturbations are characterised by the Orr mechanism and multiple streamwise vortices that quickly lift up fluid from the near-wall regions to form high- and low-speed streaks. These perturbations grow rapidly, but reach a smaller amplification due to their relatively large wavenumbers. For too long optimisation times, optimal perturbations decay slowly and are characterised by low wavenumbers.
To verify the robustness of our results, we initialised selected optimisations with different initial guesses: (i) a rescaled turbulent field from a DNS of steady pipe flow at ${\textit{Re}}=3000$
, (ii) a helical perturbation with prescribed azimuthal velocity
${\textit{Re}}=3000$
, (ii) a helical perturbation with prescribed azimuthal velocity
 \begin{equation} u_\theta (r,\theta )=(1-r^2)r^4\cos (4\pi r + \theta ) ;\end{equation}
(continuity was enforced in the first time step) and (iii) a nonlinear optimal of steady pipe flow at ${\textit{Re}}=2400$
. For sufficiently small energies
${\textit{Re}}=2400$
. For sufficiently small energies $E_0$
, the different initial conditions lead to the same well-known linear optimal perturbations and for sufficiently large initial energies, to identical nonlinear optimal perturbations. However, for initial energies, for which the nonlinear and linear optimal perturbations experience a similar growth, the results can depend on the initial guess and we either obtained the linear or nonlinear optimal perturbation.
$E_0$
, the different initial conditions lead to the same well-known linear optimal perturbations and for sufficiently large initial energies, to identical nonlinear optimal perturbations. However, for initial energies, for which the nonlinear and linear optimal perturbations experience a similar growth, the results can depend on the initial guess and we either obtained the linear or nonlinear optimal perturbation.
3. Linear optima in the nonlinear regime
The linear transient growth analysis of Xu et al. (Reference Xu, Song and Avila2021) showed that helical perturbations with azimuthal wavenumber $m=\pm 1$
are optimal in the deceleration phase. In the linear regime, Fourier modes evolve independently of each other, so any linear combination of two identical perturbations with opposite
$m=\pm 1$
are optimal in the deceleration phase. In the linear regime, Fourier modes evolve independently of each other, so any linear combination of two identical perturbations with opposite $m$
reaches the same amplification. However, at finite perturbation energies, Fourier modes interact nonlinearly and accordingly the growth may depend on the relative energetic contribution of the two helical components,
$m$
reaches the same amplification. However, at finite perturbation energies, Fourier modes interact nonlinearly and accordingly the growth may depend on the relative energetic contribution of the two helical components, $m=\pm 1$
. We first considered the nonlinear evolution of linear optimal perturbations introduced during the deceleration phase (
$m=\pm 1$
. We first considered the nonlinear evolution of linear optimal perturbations introduced during the deceleration phase ( $\tau _0=T/2$
) and scaled to finite energies. We set the parameters to
$\tau _0=T/2$
) and scaled to finite energies. We set the parameters to $(\textit{Re},\textit{Wo},A)=(2200,5.6,0.85)$
, as in the experiments of Xu et al. (Reference Xu, Varshney, Ma, Song, Riedl, Avila and Hof2020). At low initial energies (
$(\textit{Re},\textit{Wo},A)=(2200,5.6,0.85)$
, as in the experiments of Xu et al. (Reference Xu, Varshney, Ma, Song, Riedl, Avila and Hof2020). At low initial energies ( $E_0=10^{-20}$
), we found that any linear combination of two optimal helical perturbations with modes
$E_0=10^{-20}$
), we found that any linear combination of two optimal helical perturbations with modes $(m,k)=(\pm 1,8)$
follows the same evolution (compare the black lines in figures 1
$(m,k)=(\pm 1,8)$
follows the same evolution (compare the black lines in figures 1 $a$
and 2
$a$
and 2 $a$
) as expected in the linear regime.
$a$
) as expected in the linear regime.

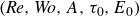
Figure 1. $(a)$
Growth
$(a)$
Growth $G$
(
$G$
(![]() ) of the linear optimal helical perturbation rescaled to
) of the linear optimal helical perturbation rescaled to $E_0=2.5\boldsymbol{\cdot }10^{-7}$
, further decomposed into the energy growth in the axial
$E_0=2.5\boldsymbol{\cdot }10^{-7}$
, further decomposed into the energy growth in the axial $G_{z}$
(
$G_{z}$
(![]() ) and cross-sectional components
) and cross-sectional components $G_{r,\theta }$
(
$G_{r,\theta }$
(![]() ), together with the linear optimal (
), together with the linear optimal ( $E_0=10^{-20}$
).
$E_0=10^{-20}$
). $(b)$
Growth of selected Fourier modes of the rescaled helical wave with the overall growth as a reference.
$(b)$
Growth of selected Fourier modes of the rescaled helical wave with the overall growth as a reference. $(c)$
Isocontours of
$(c)$
Isocontours of $u_z=\pm 6\boldsymbol{\cdot }10^{-3}$
and colour maps of the axial velocity in the range
$u_z=\pm 6\boldsymbol{\cdot }10^{-3}$
and colour maps of the axial velocity in the range $u_z\in (-10^{-1},10^{-1})$
, with quivers of the cross-sectional velocities
$u_z\in (-10^{-1},10^{-1})$
, with quivers of the cross-sectional velocities $(u_r,u_\theta )$
at selected times throughout the period. Due to the significantly lower initial energy, at
$(u_r,u_\theta )$
at selected times throughout the period. Due to the significantly lower initial energy, at $t=0$
, the isocontour limits are
$t=0$
, the isocontour limits are $u_z=\pm 6\boldsymbol{\cdot }10^{-5}$
and the contour limits are
$u_z=\pm 6\boldsymbol{\cdot }10^{-5}$
and the contour limits are $u_z\in (-2.5 \boldsymbol{\cdot }10^{-3},2.5 \boldsymbol{\cdot }10^{-3})$
. The flow is from left to right and the resolution is set to
$u_z\in (-2.5 \boldsymbol{\cdot }10^{-3},2.5 \boldsymbol{\cdot }10^{-3})$
. The flow is from left to right and the resolution is set to $(N_r,M,K)=(64,40,181)$
.
$(N_r,M,K)=(64,40,181)$
.
The blue solid line in figure 1 depicts the temporal evolution of the energy growth of the optimal helical perturbation with $(m,k)=(-1,8)$
scaled to
$(m,k)=(-1,8)$
scaled to $E_0=2.5\boldsymbol{\cdot }10^{-7}$
. For
$E_0=2.5\boldsymbol{\cdot }10^{-7}$
. For $t-\tau _0\lesssim 0.5$
, the energy growth is nearly identical to the linear case, i.e. the perturbation experiences a strong initial boost via the Orr mechanism, followed by an exponential growth due to the instantaneous linear instability of the laminar profile (Morón et al. Reference Morón, Feldmann and Avila2022). As seen in figure 1(
$t-\tau _0\lesssim 0.5$
, the energy growth is nearly identical to the linear case, i.e. the perturbation experiences a strong initial boost via the Orr mechanism, followed by an exponential growth due to the instantaneous linear instability of the laminar profile (Morón et al. Reference Morón, Feldmann and Avila2022). As seen in figure 1( $a$
), approximately the same maximum growth (
$a$
), approximately the same maximum growth ( $G_{\textit{max}}\approx 3.16\boldsymbol{\cdot }10^4$
at
$G_{\textit{max}}\approx 3.16\boldsymbol{\cdot }10^4$
at $t-\tau _0=0.38T$
) as in the linear regime is achieved.
$t-\tau _0=0.38T$
) as in the linear regime is achieved.
As shown in figure 1( $b$
), the growth of the
$b$
), the growth of the $(m,k)=(-1,8)$
mode abruptly ends in the acceleration phase, when the inflection point of the laminar profile disappears. However, it nonlinearly interacts with itself and in secondary interactions transfers energy into the
$(m,k)=(-1,8)$
mode abruptly ends in the acceleration phase, when the inflection point of the laminar profile disappears. However, it nonlinearly interacts with itself and in secondary interactions transfers energy into the $(m,k)=(0,0)$
mode thereby modifying the spatially averaged flow profile. This helical perturbation can not leverage nonlinearities to boost its energy growth because its helical cross-flow vortices are aligned with the helical axial high- and low-speed layers (see snapshots in figure 1). As a consequence, the lift-up effect is not efficient.
$(m,k)=(0,0)$
mode thereby modifying the spatially averaged flow profile. This helical perturbation can not leverage nonlinearities to boost its energy growth because its helical cross-flow vortices are aligned with the helical axial high- and low-speed layers (see snapshots in figure 1). As a consequence, the lift-up effect is not efficient.
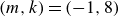
In figure 2, we show the evolution of a reflection-symmetric pair of oblique perturbations with an equal contribution of the linear optimal helical modes $(m,k)=(\pm 1,8)$
. Similarly to the helical perturbation, the oblique perturbation first leverages the Orr mechanism and then grows exponentially due to the instantaneous linear instability of the base flow (Morón et al. Reference Morón, Feldmann and Avila2022). During the acceleration phase (after
$(m,k)=(\pm 1,8)$
. Similarly to the helical perturbation, the oblique perturbation first leverages the Orr mechanism and then grows exponentially due to the instantaneous linear instability of the base flow (Morón et al. Reference Morón, Feldmann and Avila2022). During the acceleration phase (after $t-\tau _0\approx 0.38T$
), the modes
$t-\tau _0\approx 0.38T$
), the modes $(m,k)=(\pm 1,8)$
rapidly decay, however, by nonlinear interaction in their exponential growth phase they efficiently transfer energy into the modes
$(m,k)=(\pm 1,8)$
rapidly decay, however, by nonlinear interaction in their exponential growth phase they efficiently transfer energy into the modes $(m,k)=(\pm 2,0)$
, which then continue to grow in the acceleration phase.
$(m,k)=(\pm 2,0)$
, which then continue to grow in the acceleration phase.

Figure 2. Same as in figure 1 for an oblique perturbation consisting of the superposition of optimal helical perturbations $(m,k)=(\pm 1,8)$
.
$(m,k)=(\pm 1,8)$
.
In the flow fields in figure 2( $c$
), this energy transfer is reflected by the radial convection of the axial velocity layers. In contrast to the linear case, radial velocities are now sufficiently large to convect these layers in the cross-section. Specifically, the initial pair of axial velocity layers is split by two pairs of counterrotating cross-flow vortices, which convect high momentum fluid from the centre of the nearly parabolic base flow to the near-wall regions and low momentum fluid from the near-wall base flow to the central regions. After
$c$
), this energy transfer is reflected by the radial convection of the axial velocity layers. In contrast to the linear case, radial velocities are now sufficiently large to convect these layers in the cross-section. Specifically, the initial pair of axial velocity layers is split by two pairs of counterrotating cross-flow vortices, which convect high momentum fluid from the centre of the nearly parabolic base flow to the near-wall regions and low momentum fluid from the near-wall base flow to the central regions. After $t-\tau _0\approx T/2$
, solely the axial velocity component grows at the expense of the cross-sectional components (see figure 2
$t-\tau _0\approx T/2$
, solely the axial velocity component grows at the expense of the cross-sectional components (see figure 2 $a$
). This is characteristic of the lift-up effect, i.e. the perturbation extracts energy from the base flow via the term
$a$
). This is characteristic of the lift-up effect, i.e. the perturbation extracts energy from the base flow via the term $u_r( \partial U_z/ \partial r)$
and further grows during the acceleration phase. The streaks remain stable and after the lift-up mechanism comes to an end at approximately
$u_r( \partial U_z/ \partial r)$
and further grows during the acceleration phase. The streaks remain stable and after the lift-up mechanism comes to an end at approximately $t-\tau _0\approx 0.685T$
, resulting in
$t-\tau _0\approx 0.685T$
, resulting in $G_{\textit{max}}\approx 7.08\boldsymbol{\cdot }10^{5}$
, the perturbation decays viscously and transition does not occur.
$G_{\textit{max}}\approx 7.08\boldsymbol{\cdot }10^{5}$
, the perturbation decays viscously and transition does not occur.
In summary, rescaled linear optimal perturbations initially grow by the same mechanisms as in the linear regime, i.e. the Orr mechanism followed by an exponential growth due to the instantaneous linear instability of the pulsatile base flow (Xu et al. Reference Xu, Song and Avila2021; Morón et al. Reference Morón, Feldmann and Avila2022). While helical perturbations cannot exploit nonlinearities to experience a higher energy amplification, the strong nonlinear interaction of a symmetric pair of helical perturbations transfers a sufficient amount of energy into the $(\pm 2,0)$
modes, which allows for a further growth during the acceleration phase via the lift-up effect. This oblique wave mechanism is well known to produce a large transient (Schmid & Henningson Reference Schmid and Henningson1992) and is a hallmark of nonlinear optimal perturbations in other shear flows (Cherubini et al. Reference Cherubini, De Palma, Robinet and Bottaro2011; Pringle et al. Reference Pringle, Willis and Kerswell2012; Duguet et al. Reference Duguet, Monokrousos, Brandt and Henningson2013).
$(\pm 2,0)$
modes, which allows for a further growth during the acceleration phase via the lift-up effect. This oblique wave mechanism is well known to produce a large transient (Schmid & Henningson Reference Schmid and Henningson1992) and is a hallmark of nonlinear optimal perturbations in other shear flows (Cherubini et al. Reference Cherubini, De Palma, Robinet and Bottaro2011; Pringle et al. Reference Pringle, Willis and Kerswell2012; Duguet et al. Reference Duguet, Monokrousos, Brandt and Henningson2013).
4. Nonlinear optimal perturbation in pulsatile pipe flow
In this section, we present the results of our nonlinear non-modal stability analysis. In § 4.1, we compute the nonlinear optimal perturbation for the same configuration as in the proceeding section. Subsequently, we study the effect of the initial energy (§ 4.2), the perturbation time (§ 4.3) and the flow parameters (§ 4.4). Finally, we discuss the spatio-temporal dynamics of pulsatile turbulence triggered by minimal seeds at different pulsation parameters (§ 4.5).
4.1. Nonlinear optimal perturbation in the deceleration phase
We introduced perturbations with initial energy $E_0=2.5 \boldsymbol{\cdot }10^{-7}$
at time
$E_0=2.5 \boldsymbol{\cdot }10^{-7}$
at time $\tau _0=T/2$
and optimised their energy growth at the final time
$\tau _0=T/2$
and optimised their energy growth at the final time $t_f=\tau _0+\tau =T$
. In figure 3(
$t_f=\tau _0+\tau =T$
. In figure 3( $a$
), we show the energy growth of the nonlinear optimal perturbation (NLOP) together with selected snapshots of its axial velocity field figure 3(
$a$
), we show the energy growth of the nonlinear optimal perturbation (NLOP) together with selected snapshots of its axial velocity field figure 3( $b$
). For our three initial guesses (see § 2.5), the optimisation procedure converged to the same symmetric oblique perturbation with an equal contribution of the azimuthal modes
$b$
). For our three initial guesses (see § 2.5), the optimisation procedure converged to the same symmetric oblique perturbation with an equal contribution of the azimuthal modes $m=\pm 1$
and localised along the pipe (see figure 3
$m=\pm 1$
and localised along the pipe (see figure 3 $c$
). In the spectra, this is characterised by the distribution of energy into several axial modes. Specifically,
$c$
). In the spectra, this is characterised by the distribution of energy into several axial modes. Specifically, $95\,\%$
of the energy is initially contained in the axial modes
$95\,\%$
of the energy is initially contained in the axial modes $k\in (6,10)$
. Since the energy is now distributed in a large number of axial modes that interact with each other, nonlinearities transfer energy into many more modes. However, most of the energy is transferred into the modes
$k\in (6,10)$
. Since the energy is now distributed in a large number of axial modes that interact with each other, nonlinearities transfer energy into many more modes. However, most of the energy is transferred into the modes $m=\pm 2$
with
$m=\pm 2$
with $k\in (0,4)$
(see figure 3
$k\in (0,4)$
(see figure 3 $b$
).
$b$
).

Figure 3. $(a)$
Growth
$(a)$
Growth $G$
(
$G$
(![]() ) of the NLOP for
) of the NLOP for $(\textit{Re},\textit{Wo},A,\tau _0,\tau )=(2200,5.6,0.85,T/2,T/2)$
with initial energy
$(\textit{Re},\textit{Wo},A,\tau _0,\tau )=(2200,5.6,0.85,T/2,T/2)$
with initial energy $E_0=2.5\boldsymbol{\cdot }10^{-7}$
, and its axial
$E_0=2.5\boldsymbol{\cdot }10^{-7}$
, and its axial $G_{z}$
(
$G_{z}$
(![]() ) and cross-sectional components
) and cross-sectional components $G_{r,\theta }$
(
$G_{r,\theta }$
(![]() ).
). $(b)$
Growth of selected modes with the total growth as a reference. For the azimuthal modes
$(b)$
Growth of selected modes with the total growth as a reference. For the azimuthal modes $m=\pm 1$
we consider the axial modes
$m=\pm 1$
we consider the axial modes $k\in (7,8,9)$
and for
$k\in (7,8,9)$
and for $m=0$
and
$m=0$
and $m=\pm 2$
we consider
$m=\pm 2$
we consider $k\in (0,1,2)$
which contain most of the perturbation energy.
$k\in (0,1,2)$
which contain most of the perturbation energy. $(c)$
Isocontours of
$(c)$
Isocontours of $u_z=\pm 0.4u_z^{\textit{max}}$
(black and white) and
$u_z=\pm 0.4u_z^{\textit{max}}$
(black and white) and $\omega _z=\pm 0.4 \omega _z^{max }$
(blue and orange). The flow is from left to right and the resolution was set to
$\omega _z=\pm 0.4 \omega _z^{max }$
(blue and orange). The flow is from left to right and the resolution was set to $(N_r,M,K)=(64,40,181)$
.
$(N_r,M,K)=(64,40,181)$
.
Qualitatively, this NLOP grows by the same mechanisms as the linearly optimal symmetric oblique perturbation, shown in figure 2: $(i)$
initial energy boost by the Orr mechanism until
$(i)$
initial energy boost by the Orr mechanism until $t-\tau _0\approx 0.05$
,
$t-\tau _0\approx 0.05$
, $(\textit{ii})$
exponential growth of various linearly unstable modes with azimuthal wavenumbers
$(\textit{ii})$
exponential growth of various linearly unstable modes with azimuthal wavenumbers $m=\pm 1$
(see figure 3
$m=\pm 1$
(see figure 3 $b$
) until approximately
$b$
) until approximately $t-\tau _0\approx 0.4$
,
$t-\tau _0\approx 0.4$
, $(\textit{iii})$
simultaneous nonlinear interaction of symmetric pairs of oblique modes transferring energy into
$(\textit{iii})$
simultaneous nonlinear interaction of symmetric pairs of oblique modes transferring energy into $m=\pm 2$
of lower axial wavenumber and
$m=\pm 2$
of lower axial wavenumber and $(\textit{i}v)$
streak formation due to the lift-up effect. Due to the axial localisation, the amplitude of the NLOP is locally much higher and results in stronger cross-flow vortices (compare the dotted lines in figures 2
$(\textit{i}v)$
streak formation due to the lift-up effect. Due to the axial localisation, the amplitude of the NLOP is locally much higher and results in stronger cross-flow vortices (compare the dotted lines in figures 2 $a$
and 3
$a$
and 3 $a$
). This enhances and extends the lift-up phase and ultimately leads to higher growth of the NLOP (
$a$
). This enhances and extends the lift-up phase and ultimately leads to higher growth of the NLOP ( $G^{\textit{max}}\approx 1.34\boldsymbol{\cdot }10^6$
compared with
$G^{\textit{max}}\approx 1.34\boldsymbol{\cdot }10^6$
compared with $G^{\textit{max}}\approx 0.708\boldsymbol{\cdot }10^6$
for the rescaled symmetric linear optimal). In figure 3(
$G^{\textit{max}}\approx 0.708\boldsymbol{\cdot }10^6$
for the rescaled symmetric linear optimal). In figure 3( $b$
) the stronger effect of nonlinearities is reflected in an earlier and increased growth of the azimuthal modes
$b$
) the stronger effect of nonlinearities is reflected in an earlier and increased growth of the azimuthal modes $m=(0,\pm 2)$
.
$m=(0,\pm 2)$
.
This behaviour is qualitatively similar to NLOPs in other shear flows, which leverage the same combination of the Orr mechanism, oblique wave interaction and lift-up mechanism, while localising in space in order to enhance the effect of nonlinearities (Cherubini et al. Reference Cherubini, De Palma, Robinet and Bottaro2011; Pringle et al. Reference Pringle, Willis and Kerswell2012; Duguet et al. Reference Duguet, Monokrousos, Brandt and Henningson2013). A noteworthy difference, however, is that the NLOP in pulsatile flow exploits the inflection points of the flow profile to significantly exceed the growth of optimal perturbations in steady flows.
4.2. Effect of the initial energy
We performed additional optimisations at various initial energies $E_0$
and summarise the results in figure 4. For sufficiently low initial energies, we obtained linear optimal perturbations (LOPs) consisting of linear combinations of helical perturbations with
$E_0$
and summarise the results in figure 4. For sufficiently low initial energies, we obtained linear optimal perturbations (LOPs) consisting of linear combinations of helical perturbations with $(m,k)=(\pm 1,8)$
and for which the maximum energy scales linearly with the initial energy
$(m,k)=(\pm 1,8)$
and for which the maximum energy scales linearly with the initial energy $E_{\textit{max}} \propto E_0$
. With increasing
$E_{\textit{max}} \propto E_0$
. With increasing $E_0$
, similar axially localised reflection-symmetric oblique perturbation were found to be optimal, as discussed in § 4.1. They further localise axially to locally enhance nonlinearities and significantly outgrow LOPs with an extended lift-up phase. For
$E_0$
, similar axially localised reflection-symmetric oblique perturbation were found to be optimal, as discussed in § 4.1. They further localise axially to locally enhance nonlinearities and significantly outgrow LOPs with an extended lift-up phase. For $E_0 \gtrsim 2.5\boldsymbol{\cdot }10^{-7}$
, the streak amplitude saturates due to a combination of strong nonlinearities and a very low minimum Reynolds number of
$E_0 \gtrsim 2.5\boldsymbol{\cdot }10^{-7}$
, the streak amplitude saturates due to a combination of strong nonlinearities and a very low minimum Reynolds number of ${\textit{Re}}_{\textit{min}}=330$
at the end of the deceleration phase. First, the nonlinear term shifts energy into large wavenumber modes, which rapidly dissipate it due to the low instantaneous Reynolds number. Second, the spatially averaged velocity profile is flattened, as nonlinearities transfer energy into
${\textit{Re}}_{\textit{min}}=330$
at the end of the deceleration phase. First, the nonlinear term shifts energy into large wavenumber modes, which rapidly dissipate it due to the low instantaneous Reynolds number. Second, the spatially averaged velocity profile is flattened, as nonlinearities transfer energy into $(m,k)=(0,0)$
and the production
$(m,k)=(0,0)$
and the production $P=u_ru_z (\partial U_z/\partial r)$
is diminished as a result. When the instantaneous Reynolds number is sufficiently large again, the flow is almost streamwise independent and the residual fluctuations do not suffice to destabilise the flow. Due to nonlinear saturation of the streak amplitude, adding more energy locally does not increase the maximum achieved energy. This introduces an opposed trend regarding the localisation: the optimisation procedure now starts to distribute the energy along the pipe without locally exceeding the amplitude threshold leading to streak saturation. Finally, at
$P=u_ru_z (\partial U_z/\partial r)$
is diminished as a result. When the instantaneous Reynolds number is sufficiently large again, the flow is almost streamwise independent and the residual fluctuations do not suffice to destabilise the flow. Due to nonlinear saturation of the streak amplitude, adding more energy locally does not increase the maximum achieved energy. This introduces an opposed trend regarding the localisation: the optimisation procedure now starts to distribute the energy along the pipe without locally exceeding the amplitude threshold leading to streak saturation. Finally, at $E_0\approx 4\boldsymbol{\cdot }10^{-7}$
, the maximum growth is achieved by symmetric oblique perturbation filling the entire pipe (see figure 4
$E_0\approx 4\boldsymbol{\cdot }10^{-7}$
, the maximum growth is achieved by symmetric oblique perturbation filling the entire pipe (see figure 4 $c$
). Further increasing the energy no longer leads to larger growth as the saturation limit is reached in the entire pipe and no turbulence is triggered. In this regime, the optimisation procedure failed, as the objective function is locally flat and various initial conditions lead to the same maximum energy. The optimisation procedure returned perturbations that reach the saturation energy at
$c$
). Further increasing the energy no longer leads to larger growth as the saturation limit is reached in the entire pipe and no turbulence is triggered. In this regime, the optimisation procedure failed, as the objective function is locally flat and various initial conditions lead to the same maximum energy. The optimisation procedure returned perturbations that reach the saturation energy at $t=\tau _0+\tau$
and consist of a combination of the initial guess and the NLOP. In figure 4
$t=\tau _0+\tau$
and consist of a combination of the initial guess and the NLOP. In figure 4 $d$
, we show the result of an optimisation initialised with the NLOP of steady pipe flow. This perturbation features characteristics of the oblique pattern superposed to the structure of the initial guess.
$d$
, we show the result of an optimisation initialised with the NLOP of steady pipe flow. This perturbation features characteristics of the oblique pattern superposed to the structure of the initial guess.

Figure 4. The achieved maximum absolute energy $E_{\textit{max}}$
of the optimal perturbation at different initial energies
$E_{\textit{max}}$
of the optimal perturbation at different initial energies $E_0$
. Solid and dashed lines depict the optimal energy growth for an optimisation times of
$E_0$
. Solid and dashed lines depict the optimal energy growth for an optimisation times of $\tau =T/2$
and
$\tau =T/2$
and $\tau =T/10$
, respectively. Shaded areas indicate the regime of LOPs, localised symmetric oblique perturbations (NLOP), the non-turbulent saturation regime (Saturation) and the turbulent regime (Turb.).
$\tau =T/10$
, respectively. Shaded areas indicate the regime of LOPs, localised symmetric oblique perturbations (NLOP), the non-turbulent saturation regime (Saturation) and the turbulent regime (Turb.). $(a){-}(f)$
Depict characteristic optimal perturbations in the different regimes.
$(a){-}(f)$
Depict characteristic optimal perturbations in the different regimes.
The only way that a perturbation introduced at $\tau _0=T/2$
can cause turbulence at these parameters is to grow extremely fast and trigger strong nonlinearities before viscous effects quickly act during the low Reynolds number phase. We show this by performing additional computations with a short optimisation time of
$\tau _0=T/2$
can cause turbulence at these parameters is to grow extremely fast and trigger strong nonlinearities before viscous effects quickly act during the low Reynolds number phase. We show this by performing additional computations with a short optimisation time of $\tau =T/10$
. Here, NLOPs further localise in the axial and azimuthal directions and are characterised by four cross-sectional vortices (compare figures 4
$\tau =T/10$
. Here, NLOPs further localise in the axial and azimuthal directions and are characterised by four cross-sectional vortices (compare figures 4 $b$
and 4
$b$
and 4 $e$
). They combine the Orr and lift-up mechanisms from the beginning to grow much faster. At small to moderate
$e$
). They combine the Orr and lift-up mechanisms from the beginning to grow much faster. At small to moderate $E_0$
, their maximum growth is smaller than optimal for
$E_0$
, their maximum growth is smaller than optimal for $\tau =T/2$
(see figure 4). However, at sufficiently large
$\tau =T/2$
(see figure 4). However, at sufficiently large $E_0$
(see figure 4
$E_0$
(see figure 4 $f$
), they are able to trigger a turbulent puff. This puff quickly decays during the low Reynolds number phase, in agreement with the experimental and numerical observations by Xu et al. (Reference Xu, Warnecke, Song, Ma and Hof2017), Xu & Avila (Reference Xu and Avila2018). The dynamics of transition and decay is illustrated in figure 5.
$f$
), they are able to trigger a turbulent puff. This puff quickly decays during the low Reynolds number phase, in agreement with the experimental and numerical observations by Xu et al. (Reference Xu, Warnecke, Song, Ma and Hof2017), Xu & Avila (Reference Xu and Avila2018). The dynamics of transition and decay is illustrated in figure 5.

Figure 5. Evolution of the NLOP that first triggers transition at $(\textit{Re},\textit{Wo},A,\tau _0)=(2200,5.6,0.85,T/2)$
. Isocontours of
$(\textit{Re},\textit{Wo},A,\tau _0)=(2200,5.6,0.85,T/2)$
. Isocontours of $u_z=(\pm 0.0015,\pm 0.015)$
(black and white) and
$u_z=(\pm 0.0015,\pm 0.015)$
(black and white) and $\omega _z=(\pm 0.015,\pm 0.15)$
(blue and orange) for
$\omega _z=(\pm 0.015,\pm 0.15)$
(blue and orange) for $t/T=(0.0,0.1)$
, respectively. For
$t/T=(0.0,0.1)$
, respectively. For $t/T\gt 0.1$
isocontour levels are
$t/T\gt 0.1$
isocontour levels are $u_z=\pm 0.15$
(black and white) and
$u_z=\pm 0.15$
(black and white) and $\omega _z=\pm 0.15$
(blue and orange). The flow is from left to right and the resolution was set to
$\omega _z=\pm 0.15$
(blue and orange). The flow is from left to right and the resolution was set to $(N_r,M,K)=(64,40,181)$
.
$(N_r,M,K)=(64,40,181)$
.
In summary, we find that optimal perturbations in the deceleration phase experience a enormous energy growth and lead to strong symmetric flow patterns. Triggering turbulence, however, requires a significantly higher energy ( $E_0\gtrsim 5\boldsymbol{\cdot }10^{-5}$
for the minimal seed for these parameters) due to the small instantaneous Reynolds number.
$E_0\gtrsim 5\boldsymbol{\cdot }10^{-5}$
for the minimal seed for these parameters) due to the small instantaneous Reynolds number.
4.3. Effect of the initial perturbation time
In this section, we analyse the effect of different initial perturbation times $\tau _0$
on the optimal perturbations. For this purpose, we introduced a perturbation at the middle, end and beginning of the acceleration phase,
$\tau _0$
on the optimal perturbations. For this purpose, we introduced a perturbation at the middle, end and beginning of the acceleration phase, $\tau _0=0, \ T/4$
and
$\tau _0=0, \ T/4$
and $3T/4$
, respectively, and computed the optimal perturbation with maximum gain after
$3T/4$
, respectively, and computed the optimal perturbation with maximum gain after $\tau =T/2$
at various initial energies
$\tau =T/2$
at various initial energies $E_0$
.
$E_0$
.

Figure 6. Growth $G$
(
$G$
(![]() ) of the optimal perturbation with initial energy;
) of the optimal perturbation with initial energy; $(a)$
$(a)$ $E_0=1\boldsymbol{\cdot }10^{-10}$
(linear optimum),
$E_0=1\boldsymbol{\cdot }10^{-10}$
(linear optimum), $(b)$
$(b)$ $E_0=1.5\boldsymbol{\cdot }10^{-4}$
(nonlinear optimum) and
$E_0=1.5\boldsymbol{\cdot }10^{-4}$
(nonlinear optimum) and $(c)$
$(c)$ $E_0=2\boldsymbol{\cdot }10^{-4}$
(above the minimal seed), at
$E_0=2\boldsymbol{\cdot }10^{-4}$
(above the minimal seed), at $(\textit{Re},\textit{Wo},A)=(2200,5.6,0.85)$
introduced at
$(\textit{Re},\textit{Wo},A)=(2200,5.6,0.85)$
introduced at $\tau _0=0$
. The total growth rate is further decomposed into the axial component
$\tau _0=0$
. The total growth rate is further decomposed into the axial component $G_z$
(
$G_z$
(![]() ) and the cross-sectional component
) and the cross-sectional component $G_{r,\theta }$
(
$G_{r,\theta }$
(![]() ).
).
For $\tau _0=0$
and sufficiently small initial energies, the optimal perturbation is the classical pair of streamwise vortices, known from steady pipe flow and in line with the results of Xu et al. (Reference Xu, Song and Avila2021). These streamwise vortices induce a pair of axial high- and low-speed streak that reach a maximum growth of
$\tau _0=0$
and sufficiently small initial energies, the optimal perturbation is the classical pair of streamwise vortices, known from steady pipe flow and in line with the results of Xu et al. (Reference Xu, Song and Avila2021). These streamwise vortices induce a pair of axial high- and low-speed streak that reach a maximum growth of $G_{\textit{max}}=247$
at
$G_{\textit{max}}=247$
at $t^*=0.346T$
(see figure 6
$t^*=0.346T$
(see figure 6 $a$
). A nonlinear optimal first emerges at about
$a$
). A nonlinear optimal first emerges at about $E_0=1.5\boldsymbol{\cdot }10^{-4}$
, which is three orders of magnitude higher than in the deceleration phase. This nonlinear optimal reaches a significantly higher maximum growth,
$E_0=1.5\boldsymbol{\cdot }10^{-4}$
, which is three orders of magnitude higher than in the deceleration phase. This nonlinear optimal reaches a significantly higher maximum growth, $G_{\textit{max}}=1183$
at
$G_{\textit{max}}=1183$
at $t^*=0.238T$
(see figure 6
$t^*=0.238T$
(see figure 6 $b$
). As shown in figure 7(
$b$
). As shown in figure 7( $a$
), this nonlinear optimum localises in all directions. It is characterised by high- and low-speed axial velocity layers, tilted against the shear of the base flow as well as two localised counter-rotating vortices close to the wall. Qualitatively, this NLOP is as in steady pipe flow. As in the deceleration phase, the perturbation initially utilises the Orr mechanism to quickly gain energy in the axial and cross-sectional components. Once the axial high- and low-speed layers align with the base flow shear, the cross-sectional vortices induce high- and low-speed streaks due to the lift-up effect (see figure 7
$a$
), this nonlinear optimum localises in all directions. It is characterised by high- and low-speed axial velocity layers, tilted against the shear of the base flow as well as two localised counter-rotating vortices close to the wall. Qualitatively, this NLOP is as in steady pipe flow. As in the deceleration phase, the perturbation initially utilises the Orr mechanism to quickly gain energy in the axial and cross-sectional components. Once the axial high- and low-speed layers align with the base flow shear, the cross-sectional vortices induce high- and low-speed streaks due to the lift-up effect (see figure 7 $b$
). These vortices are localised close the wall, aligning with the large shear of the instantaneous laminar profile. During its growth phase, the perturbation unwraps and forms additional vortices close to the wall. The additional vortices induce an additional pair of low-speed streaks, as show in figure 7(
$b$
). These vortices are localised close the wall, aligning with the large shear of the instantaneous laminar profile. During its growth phase, the perturbation unwraps and forms additional vortices close to the wall. The additional vortices induce an additional pair of low-speed streaks, as show in figure 7( $c{,}d$
), that quickly fills the entire domain. As shown in figure 6(
$c{,}d$
), that quickly fills the entire domain. As shown in figure 6( $b$
), then the cross-sectional energy starts to decrease. For a short time, the axial component of the perturbation keeps growing due to the lift-up effect, before exponentially decaying in the deceleration phase. Even though the shape of the NLOPs in the acceleration phase is very different from NLOPs in the deceleration phase, they leverage the same linear growth mechanisms (Orr and lift-up mechanism) coupled by the nonlinear interaction of oblique modes. The essential difference is that the profile is instantaneously linear stable during the acceleration phase, which leads to a significantly lower energy growth.
$b$
), then the cross-sectional energy starts to decrease. For a short time, the axial component of the perturbation keeps growing due to the lift-up effect, before exponentially decaying in the deceleration phase. Even though the shape of the NLOPs in the acceleration phase is very different from NLOPs in the deceleration phase, they leverage the same linear growth mechanisms (Orr and lift-up mechanism) coupled by the nonlinear interaction of oblique modes. The essential difference is that the profile is instantaneously linear stable during the acceleration phase, which leads to a significantly lower energy growth.

Figure 7. Nonlinear optimal perturbation with initial energy $E_0=1.5\boldsymbol{\cdot }10^{-4}$
, introduced at
$E_0=1.5\boldsymbol{\cdot }10^{-4}$
, introduced at $\tau _0=0$
and optimised to experience a maximum growth at
$\tau _0=0$
and optimised to experience a maximum growth at $t-\tau _0=T/2$
. Isocontours indicate
$t-\tau _0=T/2$
. Isocontours indicate $u_z=\pm 0.4u_z^{\textit{max}}$
(black and white) and
$u_z=\pm 0.4u_z^{\textit{max}}$
(black and white) and $\omega _z=\pm 0.2 \omega _z^{\textit{max}}$
(blue and orange) and the corresponding contours of the axial velocity together with quivers of the cross-sectional flow are located at the axial position of maximum cross-sectionally integrated energy. The flow is from left to right and the resolution was set to
$\omega _z=\pm 0.2 \omega _z^{\textit{max}}$
(blue and orange) and the corresponding contours of the axial velocity together with quivers of the cross-sectional flow are located at the axial position of maximum cross-sectionally integrated energy. The flow is from left to right and the resolution was set to $(N_r,M,K)=(64,40,181)$
.
$(N_r,M,K)=(64,40,181)$
.
For $E_0\geq 2\boldsymbol{\cdot }10^{-4}$
(see figure 6
$E_0\geq 2\boldsymbol{\cdot }10^{-4}$
(see figure 6 $c$
), NLOPs in the acceleration trigger transition to turbulence. The localised streaks become unstable and break down to a turbulent puff shortly after passing the maximum instantaneous Reynolds number. This turbulent puff quickly elongates and fills the entire domain, before collapsing in the deceleration phase. The dynamics is very similar to that reported by Xu & Avila (Reference Xu and Avila2018) (see their figure 4). For the parameter combination considered here, the minimum Reynolds number is too low. Viscous effects dominate during the deceleration phase, turbulence decays and is not retriggered in the following period.
$c$
), NLOPs in the acceleration trigger transition to turbulence. The localised streaks become unstable and break down to a turbulent puff shortly after passing the maximum instantaneous Reynolds number. This turbulent puff quickly elongates and fills the entire domain, before collapsing in the deceleration phase. The dynamics is very similar to that reported by Xu & Avila (Reference Xu and Avila2018) (see their figure 4). For the parameter combination considered here, the minimum Reynolds number is too low. Viscous effects dominate during the deceleration phase, turbulence decays and is not retriggered in the following period.
In figure 8, we summarise the maximum achieved energy $E_{\textit{max}}$
of optimal perturbations computed for different initial energies
$E_{\textit{max}}$
of optimal perturbations computed for different initial energies $E_0$
and different initial times
$E_0$
and different initial times $\tau _0$
, including the two cases discussed above,
$\tau _0$
, including the two cases discussed above, $\tau _0=T/2$
(left-most curve) and
$\tau _0=T/2$
(left-most curve) and $\tau _0=0$
(right-most curve), respectively. We begin by discussing the low energy limit,
$\tau _0=0$
(right-most curve), respectively. We begin by discussing the low energy limit, $E_0 \rightarrow 0$
. When the perturbation is applied at the end of the deceleration phase
$E_0 \rightarrow 0$
. When the perturbation is applied at the end of the deceleration phase $\tau _0=3T/4$
, the laminar profile still features inflection points, however, they quickly disappear during the acceleration. Linear combinations of oblique perturbations are optimal, but they can exploit the instantaneous linear instability for a much shorter time and hence experience a significantly lower growth than when perturbing at
$\tau _0=3T/4$
, the laminar profile still features inflection points, however, they quickly disappear during the acceleration. Linear combinations of oblique perturbations are optimal, but they can exploit the instantaneous linear instability for a much shorter time and hence experience a significantly lower growth than when perturbing at $\tau _0=T/2$
. At the end of the acceleration phase (
$\tau _0=T/2$
. At the end of the acceleration phase ( $\tau _0=T/4$
), the optimal perturbation is the classical pair of streamwise vortices and shows a slightly higher growth than for
$\tau _0=T/4$
), the optimal perturbation is the classical pair of streamwise vortices and shows a slightly higher growth than for $\tau _0=0$
, which is attributed to the higher (peak) instantaneous Reynolds number.
$\tau _0=0$
, which is attributed to the higher (peak) instantaneous Reynolds number.

Figure 8. $(a)$
The maximum achieved energy
$(a)$
The maximum achieved energy $E_{\textit{max}}$
experienced by the optimal perturbation at different initial energies
$E_{\textit{max}}$
experienced by the optimal perturbation at different initial energies $E_0$
. Solid lines refer to the different initial times of
$E_0$
. Solid lines refer to the different initial times of $\tau _0=0$
,
$\tau _0=0$
, $\tau _0=T/4$
,
$\tau _0=T/4$
, $\tau _0=T/2$
and
$\tau _0=T/2$
and $\tau _0=3T/4$
for a fixed optimisation time of
$\tau _0=3T/4$
for a fixed optimisation time of $\tau =T/2$
at
$\tau =T/2$
at $(\textit{Re},\textit{Wo},A)=(2200,5.6,0.85)$
, whereas the dashed line indicates the optimisation results for
$(\textit{Re},\textit{Wo},A)=(2200,5.6,0.85)$
, whereas the dashed line indicates the optimisation results for $\tau =T/10$
.
$\tau =T/10$
. $(b)$
The energy evolution over time of different optima that reach the saturated state with the lowest initial energy
$(b)$
The energy evolution over time of different optima that reach the saturated state with the lowest initial energy $E_0$
for the considered
$E_0$
for the considered $\tau _0$
and
$\tau _0$
and $\tau$
.
$\tau$
.
As $E_0$
increases, the cases
$E_0$
increases, the cases $\tau _0=0$
and
$\tau _0=0$
and $\tau _0=T/4$
follow the same trend, but the growth is higher for
$\tau _0=T/4$
follow the same trend, but the growth is higher for $\tau _0=T/4$
and, accordingly, the minimal seed to trigger transition to turbulence has lower energy.
$\tau _0=T/4$
and, accordingly, the minimal seed to trigger transition to turbulence has lower energy.
The case $\tau _0=3T/4$
shows a more interesting behaviour. For initial energies of
$\tau _0=3T/4$
shows a more interesting behaviour. For initial energies of $\mathcal{O}(E_0)=10^{-6}$
, localised reflection-symmetric oblique perturbations can utilise nonlinearities to achieve an increased growth, as shown earlier for
$\mathcal{O}(E_0)=10^{-6}$
, localised reflection-symmetric oblique perturbations can utilise nonlinearities to achieve an increased growth, as shown earlier for $\tau _0=T/2$
. For
$\tau _0=T/2$
. For $\mathcal{O}(E_0)=10^{-5}$
, the optimal perturbation consists of a combination of the two nonlinear optima observed for
$\mathcal{O}(E_0)=10^{-5}$
, the optimal perturbation consists of a combination of the two nonlinear optima observed for $\tau _0=T/2$
and
$\tau _0=T/2$
and $\tau _0=0$
. This perturbation initially grows exponentially until the inflection points in the laminar profile disappear, however, the streaks generated are susceptible to further growth due to the high instantaneous Reynolds number. For
$\tau _0=0$
. This perturbation initially grows exponentially until the inflection points in the laminar profile disappear, however, the streaks generated are susceptible to further growth due to the high instantaneous Reynolds number. For $E\gtrsim 3 \boldsymbol{\cdot }10^{-5}$
, the steaks are unstable and break down to a turbulent puff, exactly as for
$E\gtrsim 3 \boldsymbol{\cdot }10^{-5}$
, the steaks are unstable and break down to a turbulent puff, exactly as for $\tau _0=0$
and
$\tau _0=0$
and $\tau _0=T/4$
. Hence, turbulence is only observed in the form of puffs, in agreement with Morón & Avila (Reference Morón and Avila2024). Once turbulence is triggered, the maximum achieved energy is independent of the initial time
$\tau _0=T/4$
. Hence, turbulence is only observed in the form of puffs, in agreement with Morón & Avila (Reference Morón and Avila2024). Once turbulence is triggered, the maximum achieved energy is independent of the initial time $\tau _0$
and initial energy
$\tau _0$
and initial energy $E_0$
and is reached at the same time,
$E_0$
and is reached at the same time, $t/T\approx 0.45$
, within a pulsation period (see figure 8
$t/T\approx 0.45$
, within a pulsation period (see figure 8 $b$
), in agreement with the delay between bulk velocity and turbulence intensity reported by Morón & Avila (Reference Morón and Avila2024), see their figure 3(
$b$
), in agreement with the delay between bulk velocity and turbulence intensity reported by Morón & Avila (Reference Morón and Avila2024), see their figure 3( $a$
).
$a$
).
4.4. Effect of pulsation parameters
For the parameter set considered so far, $(\textit{Re},\textit{Wo},A)=(2200,5.6,0.85)$
, NLOPs experience a strong energy amplification, especially during the deceleration phase of the pulsation. However, to trigger a turbulence, a relatively large initial energy
$(\textit{Re},\textit{Wo},A)=(2200,5.6,0.85)$
, NLOPs experience a strong energy amplification, especially during the deceleration phase of the pulsation. However, to trigger a turbulence, a relatively large initial energy $\mathcal{O}(E_0^{\textit{crit}.})=10^{-5}$
is required and turbulence is never sustained due to the long pulsation period and small minimal instantaneous Reynolds number. In the following, we study the effect of the pulsation parameters on the transient amplification for
$\mathcal{O}(E_0^{\textit{crit}.})=10^{-5}$
is required and turbulence is never sustained due to the long pulsation period and small minimal instantaneous Reynolds number. In the following, we study the effect of the pulsation parameters on the transient amplification for $\tau _0=0$
and
$\tau _0=0$
and $\tau _0=T/2$
, which are typical for the two distinct instability routes observed (smaller amplification and transition to turbulence at large
$\tau _0=T/2$
, which are typical for the two distinct instability routes observed (smaller amplification and transition to turbulence at large $E_0$
; higher amplification of symmetric oblique patterns).
$E_0$
; higher amplification of symmetric oblique patterns).

Figure 9. The maximum achieved energy $E_{\textit{max}}$
experienced by the optimal perturbation at different initial energies
$E_{\textit{max}}$
experienced by the optimal perturbation at different initial energies $E_0$
introduced in the acceleration phase
$E_0$
introduced in the acceleration phase $\tau _0=0$ $(a)$
and deceleration phase
$(a)$
and deceleration phase $\tau _0=T/2$ $(b)$
. Different lines refer to different parameter combination
$(b)$
. Different lines refer to different parameter combination $(\textit{Re},\textit{Wo},A)$
.
$(\textit{Re},\textit{Wo},A)$
.
Optimal perturbations introduced during the acceleration phase, $\tau _0=0$
, behave qualitatively similar to steady pipe flow (see figure 9
$\tau _0=0$
, behave qualitatively similar to steady pipe flow (see figure 9 $a$
). However, the specific initial energy that leads to substantial nonlinear effects and turbulence transition slightly depends on the pulsation parameters, specifically on the lengths of the period in convective time units.
$a$
). However, the specific initial energy that leads to substantial nonlinear effects and turbulence transition slightly depends on the pulsation parameters, specifically on the lengths of the period in convective time units.
In the deceleration phase, $\tau _0=T/2$
, optimal perturbations exploit the instantaneous linear instability of the underlying base flow. As the instantaneous linear instability depends on the pulsation parameters, the growth and dynamics of optimal perturbations are also strongly affected by
$\tau _0=T/2$
, optimal perturbations exploit the instantaneous linear instability of the underlying base flow. As the instantaneous linear instability depends on the pulsation parameters, the growth and dynamics of optimal perturbations are also strongly affected by $(\textit{Re},\textit{Wo},A)$
, as reported by Xu et al. (Reference Xu, Song and Avila2021) for the linear case. First, we focus on the effect of the Womersley numbers. For
$(\textit{Re},\textit{Wo},A)$
, as reported by Xu et al. (Reference Xu, Song and Avila2021) for the linear case. First, we focus on the effect of the Womersley numbers. For ${\textit{Wo}}=5.6$
and
${\textit{Wo}}=5.6$
and ${\textit{Wo}}=12$
LOPs experience almost the same energy growth whereas at
${\textit{Wo}}=12$
LOPs experience almost the same energy growth whereas at ${\textit{Wo}}=8$
the growth is approximately two orders of magnitude higher, in agreement with Xu et al. (Reference Xu, Song and Avila2021). Again, NLOPs are axially localised reflection-symmetric oblique perturbations which grow by mechanisms discussed in § 4.1 and further localise in the axial direction with increasing initial energies. As shown in § 4.2, the energy growth of NLOPs for
${\textit{Wo}}=8$
the growth is approximately two orders of magnitude higher, in agreement with Xu et al. (Reference Xu, Song and Avila2021). Again, NLOPs are axially localised reflection-symmetric oblique perturbations which grow by mechanisms discussed in § 4.1 and further localise in the axial direction with increasing initial energies. As shown in § 4.2, the energy growth of NLOPs for ${\textit{Wo}}=5.6$
initially saturates at a non-turbulent state due to a combination of the long pulsation period with a small minimal instantaneous Reynolds number. For
${\textit{Wo}}=5.6$
initially saturates at a non-turbulent state due to a combination of the long pulsation period with a small minimal instantaneous Reynolds number. For ${\textit{Wo}}=8$
and
${\textit{Wo}}=8$
and ${\textit{Wo}}=12$
, the pulsation period is significantly shorter in convective time units. Here, viscous effects do not have enough time to dissipate the energy transferred to large wavenumber modes by nonlinear effects and a turbulent puff is triggered already at
${\textit{Wo}}=12$
, the pulsation period is significantly shorter in convective time units. Here, viscous effects do not have enough time to dissipate the energy transferred to large wavenumber modes by nonlinear effects and a turbulent puff is triggered already at $E_0^{\textit{crit}.}=9 \boldsymbol{\cdot }10^{-9}$
and
$E_0^{\textit{crit}.}=9 \boldsymbol{\cdot }10^{-9}$
and $E_0^{\textit{crit}.}=2 \boldsymbol{\cdot }10^{-7}$
for
$E_0^{\textit{crit}.}=2 \boldsymbol{\cdot }10^{-7}$
for ${\textit{Wo}}=8$
and
${\textit{Wo}}=8$
and ${\textit{Wo}}=12$
, respectively.
${\textit{Wo}}=12$
, respectively.
At higher Womersley numbers, perturbations do not have time to exploit the instantaneous linear instability. Here, linear and nonlinear optima are as in steady pipe flow, relying solely on the Orr and lift-up mechanism. As a consequence, much higher initial energies $\mathcal{O}(E_0)=10^{-6}$
are necessary to leverage nonlinearities and the growth is significantly smaller. For
$\mathcal{O}(E_0)=10^{-6}$
are necessary to leverage nonlinearities and the growth is significantly smaller. For ${\textit{Wo}}=20$
,
${\textit{Wo}}=20$
, $E_0\approx 2\boldsymbol{\cdot }10^{-5}$
is required to trigger transition to turbulence.
$E_0\approx 2\boldsymbol{\cdot }10^{-5}$
is required to trigger transition to turbulence.
For small Womersley numbers, ${\textit{Wo}}=3$
, we found the same LOPs as in steady pipe flow, in agreement with Xu et al. (Reference Xu, Song and Avila2021). By contrast, NLOPs are reflection-symmetric oblique perturbations that localise in the axial and azimuthal directions and leverage short-lived inflection points in the laminar profile. Their growth is several orders of magnitude smaller than for
${\textit{Wo}}=3$
, we found the same LOPs as in steady pipe flow, in agreement with Xu et al. (Reference Xu, Song and Avila2021). By contrast, NLOPs are reflection-symmetric oblique perturbations that localise in the axial and azimuthal directions and leverage short-lived inflection points in the laminar profile. Their growth is several orders of magnitude smaller than for ${\textit{Wo}}=(5.6,8,12)$
. Consequently, significantly higher
${\textit{Wo}}=(5.6,8,12)$
. Consequently, significantly higher $E_0$
is required to trigger transition. For even smaller Womersley numbers, laminar profiles no longer feature inflection points and are instantaneously linearly stable throughout the period. In this quasi-steady regime, NLOPs as in steady pipe flow are expected, but their growth depends on the instantaneous Reynolds number. Similarly, inflection points in the laminar profile disappear for sufficiently small amplitudes and the classical LOP is recovered for
$E_0$
is required to trigger transition. For even smaller Womersley numbers, laminar profiles no longer feature inflection points and are instantaneously linearly stable throughout the period. In this quasi-steady regime, NLOPs as in steady pipe flow are expected, but their growth depends on the instantaneous Reynolds number. Similarly, inflection points in the laminar profile disappear for sufficiently small amplitudes and the classical LOP is recovered for $A \lesssim 0.4$
(Xu et al. Reference Xu, Song and Avila2021). We performed additional optimisations at lower pulsation amplitude, while keeping the maximum Reynolds number approximately constant
$A \lesssim 0.4$
(Xu et al. Reference Xu, Song and Avila2021). We performed additional optimisations at lower pulsation amplitude, while keeping the maximum Reynolds number approximately constant $(\textit{Re},\textit{Wo},A)=(2900,5.6,0.4)$
and also found LOPs as in steady pipe flow, whereas NLOPs are axially and azimuthally localised symmetric oblique perturbations. Despite the higher mean Reynolds number, optimal perturbations at
$(\textit{Re},\textit{Wo},A)=(2900,5.6,0.4)$
and also found LOPs as in steady pipe flow, whereas NLOPs are axially and azimuthally localised symmetric oblique perturbations. Despite the higher mean Reynolds number, optimal perturbations at $A=0.4$
show significantly lower overall growth, which we attribute to the weakening of the inflectional profile and hence to a smaller growth by the instantaneous linear instability.
$A=0.4$
show significantly lower overall growth, which we attribute to the weakening of the inflectional profile and hence to a smaller growth by the instantaneous linear instability.

Figure 10. Space–time diagrams of the cross-sectionally averaged turbulent cross-sectional kinetic energy of minimal seeds in a frame of reference co-moving with the bulk velocity. The left and right columns depict the evolution of optimal perturbations introduced in the acceleration phase $\tau _0=0$
and deceleration phase
$\tau _0=0$
and deceleration phase $\tau _0=T/2$
, respectively. To delay the interaction of puffs/slugs due to the periodic boundary conditions, the pipe length was set to
$\tau _0=T/2$
, respectively. To delay the interaction of puffs/slugs due to the periodic boundary conditions, the pipe length was set to $L_z=200$
with a resolution of
$L_z=200$
with a resolution of $(N_r,M,K)=(96,40,1200)$
.
$(N_r,M,K)=(96,40,1200)$
.
4.5. Turbulence dynamics
We performed DNS for a given parameter set to illustrate the dynamics of turbulence after transition. As initial condition we used the minimal seed, i.e. the optimal perturbation that triggers transition at the lowest $E_0$
. In figure 10, we show space–time diagrams of the cross-sectionally integrated cross-sectional kinetic energy at different parameter combinations in a frame of reference co-moving with the bulk velocity. Once a puff has been triggered, its dynamics is governed by the instantaneous Reynolds number
$E_0$
. In figure 10, we show space–time diagrams of the cross-sectionally integrated cross-sectional kinetic energy at different parameter combinations in a frame of reference co-moving with the bulk velocity. Once a puff has been triggered, its dynamics is governed by the instantaneous Reynolds number ${\textit{Re}}(t)$
of the pulsation (Xu & Avila Reference Xu and Avila2018). For
${\textit{Re}}(t)$
of the pulsation (Xu & Avila Reference Xu and Avila2018). For $(\textit{Re},\textit{Wo},A)=(2200,12,0.85)$
and
$(\textit{Re},\textit{Wo},A)=(2200,12,0.85)$
and $(2200,20,0.85)$
, the phase of instantaneously low
$(2200,20,0.85)$
, the phase of instantaneously low ${\textit{Re}}(t)$
is short. In this high-frequency regime, the puff dynamics is modulated by the pulsation but puffs have neither time to decay nor to split (although splitting would be expected here for sufficiently long time). Although the energetically more efficient transition scenario depends on
${\textit{Re}}(t)$
is short. In this high-frequency regime, the puff dynamics is modulated by the pulsation but puffs have neither time to decay nor to split (although splitting would be expected here for sufficiently long time). Although the energetically more efficient transition scenario depends on $\tau _0$
, once triggered, the turbulence dynamics is independent of
$\tau _0$
, once triggered, the turbulence dynamics is independent of $\tau _0$
and
$\tau _0$
and $E_0$
.
$E_0$
.
As ${\textit{Wo}}$
is decreased, the length of the period increases, and for
${\textit{Wo}}$
is decreased, the length of the period increases, and for ${\textit{Wo}}=8$
, puffs first expand and then decay completely. When the perturbation is applied during the deceleration phase
${\textit{Wo}}=8$
, puffs first expand and then decay completely. When the perturbation is applied during the deceleration phase $\tau _0=T/2$
, puffs emerge during the phase of high instantaneous Reynolds number and decay during the subsequent low Reynolds number phase. Compared with
$\tau _0=T/2$
, puffs emerge during the phase of high instantaneous Reynolds number and decay during the subsequent low Reynolds number phase. Compared with $\tau _0=0$
, transition is not only energetically more favourable, but puffs reach slightly higher turbulent kinetic energies and spread further in the axial direction. A similar trigger-decay sequence is observed for
$\tau _0=0$
, transition is not only energetically more favourable, but puffs reach slightly higher turbulent kinetic energies and spread further in the axial direction. A similar trigger-decay sequence is observed for ${\textit{Wo}}=5.6$
, however, the period is much longer and for both
${\textit{Wo}}=5.6$
, however, the period is much longer and for both $\tau _0=0$
and
$\tau _0=0$
and $\tau _0=T/2$
, puffs decay during the first low Reynolds number phase. Puffs triggered at
$\tau _0=T/2$
, puffs decay during the first low Reynolds number phase. Puffs triggered at $\tau _0=0$
evolve into expanding slugs during the long phase of large instantaneous Reynolds numbers and reach significantly higher amplitudes than for
$\tau _0=0$
evolve into expanding slugs during the long phase of large instantaneous Reynolds numbers and reach significantly higher amplitudes than for $\tau =T/2$
, where puffs decay quickly. When the pulsation amplitude is decreased, while keeping approximately the same
$\tau =T/2$
, where puffs decay quickly. When the pulsation amplitude is decreased, while keeping approximately the same ${\textit{Re}}_{\textit{max}}$
, optimal perturbations trigger strongly expanding slugs during large
${\textit{Re}}_{\textit{max}}$
, optimal perturbations trigger strongly expanding slugs during large ${\textit{Re}}(t)$
. However, because of the higher
${\textit{Re}}(t)$
. However, because of the higher ${\textit{Re}}$
and lower
${\textit{Re}}$
and lower $A$
, the time of low instantaneous
$A$
, the time of low instantaneous ${\textit{Re}}(t)$
is significantly shorter. Puffs survive the low Reynolds number phase and develop into a slug again during the next acceleration phase. From this time on, the dynamics is independent of
${\textit{Re}}(t)$
is significantly shorter. Puffs survive the low Reynolds number phase and develop into a slug again during the next acceleration phase. From this time on, the dynamics is independent of $\tau _0$
and
$\tau _0$
and $E_0$
.
$E_0$
.
5. Conclusion
Our nonlinear stability analysis demonstrates that pulsatile pipe flow at moderate pulsation amplitudes $0.4\lesssim A \lesssim 1$
is subject to two distinct instability routes. During the deceleration phase and at intermediate Womersley numbers, the flow is susceptible to the large growth of oblique perturbations, in agreement with experiments by Xu et al. (Reference Xu, Varshney, Ma, Song, Riedl, Avila and Hof2020) and linear computations and DNS by Morón et al. (Reference Morón, Feldmann and Avila2022). In contrast, during the acceleration phase or at low or high Womersley numbers, NLOPs are similar to those of steady pipe flow (Pringle & Kerswell Reference Pringle and Kerswell2010; Kerswell et al. Reference Kerswell, Pringle and Willis2014).
$0.4\lesssim A \lesssim 1$
is subject to two distinct instability routes. During the deceleration phase and at intermediate Womersley numbers, the flow is susceptible to the large growth of oblique perturbations, in agreement with experiments by Xu et al. (Reference Xu, Varshney, Ma, Song, Riedl, Avila and Hof2020) and linear computations and DNS by Morón et al. (Reference Morón, Feldmann and Avila2022). In contrast, during the acceleration phase or at low or high Womersley numbers, NLOPs are similar to those of steady pipe flow (Pringle & Kerswell Reference Pringle and Kerswell2010; Kerswell et al. Reference Kerswell, Pringle and Willis2014).
We show that at intermediate ${\textit{Wo}}$
, instability is energetically much more favourable in the deceleration phase. The optimal perturbation is axially localised and consists of symmetric pairs of oblique (helical) modes. These NLOPs can grow by up to nine order of magnitude in energy despite the moderate Reynolds numbers considered (
${\textit{Wo}}$
, instability is energetically much more favourable in the deceleration phase. The optimal perturbation is axially localised and consists of symmetric pairs of oblique (helical) modes. These NLOPs can grow by up to nine order of magnitude in energy despite the moderate Reynolds numbers considered ( ${\textit{Re}}=2200, \ Re_{\textit{max}}=4070$
). They exploit nonlinearities to form strong axial streaks due to the lift-up mechanism, after initially leveraging the Orr mechanism and the instantaneous linear instability of the underlying base flow. This perturbation generates regular flow patterns that subsequently decay or break down to turbulence while being advected downstream. Their huge nonlinear growth reported here explains why instability was cyclically observed in the experiments of Xu et al. (Reference Xu, Varshney, Ma, Song, Riedl, Avila and Hof2020). However, they reported flow patterns with a preferred helical direction, whereas here we found that perfectly helical perturbations are nonlinearly suboptimal. Specifically, they are unable to leverage nonlinearities. Our findings are consistent with the DNS of Feldmann et al. (Reference Feldmann, Morón and Avila2020), who observed helical patterns only when their perturbation had a preferred direction, and suggests that the pipe bend used in Xu et al. (Reference Xu, Varshney, Ma, Song, Riedl, Avila and Hof2020) as the perturbation may have broken the azimuthal reflection symmetry of the system.
${\textit{Re}}=2200, \ Re_{\textit{max}}=4070$
). They exploit nonlinearities to form strong axial streaks due to the lift-up mechanism, after initially leveraging the Orr mechanism and the instantaneous linear instability of the underlying base flow. This perturbation generates regular flow patterns that subsequently decay or break down to turbulence while being advected downstream. Their huge nonlinear growth reported here explains why instability was cyclically observed in the experiments of Xu et al. (Reference Xu, Varshney, Ma, Song, Riedl, Avila and Hof2020). However, they reported flow patterns with a preferred helical direction, whereas here we found that perfectly helical perturbations are nonlinearly suboptimal. Specifically, they are unable to leverage nonlinearities. Our findings are consistent with the DNS of Feldmann et al. (Reference Feldmann, Morón and Avila2020), who observed helical patterns only when their perturbation had a preferred direction, and suggests that the pipe bend used in Xu et al. (Reference Xu, Varshney, Ma, Song, Riedl, Avila and Hof2020) as the perturbation may have broken the azimuthal reflection symmetry of the system.
During the acceleration phase or at small or large ${\textit{Wo}}$
, optimal perturbations are similar to those observed in steady pipe flow and require significantly higher initial energies than in the deceleration phase (up to four orders of magnitude more) to exploit nonlinear effects. These perturbations trigger a turbulent puff that then grows into a slug and eventually shrinks and decays depending on the flow parameters.
${\textit{Wo}}$
, optimal perturbations are similar to those observed in steady pipe flow and require significantly higher initial energies than in the deceleration phase (up to four orders of magnitude more) to exploit nonlinear effects. These perturbations trigger a turbulent puff that then grows into a slug and eventually shrinks and decays depending on the flow parameters.
All in all, it can be concluded that pulsatile pipe flow at moderate pulsation amplitudes and Reynolds numbers is extremely prone to transition. At low disturbance levels (and intermediate ${\textit{Wo}}$
), turbulence is triggered during the deceleration phase due to the inflectional laminar profile. If the disturbance level is high, the classical transition scenario as in steady pipe flow prevails and turbulence can also emerge during the acceleration phase. Similarly, the classical scenario is recovered in the quasi-steady and high-frequency limits. Once triggered, turbulence survives if
${\textit{Wo}}$
), turbulence is triggered during the deceleration phase due to the inflectional laminar profile. If the disturbance level is high, the classical transition scenario as in steady pipe flow prevails and turbulence can also emerge during the acceleration phase. Similarly, the classical scenario is recovered in the quasi-steady and high-frequency limits. Once triggered, turbulence survives if ${\textit{Wo}}$
or
${\textit{Wo}}$
or ${\textit{Re}}_{min }$
is high enough (Xu et al. Reference Xu, Warnecke, Song, Ma and Hof2017; Xu & Avila Reference Xu and Avila2018). Otherwise the flow relaminarises and turbulence is retriggered every cycle.
${\textit{Re}}_{min }$
is high enough (Xu et al. Reference Xu, Warnecke, Song, Ma and Hof2017; Xu & Avila Reference Xu and Avila2018). Otherwise the flow relaminarises and turbulence is retriggered every cycle.
We note that the parameter ranges relevant to the large arteries in the human cardiovascular system fall within the regime of intermediate Womersley numbers and high pulsation amplitudes (Quarteroni et al. Reference Quarteroni, Dede, Manzoni and Vergara2019). The blood vessels are vastly more complex than the rigid, smooth and straight pipe investigated here, naturally giving rise to disturbances. We thus suggest that strong nonlinear patterns and turbulence may be more ubiquitous in the cardiovascular system than usually assumed.
Funding
This work was funded by the Deutsche Forschungsgemeinschaft (DFG) in the framework of the research unit FOR 2688 ‘Instabilities, Bifurcations and Migration in Pulsatile Flows’ under grant number 349558021, which is gratefully acknowledged. Further, the authors acknowledge the fruitful discussions with Dr D. Morón.
Deceleration of interest
The authors report no conflict of interest.
Data availability statement
All data are available in Pangaea under https://doi.pangaea.de/10.1594/PANGAEA.987378. The GPU code to perform optimisations and DNS can be obtained in the following Github: https://github.com/Mordered/nsPipe-GPU.git.
Appendix A. Code validation
We validated our implementation of the adjoint looping procedure by computing optimal perturbations in the nonlinear regime of steady pipe flow (Pringle & Kerswell Reference Pringle and Kerswell2010; Pringle et al. Reference Pringle, Willis and Kerswell2012) and in the linear regime of pulsatile pipe flow (Xu et al. Reference Xu, Song and Avila2021).

Figure 11. The evolution of the growth rate $G$
at the optimisation time
$G$
at the optimisation time $t=\tau$
over the adjoint iteration
$t=\tau$
over the adjoint iteration $(a)$
, together with the relative incremental growth rate change
$(a)$
, together with the relative incremental growth rate change $\mathcal{R}=|(G^{s+1}-G^{s})/G^{s+1}|$ $(b)$
and the relative axial distribution of cross-sectionally integrated energy
$(b)$
and the relative axial distribution of cross-sectionally integrated energy $(c)$
for initial energies
$(c)$
for initial energies $E_0 =1 \boldsymbol{\cdot }10^{-5}$
(blue/
$E_0 =1 \boldsymbol{\cdot }10^{-5}$
(blue/![]() ),
), $E_0 =2 \boldsymbol{\cdot }10^{-5}$
(orange/
$E_0 =2 \boldsymbol{\cdot }10^{-5}$
(orange/![]() ) and
) and $E_0 =4 \boldsymbol{\cdot }10^{-5}$
(green/
$E_0 =4 \boldsymbol{\cdot }10^{-5}$
(green/![]() ).
). $(d){-}(f)$
Contours of the cross-sectional velocity
$(d){-}(f)$
Contours of the cross-sectional velocity $\sqrt {u_r^2+u_{\theta }^2}$
for the optimal initial perturbation with an energy of
$\sqrt {u_r^2+u_{\theta }^2}$
for the optimal initial perturbation with an energy of $E_0=10^{-5}$
,
$E_0=10^{-5}$
, $E_0=2 \boldsymbol{\cdot }10^{-5}$
and
$E_0=2 \boldsymbol{\cdot }10^{-5}$
and $E_0=4\boldsymbol{\cdot }10^{-5}$
, respectively. The axial position corresponds to the position of maximum cross-sectionally integrated energy. All simulations were performed at
$E_0=4\boldsymbol{\cdot }10^{-5}$
, respectively. The axial position corresponds to the position of maximum cross-sectionally integrated energy. All simulations were performed at ${\textit{Re}}=1750$
,
${\textit{Re}}=1750$
, $L_z=\pi$
with a spatial resolution of
$L_z=\pi$
with a spatial resolution of $(N_r,M,K)=(38,16,21)$
and a time step of
$(N_r,M,K)=(38,16,21)$
and a time step of $\Delta t=0.01$
.
$\Delta t=0.01$
.
A.1. Optimal perturbations in steady pipe flow
First, nonlinear optima were computed in short $L_z=\pi$
long pipes at
$L_z=\pi$
long pipes at ${\textit{Re}} = 1750$
for Hagen–Poiseuille flow (Pringle & Kerswell Reference Pringle and Kerswell2010). We set the optimisation time to
${\textit{Re}} = 1750$
for Hagen–Poiseuille flow (Pringle & Kerswell Reference Pringle and Kerswell2010). We set the optimisation time to $\tau =80$
and initialise the optimisation procedure with a turbulent field, obtained for the same Reynolds number and domain, rescaled to the initial energy of
$\tau =80$
and initialise the optimisation procedure with a turbulent field, obtained for the same Reynolds number and domain, rescaled to the initial energy of $E_0$
. In figure 11(
$E_0$
. In figure 11( $a$
), we plot the evolution of the energy gain at the optimisation time,
$a$
), we plot the evolution of the energy gain at the optimisation time, $G(t=\tau )$
, over the adjoint looping iterations for three initial energies. For the lowest initial energy of (
$G(t=\tau )$
, over the adjoint looping iterations for three initial energies. For the lowest initial energy of ( $E_0=10^{-5}$
), the adjoint looping procedure quickly improved the initial perturbation and, after
$E_0=10^{-5}$
), the adjoint looping procedure quickly improved the initial perturbation and, after $s\approx 10$
iterations, the initial perturbation smoothly approached an optimum. The procedure was terminated after the relative improvement of the growth fell below a threshold, here
$s\approx 10$
iterations, the initial perturbation smoothly approached an optimum. The procedure was terminated after the relative improvement of the growth fell below a threshold, here $\mathcal{R}=|(G^{s+1}-G^{s})/G^{s+1}|\lt 10^{-8}$
(see figure 11
$\mathcal{R}=|(G^{s+1}-G^{s})/G^{s+1}|\lt 10^{-8}$
(see figure 11 $b$
). This is a very conservative limit and does not reflect the accuracy of the determined optimal growth, i.e. discretisation errors are larger. However, we have observed that the optimisation can stagnate at relatively low levels, e.g.
$b$
). This is a very conservative limit and does not reflect the accuracy of the determined optimal growth, i.e. discretisation errors are larger. However, we have observed that the optimisation can stagnate at relatively low levels, e.g. $\mathcal{R}\approx 10^{-5}$
before a further substantial improvement occurs, especially for longer pipes. A similar behaviour was observed by Pringle et al. (Reference Pringle, Willis and Kerswell2012). In figure 11(
$\mathcal{R}\approx 10^{-5}$
before a further substantial improvement occurs, especially for longer pipes. A similar behaviour was observed by Pringle et al. (Reference Pringle, Willis and Kerswell2012). In figure 11( $c$
), we show the cross-sectionally integrated energy of the initial perturbation as a function of
$c$
), we show the cross-sectionally integrated energy of the initial perturbation as a function of $z$
. The optimal perturbation corresponds to the linear optimum, consisting of a pair of streamwise independent vortices (
$z$
. The optimal perturbation corresponds to the linear optimum, consisting of a pair of streamwise independent vortices ( $m=1,\ k=0$
), shown in figure 11(
$m=1,\ k=0$
), shown in figure 11( $d$
). Integrating this optimal perturbation in time leads to the well-known formation of streaks due to lift-up effect (not shown here). These streaks grow in strength and the perturbation energy reaches a maximum amplification of
$d$
). Integrating this optimal perturbation in time leads to the well-known formation of streaks due to lift-up effect (not shown here). These streaks grow in strength and the perturbation energy reaches a maximum amplification of $G_{\textit{max}} \approx 219$
at
$G_{\textit{max}} \approx 219$
at $t=85.05$
(see figure 12
$t=85.05$
(see figure 12 $a$
), in line with previous studies (Meseguer & Trefethen Reference Meseguer and Trefethen2003; Pringle & Kerswell Reference Pringle and Kerswell2010). Due to the absence of three-dimensional fluctuations, the streaks remain stable and, ultimately, viscous effects lead to an exponential decay of the perturbation.
$a$
), in line with previous studies (Meseguer & Trefethen Reference Meseguer and Trefethen2003; Pringle & Kerswell Reference Pringle and Kerswell2010). Due to the absence of three-dimensional fluctuations, the streaks remain stable and, ultimately, viscous effects lead to an exponential decay of the perturbation.

Figure 12. $(a)$
Evolution of the growth rate over time for the initial energies
$(a)$
Evolution of the growth rate over time for the initial energies $E_0 =1 \boldsymbol{\cdot }10^{-5}$
(blue/
$E_0 =1 \boldsymbol{\cdot }10^{-5}$
(blue/![]() ),
), $E_0 =2 \boldsymbol{\cdot }10^{-5}$
(orange/
$E_0 =2 \boldsymbol{\cdot }10^{-5}$
(orange/![]() ) and
) and $E_0 =4 \boldsymbol{\cdot }10^{-5}$
(green/
$E_0 =4 \boldsymbol{\cdot }10^{-5}$
(green/![]() ).
). $(b)$
Evolution of the NLOP with initial energy of
$(b)$
Evolution of the NLOP with initial energy of $E_0=2 \boldsymbol{\cdot }10^{-5}$
at times
$E_0=2 \boldsymbol{\cdot }10^{-5}$
at times $t=0$
,
$t=0$
, $t=1.6$
,
$t=1.6$
, $t=4$
,
$t=4$
, $t=10$
,
$t=10$
, $t=20$
,
$t=20$
, $t=40$
and
$t=40$
and $t=80$
(from left to right). The mean flow is from bottom to top and isocontours depict
$t=80$
(from left to right). The mean flow is from bottom to top and isocontours depict $+30\%$
(orange) and
$+30\%$
(orange) and $-30\%$
(blue) of the maximum axial perturbation velocity.
$-30\%$
(blue) of the maximum axial perturbation velocity. $(c)$
Same as
$(c)$
Same as $(b)$
for
$(b)$
for $E_0=4 \boldsymbol{\cdot }10^{-5}$
.
$E_0=4 \boldsymbol{\cdot }10^{-5}$
.
For an increased initial energy ( $E_0 =2 \boldsymbol{\cdot }10^{-5}$
), the optimisation procedure identified an optimum after approximately
$E_0 =2 \boldsymbol{\cdot }10^{-5}$
), the optimisation procedure identified an optimum after approximately $s\approx 30$
iterations, and experienced a significantly higher growth. In figures 11(
$s\approx 30$
iterations, and experienced a significantly higher growth. In figures 11( $c$
) and 11(
$c$
) and 11( $e$
) we show that this perturbation localises in all directions. As shown in figure 12, this NLOP exploits the Orr mechanism to achieve an initial energy boost. Once the strong axial velocity layers align with the shear, oblique waves dominate the flow. The perturbation further gains energy in this second (oblique wave) phase and during its nonlinear evolution, energy is transferred to the streamwise independent modes. This initiates the third phase, in which the flow becomes increasingly two-dimensional and the energy grows due to the lift-up effect. Sequentially utilising these various growth mechanisms allows this NLOP to reach a significantly higher maximum growth of
$e$
) we show that this perturbation localises in all directions. As shown in figure 12, this NLOP exploits the Orr mechanism to achieve an initial energy boost. Once the strong axial velocity layers align with the shear, oblique waves dominate the flow. The perturbation further gains energy in this second (oblique wave) phase and during its nonlinear evolution, energy is transferred to the streamwise independent modes. This initiates the third phase, in which the flow becomes increasingly two-dimensional and the energy grows due to the lift-up effect. Sequentially utilising these various growth mechanisms allows this NLOP to reach a significantly higher maximum growth of $G_{\textit{max}}=560.6$
at
$G_{\textit{max}}=560.6$
at $t=73.4$
, but ultimately the perturbation decays.
$t=73.4$
, but ultimately the perturbation decays.
By further increasing the initial energy ( $E_0 =4 \boldsymbol{\cdot }10^{-5}$
), an optimum with even higher growth was identified, however, the optimisation procedure did not converge in this case (we continued the optimisation procedure for
$E_0 =4 \boldsymbol{\cdot }10^{-5}$
), an optimum with even higher growth was identified, however, the optimisation procedure did not converge in this case (we continued the optimisation procedure for $s=350$
iterations). The perturbation computed in the last iteration is qualitatively similar to the NLOP at
$s=350$
iterations). The perturbation computed in the last iteration is qualitatively similar to the NLOP at $E_0 =2 \boldsymbol{\cdot }10^{-5}$
(see figures 11
$E_0 =2 \boldsymbol{\cdot }10^{-5}$
(see figures 11 $c$
and 11
f). In figure 12, we plot the temporal evolution of energy panel (a) and isocontours of the axial velocity panel (b,c). This perturbation causes significantly stronger streaks, which become unstable and turbulence is triggered. It is above the minimal seed (Pringle & Kerswell Reference Pringle and Kerswell2010), where many perturbations of energy
$c$
and 11
f). In figure 12, we plot the temporal evolution of energy panel (a) and isocontours of the axial velocity panel (b,c). This perturbation causes significantly stronger streaks, which become unstable and turbulence is triggered. It is above the minimal seed (Pringle & Kerswell Reference Pringle and Kerswell2010), where many perturbations of energy $E_0$
are capable of triggering turbulence. Since the kinetic energy of the turbulent flow changes with time, the precise value of
$E_0$
are capable of triggering turbulence. Since the kinetic energy of the turbulent flow changes with time, the precise value of $G$
obtained depends sensitively on the initial condition and no convergence occurs (Pringle et al. Reference Pringle, Willis and Kerswell2012).
$G$
obtained depends sensitively on the initial condition and no convergence occurs (Pringle et al. Reference Pringle, Willis and Kerswell2012).
The computed NLOPs show larger growth than those reported by Pringle & Kerswell (Reference Pringle and Kerswell2010), however, their structure and evolution are qualitatively in good agreement. We suspect that the difference in the growth originates from the localisation in the axial direction, which was not found in Pringle & Kerswell (Reference Pringle and Kerswell2010) and Pringle et al. (Reference Pringle, Willis and Kerswell2012) for short domains.
An axially localised nonlinear optimum was previously reported in Pringle et al. (Reference Pringle, Willis and Kerswell2012) for longer pipes ( $L_z=10$
) at
$L_z=10$
) at ${\textit{Re}}=2400$
and
${\textit{Re}}=2400$
and $\tilde {E}_0=E_0/E_{lam}=7.077\boldsymbol{\cdot }10^{-6}$
. We performed an optimisation for the same parameters and also found a localised perturbation (see figure 13). Slightly increasing the initial energy to
$\tilde {E}_0=E_0/E_{lam}=7.077\boldsymbol{\cdot }10^{-6}$
. We performed an optimisation for the same parameters and also found a localised perturbation (see figure 13). Slightly increasing the initial energy to $\tilde {E}_0=7.124\boldsymbol{\cdot }10^{-6}$
triggers turbulence transition. Thus the minimal seed for this set-up lies in between
$\tilde {E}_0=7.124\boldsymbol{\cdot }10^{-6}$
triggers turbulence transition. Thus the minimal seed for this set-up lies in between $7.077\boldsymbol{\cdot }10^{-6} \leq \tilde {E}_0 \leq 7.124\boldsymbol{\cdot }10^{-6}$
(see figure 13), which is in agreement with the results reported by Pringle et al. (Reference Pringle, Willis and Kerswell2012).
$7.077\boldsymbol{\cdot }10^{-6} \leq \tilde {E}_0 \leq 7.124\boldsymbol{\cdot }10^{-6}$
(see figure 13), which is in agreement with the results reported by Pringle et al. (Reference Pringle, Willis and Kerswell2012).

Figure 13. Axial distribution of cross-sectionally integrated energy, normalised with $E_0$
,
$E_0$
, $(a)$
and growth over time
$(a)$
and growth over time $(b)$
for the initial energies
$(b)$
for the initial energies $\tilde {E}_0=E_0/E_{\text{lam}}=7.077\boldsymbol{\cdot }10^{-6}$
(blue/
$\tilde {E}_0=E_0/E_{\text{lam}}=7.077\boldsymbol{\cdot }10^{-6}$
(blue/![]() ) and
) and $\tilde {E}_0=E_0/E_{\text{lam}}=7.124\boldsymbol{\cdot }10^{-6}$
(orange/
$\tilde {E}_0=E_0/E_{\text{lam}}=7.124\boldsymbol{\cdot }10^{-6}$
(orange/![]() ) at
) at ${\textit{Re}}=2400$
,
${\textit{Re}}=2400$
, $L_z=10$
.
$L_z=10$
.
A.2. Linear optimal perturbations in pulsatile pipe flow
As shown by Xu et al. (Reference Xu, Song and Avila2021), a new linear optimum emerges for pulsation frequencies $4\lesssim \textit{Wo} \lesssim 18$
and pulsation amplitudes
$4\lesssim \textit{Wo} \lesssim 18$
and pulsation amplitudes $A\gtrsim 0.4$
. This optimal perturbation has a helical shape and utilises the Orr mechanism and the instantaneous linear instability of the laminar profile (Morón et al. Reference Morón, Feldmann and Avila2022) to outgrow the classical LOP (pair of streamwise independent vortices) by many orders of magnitude (Xu et al. Reference Xu, Song and Avila2021). To validate our code for pulsatile base flows, we computed optimal perturbations in the linear regime (
$A\gtrsim 0.4$
. This optimal perturbation has a helical shape and utilises the Orr mechanism and the instantaneous linear instability of the laminar profile (Morón et al. Reference Morón, Feldmann and Avila2022) to outgrow the classical LOP (pair of streamwise independent vortices) by many orders of magnitude (Xu et al. Reference Xu, Song and Avila2021). To validate our code for pulsatile base flows, we computed optimal perturbations in the linear regime ( $E_0=1\boldsymbol{\cdot }10^{-20}$
) at
$E_0=1\boldsymbol{\cdot }10^{-20}$
) at ${\textit{Re}}=2000$
,
${\textit{Re}}=2000$
, $A=1$
,
$A=1$
, $L_z=10$
for Womersley numbers
$L_z=10$
for Womersley numbers ${\textit{Wo}}\in [2,12,15,20]$
. Based on the results in Xu et al. (Reference Xu, Song and Avila2021), we introduce the perturbation at time
${\textit{Wo}}\in [2,12,15,20]$
. Based on the results in Xu et al. (Reference Xu, Song and Avila2021), we introduce the perturbation at time $\tau _0\approx T/2$
and aim to maximise the growth at the final time
$\tau _0\approx T/2$
and aim to maximise the growth at the final time $t_f=\tau _0+\tau$
. Here, we set the optimisation times of the adjoint looping procedure to
$t_f=\tau _0+\tau$
. Here, we set the optimisation times of the adjoint looping procedure to $\tau \in [0.02T,0.7T,0.7T,3.5T]$
for
$\tau \in [0.02T,0.7T,0.7T,3.5T]$
for ${\textit{Wo}}\in [2,12,15,20]$
, respectively, where
${\textit{Wo}}\in [2,12,15,20]$
, respectively, where $T=\pi \textit{Re}/(2\textit{Wo}^2)$
is the dimensionless period.
$T=\pi \textit{Re}/(2\textit{Wo}^2)$
is the dimensionless period.
In figure 14, we plot the growth evolution of the computed optimal perturbations, together with isocontours of the axial velocity and contours of the cross-sectional velocity. For a low Womersley number of ${\textit{Wo}}=2$
, we obtained the classical optimal consisting of a pair of streamwise vortices (see figure 14
${\textit{Wo}}=2$
, we obtained the classical optimal consisting of a pair of streamwise vortices (see figure 14 $d$
). With a pulsation period much higher than the convective time scale, this perturbation grows on top of the quasi-steady profile and reaches a maximum amplification at
$d$
). With a pulsation period much higher than the convective time scale, this perturbation grows on top of the quasi-steady profile and reaches a maximum amplification at $t\approx 90$ $(0.029T)$
.
$(0.029T)$
.

Figure 14. $(a)$
Growth over time for
$(a)$
Growth over time for ${\textit{Wo}}=2$
(blue/
${\textit{Wo}}=2$
(blue/![]() ),
), ${\textit{Wo}}=12$
(orange and black/
${\textit{Wo}}=12$
(orange and black/![]() ),
), ${\textit{Wo}}=15$
(green/
${\textit{Wo}}=15$
(green/![]() ) and
) and ${\textit{Wo}}=20$
(red/
${\textit{Wo}}=20$
(red/![]() ) at
) at $(Re,A)=(2000,1)$
. For
$(Re,A)=(2000,1)$
. For ${\textit{Wo}}=12$
(orange and black/
${\textit{Wo}}=12$
(orange and black/![]() ), we show the growth of a symmetric pair of oblique waves (black) and a helical wave perturbation (orange).
), we show the growth of a symmetric pair of oblique waves (black) and a helical wave perturbation (orange). $(b),(c)$
Isocontours of
$(b),(c)$
Isocontours of $\pm 30\%$
of the maximum axial velocity of a symmetric pair of oblique waves and a helical wave perturbation, respectively.
$\pm 30\%$
of the maximum axial velocity of a symmetric pair of oblique waves and a helical wave perturbation, respectively. $(d){-}(f)$
Contours of the cross-sectional velocity
$(d){-}(f)$
Contours of the cross-sectional velocity $\sqrt {u_r^2+u_{\theta }^2}$
and quivers of the cross-sectional components
$\sqrt {u_r^2+u_{\theta }^2}$
and quivers of the cross-sectional components $u_r, \ u_\theta$
for the optimal streamwise vortices, symmetric pairs of oblique waves and a helical wave, respectively. All these optimisations were carried out with a constant time step of
$u_r, \ u_\theta$
for the optimal streamwise vortices, symmetric pairs of oblique waves and a helical wave, respectively. All these optimisations were carried out with a constant time step of $\Delta t = 0.01$
and a spatial resolution of
$\Delta t = 0.01$
and a spatial resolution of $(N_r,M,K)=(38,16,64)$
.
$(N_r,M,K)=(38,16,64)$
.
Increasing the Womersley numbers to ${\textit{Wo}}=12$
and
${\textit{Wo}}=12$
and ${\textit{Wo}}=15$
, led to qualitatively different optima, which experienced an exponential growth phase and ultimately reached a much higher energy gain. The optimum at
${\textit{Wo}}=15$
, led to qualitatively different optima, which experienced an exponential growth phase and ultimately reached a much higher energy gain. The optimum at ${\textit{Wo}}=12$
is a symmetric pair of oblique waves with an equal contribution of the azimuthal modes
${\textit{Wo}}=12$
is a symmetric pair of oblique waves with an equal contribution of the azimuthal modes $m=1$
and
$m=1$
and $m=-1$
(see figures 14
$m=-1$
(see figures 14 $b$
and 14
$b$
and 14 $e$
). However, depending on the initial guess, we also found a helical wave with an azimuthal wavenumber of
$e$
). However, depending on the initial guess, we also found a helical wave with an azimuthal wavenumber of $m=1$
or
$m=1$
or $m=-1$
(see figures 14
$m=-1$
(see figures 14 $c$
and 14
$c$
and 14 $f$
) as in Xu et al. (Reference Xu, Song and Avila2021), or any linear combination, to be equally optimal. The energy of these optimal perturbations is concentrated in the axial mode
$f$
) as in Xu et al. (Reference Xu, Song and Avila2021), or any linear combination, to be equally optimal. The energy of these optimal perturbations is concentrated in the axial mode $k=8$
, corresponding to a structure that repeats eight times in the axial (periodic) direction, i.e. with an axial length of
$k=8$
, corresponding to a structure that repeats eight times in the axial (periodic) direction, i.e. with an axial length of $10/8$
radii. During the first stages, this perturbation experiences a strong initial energy boost via the Orr mechanism. In this process, the axial velocity layers tilt until they align with the shear. Once the velocity layers align with the shear, the perturbation experiences an exponential growth (see figure 14
$10/8$
radii. During the first stages, this perturbation experiences a strong initial energy boost via the Orr mechanism. In this process, the axial velocity layers tilt until they align with the shear. Once the velocity layers align with the shear, the perturbation experiences an exponential growth (see figure 14 $a$
). The exponential growth is attributed to the presence of inflection points of the laminar profile during the deceleration phase and its instantaneous linear instability (Morón et al. Reference Morón, Feldmann and Avila2022). In the linear regime, the entire energy remains in the initially excited modes during the perturbation’s evolution and, hence, the structure of the flow remains qualitatively similar.
$a$
). The exponential growth is attributed to the presence of inflection points of the laminar profile during the deceleration phase and its instantaneous linear instability (Morón et al. Reference Morón, Feldmann and Avila2022). In the linear regime, the entire energy remains in the initially excited modes during the perturbation’s evolution and, hence, the structure of the flow remains qualitatively similar.
Qualitatively, the same optima were found for ${\textit{Wo}}=15$
. The growth of these optimal perturbation is lower compared with
${\textit{Wo}}=15$
. The growth of these optimal perturbation is lower compared with ${\textit{Wo}}=12$
, due to the shorter period (Morón et al. Reference Morón, Feldmann and Avila2022). Further increasing the Womersley number to
${\textit{Wo}}=12$
, due to the shorter period (Morón et al. Reference Morón, Feldmann and Avila2022). Further increasing the Womersley number to ${\textit{Wo}}=20$
leads to much shorter period length and the optimisation recovers the classical optimal perturbation. All results are in excellent agreement with the results in Xu et al. (Reference Xu, Song and Avila2021).
${\textit{Wo}}=20$
leads to much shorter period length and the optimisation recovers the classical optimal perturbation. All results are in excellent agreement with the results in Xu et al. (Reference Xu, Song and Avila2021).


 Open access